Category Propellor Aerodynamics

Prop Blade Loading

Prop blade loading is equal to the BHP divided by the prop blade area (BHP/PBA), as opposed to prop disc loading, which is BHP divided by prop disc area (BHP/PDA).

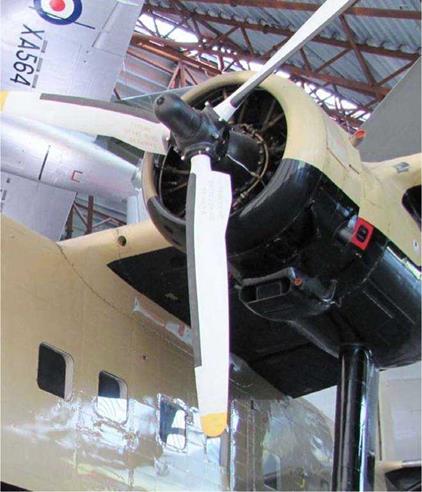
The Scottish Aviation Twin Pioneer of 1955 vintage has three, high – aspect ratio prop blades, de-iced with a curved leading edge and a trailing edge cuff. It is housed in the RAF Cosford Museum, England.

Подпись: HP/sq.ft

Prop Blade Loading

Prop blade loading =

Prop blade area

Increasing the number of blades can reduce the prop blade loading for a given prop. It is akin to wing loading where the

reduced strength of air circulation and a reduction in the air flow velocity over the prop blades causes a reduction in prop blade loading (or wing loading). The reduced air flow over the prop blades may at first be puzzling when examining Diagram 16, Forces in Cruise Flight, which shows the ‘relative air flow’ to be dependant on the RPM and forward velocity. As the air mass flow approaches the prop disc, the velocity in front of the prop disc increases and then decreases behind the prop disc; with increased blade area (reduced blade loading) the air circulation over the blades is reduced.

Aspect Ratio

The blade’s chord along with its length determines the aspect ratio. The aspect ratio is defined as the ratio of prop radius to prop chord (R/C). A high aspect ratio prop blade – one with a narrow chord – is generally more efficient than a low aspect ratio or wide chord blade. A high aspect ratio blade shares the same characteristics with a high aspect ratio wing; the strength of the trailing edge and tip vortices is reduced. Therefore, the induced drag is also reduced, which increases the prop’s lift/drag ratio and hence, efficiency. But there is a limit to the blade’s high aspect ratio; problems may occur with blade stall and the strength of the blades due to the various forces acting on them. [See Prop Stress].

A prop with a low aspect ratio blade is known as a ‘paddle blade’ It has greater solidity and a higher activity factor, and will absorb more engine power than a high aspect ratio blade. But its efficiency may be reduced due to the blade wake affecting the thrust produced by the flowing blades. A wide chord blade also places more stress on the pitch change mechanism

Number of Blades

The solidity of the prop can be increased to absorb more power by increasing the number of blades mounted on the prop. However, there is a limit to the number of blades that can be used. Five-blades are the accepted maximum number for a metal prop and now, up to eight for a composite prop;

however, that is encroaching into the realm of Propfans. Six or more blades can be used on a composite prop due to their lower weight and superior efficiency over metal blades. The reason for the restriction on the number of blades is the air cascading over the following blades causing interference drag and reducing efficiency. A greater number of blades not only produce more thrust, but also more drag at the idle power settings which can be used to advantage by acting like an air brake. The cruise speed can be quickly reduced to approach speed combined with an increased rate of descent when desired.

Number of Blades

BHP

Diagram 14, Prop Diameter v. BHP

Using three or more blades on a prop in place of a two – blade prop can be aesthetically pleasing, and hint at higher performance although this may not always be so. For example, the Cessna 207 light aircraft maybe equipped with either an 82 inch two-blade prop or the optional three-blade prop with a slightly smaller diameter. However, to quote from the Cessna 207 owner’s manual (POH), “There is no significant performance change with the three-blade propeller”. In contrast to this, when Piper Aircraft developed the Piper

Malibu, they found a two-blade prop gave the aircraft better performance in the cruise than that obtained from a three – blade prop. This may be attributed to prop blade loading; during low-speed operations such as take-off and climb, the three-blade prop has a lower prop loading. It can absorb more power and increase the static prop thrust, which in turn, will increase the initial acceleration during the take-off roll and improve the rate of climb. In effect, the three-blade prop does not have to work so hard. It is more efficient than a two-blade prop at lower speeds. At the higher speeds of cruise flight, the thrust available and hence the prop blade loading is lower still. This makes it more difficult for a three-blade prop to maintain a sufficiently high lift/drag ratio along with high efficiency. This may become evident with a slight loss in cruise speed, especially at higher altitudes. The aerodynamic drag can be

Number of Blades

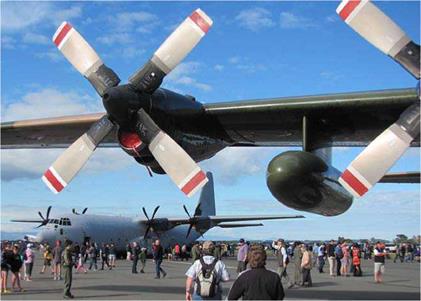
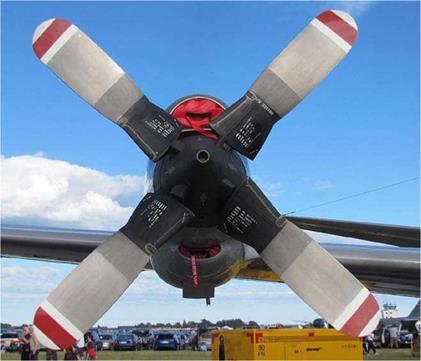
The Lockheed C-130J with six-blade scimitar props in the distance, is overshadowed by the older Lockheed C-130H with four-blade, square-tip propellers.

expected to be less when the prop blade loading is low, which is usually found on three-blade props at cruise speed. On the other hand, a lightly loaded three-blade prop can produce as much drag as a two-blade prop. A two-blade prop with less solidity will suffer from too high prop blade loading and will be less efficient during take-off and climb. During cruise flight, the prop blade loading will be relatively higher than a three-blade propeller. This will enable the two-blade prop to produce a better lift/drag ratio and greater efficiency during cruise flight.

The number of blades also affects the vibration produced by the prop . It is a well-known fact amongst pilots that a prop with three or more blades runs smoother than a two-blade propeller. It was mentioned above; increasing the number of blades reduces prop blade loading and therefore less thrust per blade. This results in the vibration’s frequency being raised resulting in a reduction in the amplitude of vibration. When the prop produces higher vibration frequencies, the amount of vibration transmitted through the airframe to the occupants is less discernible and is felt as a smoother running engine.

There are many variables involved in determining a propeller’s efficiency. The aircraft designer must decide at what true air speed the two-blade prop becomes a better option than a three-blade prop. It was mentioned above; the three-blade prop produces better performance and efficiency during take-off and climb. Therefore, if the performance can be maintained right up through the normal cruise speed, then the three-blade prop is the right choice for that aircraft type. If the three-blade prop loses efficiency before the aircraft reaches its design cruise speed, then the designer is more likely to opt for a two-blade propeller. It all depends at what true air speed the three-blade prop becomes more efficient than a two – blade propeller mounted on that particular type of aircraft. Of course, the same argument applies when we compare a three-

Number of Blades

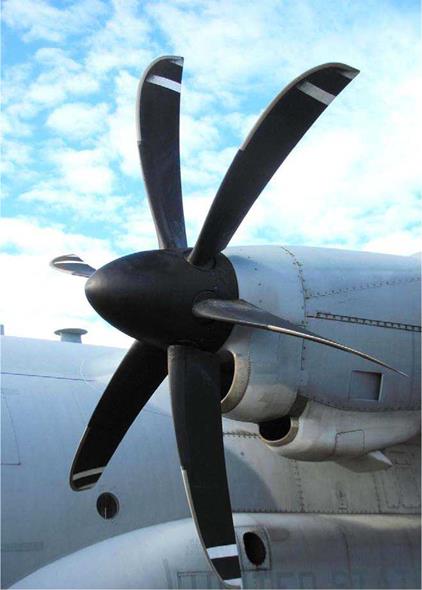
A close up view of the six-blade scimitar propellers
of the Lockheed C-130J Hercules.


blade propeller with a four-blade unit, or a four-blade prop with a five-blade prop, etc.

In conclusion, a three-blade propeller is better for take-off and climb performance with the added benefit of reduced noise and less vibration, but a two-blade prop may, or may not, produce better cruise performance. As with most things aeronautical, it is again a matter of compromise.

Prop Diameter

Reference to Diagram 14, Prop Diameter V. BHP, it can be seen what increase in diameter is required on a two-blade prop if the brake horsepower in increased. If the increase in diameter is unacceptable for any reason, then the next choice is to use a prop with three blades. The fictitious aircraft example with a 200 BHP engine, a two-blade prop of 74 inches could be used. If the 200 BHP engine was replaced with a 250 BHP engine, it would require a prop of 77 inches. But, if this diameter is too large the next choice is a three-blade prop of 74.5 inches . [Note this diagram is not a true one but hand drawn to illustrate the point being made].

The prop diameter on a single-engine aircraft may be limited by ground clearance or, on a multi-engine aircraft, clearance between the prop tips and the aircraft’s structure and the ground, which must be taken into consideration. Propeller tip clearance must comply with the certification regulations; for example, the American FAA regulations require a minimum clearance between the tips and the ground of seven inches (17.78 cm) for nose wheel aircraft and nine inches (22.86 cm) for tail-wheel aircraft

Solidity

Each prop has a maximum limit to the amount of thrust it can produce. If the aircraft designer requires more thrust, then a prop with greater solidity will be required. Solidity is the ratio

Solidity

The Lockheed P3-C Orion has wide chord, paddle blades with blade root cuffs for greater solidity and improved intake air flow.

of total blade area to total prop disc area, which can be found from the following formula:

Solidity = S/nR2

Where S = total blade area tcR2 = prop disc area

A two-blade propeller has a solidity of about 0.08 increasing up to around 0.16 for a four-blade propeller. Solidity, and therefore thrust, can be increased by using a prop with either:

• A greater diameter

• A greater number of blades, or

Wider chord blades.

The propeller diameter has greater influence on power absorption than the number of blades or blade chord.

Power Absorption

The amount of engine BHP a prop can absorb and convert to thrust depends on a variety of factors, including the prop’s diameter, number of blades, the blade’s aspect ratio, which all have an affect on the solidity of the prop, while the engine’s BHP and the prop disc area determine the amount of prop disc loading

Activity Factor

Each different type of aircraft can accept a range of engines of varying amounts of horsepower, within certain limits. Likewise, each engine can accept a variety of propellers, also within certain limits. One of these limitations is the propeller’s ability to absorb the power provided by the engine. How much power the prop can absorb is measured by the ‘activity factor’. In the fictitious aircraft example presented here, the maximum thrust horsepower available is 84% of the engine’s BHP; therefore, the activity factor is 0.84. The activity factor is just another way of expressing the prop’s efficiency.

Power to the Prop

The power output of a piston engine is found by coupling the engine to a test-bed dynamometer. The device measures the torque or turning force of the engine crankshaft in pounds – foot (not to be confused with foot-pounds of work). The torque in pounds-foot can be converted mathematically into brake horsepower by the following formula:

= 2п х torque х RPM BHP = 33,000

The word ‘brake’ as in brake horsepower is taken from the dynamometer’s alternate name of ‘Prony brake’. In practice, the BHP is given to indicate the power of a piston engine. Manifold pressure and RPM are selected by the pilot to produce a required percentage of BHP. For turboprops the term used is shaft horsepower (SHP) or equivalent shaft horsepower (ESHP) if the jet exhaust produces some propulsive thrust.

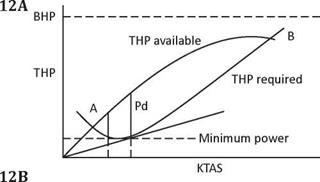
The maximum BHP for the engine can be plotted on a graph as shown in Diagram 12, Thrust & Power Curves. These are the performance curves familiar to all students of aerodynamics.

Power to the Prop

Power to the Prop

The maximum BHP is considered here to be a constant, but the BHP produced at any given time does vary under the constraints of increased altitude, temperature, power settings and supercharging. Power is the rate of doing work; that is, force or thrust times velocity.

The thrust horsepower available curve is plotted on the graph against KTAS after multiplying the BHP by the propeller efficiency. The THP will never be as great as the BHP due to the prop’s deficiencies. The performance curves for the THP available, unlike the straight BHP available curve, increases steeply up to the prop’s design speed and then reduces again to indicate the propulsive efficiency variation with increasing KTAS. The thrust horsepower required curve is the power required to equal the aircraft’s aerodynamic drag. This curve is calculated for various speeds and plotted after being calculated from the following formula:

T = drag (lbs) x velocity factor

Подпись: Or THPdrag x velocity x 60
33,000

Where Thrust = prop thrust in lb Velocity = FPS, MPH or knots 550 = factor for FPS 375 = factor for MPH 325 = factor for knots

An inspection of Diagram 12A, The Thrust & Power Curves, reveals various aspects of the aircraft’s performance parameters. Points ‘A’ and ‘B’ on the THP curve shows the minimum and maximum speeds for straight and level flight respectively. The line ‘Pd’ represents the maximum power differential, or the ‘excess thrust horsepower’ which produces the greatest rate of climb. A propeller is designed to be most
efficient at the aircraft’s design cruise speed. Above and below the design cruise speed the prop’s thrust and efficiency deteriorate. If the thrust were constant, then the aircraft would achieve its maximum rate of climb at the minimum horsepower required speed, but due to the loss in propeller efficiency, the maximum rate of climb is slightly higher than the minimum power speed.

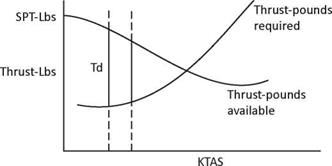
Moving on to Diagram 12B, shows the curve for ‘thrust – pounds available’ from the propeller and the second curve represents the ‘thrust-pounds required’ to equal the aircraft’s drag. The prop’s thrust is at a maximum at full engine power and zero forward velocity and decreases as the aircraft accelerates. At zero forward speed the thrust is known as ‘static prop thrust’ measured in pounds (SPT-lbs, on the diagram) when referring to a piston-engine and turboprop aircraft, as opposed to ‘static thrust’ when referring to jet engines. The prop produces on average between 2-6 pounds of static prop thrust per BHP. On the thrust-pounds curve (Diagram 12B) the line ‘Td’ represents the maximum thrust differential available from the propeller, as opposed to the maximum excess thrust horsepower shown in Diagram 12A. Notice this speed is slightly lower than that for maximum rate of climb and at this speed the maximum angle of climb will be achieved.

Using the figures given previously for a fictitious aircraft, the thrust horsepower can be found mathematically at the design cruise speed, followed by an alternate method to find the prop’s efficiency. Given the engines maximum power of 200 BHP and a prop efficiency of 84% the THP available can be calculated:

THP available = BHP x prop efficiency = 200 x 0.84 = 168 THP available

Подпись:

Подпись: THP x 100% BHP Подпись: 168 x 100% 200
Подпись: Efficiency =

With the THP and BHP now known, the alternate method to find the prop efficiency is given as:

The propeller’s efficiency is expressed as a percentage of the ratio of power output to power input. The input is the BHP delivered from the engine to the prop and the output is the thrust horsepower delivered by the propeller. The formulas required for the BHP and THP were given earlier in this section. The thrust force delivered by the prop is found from the next formula:

Thrust = CTpN2D4

Where CT = thrust coefficient p = air density N = RPM

D = prop diameter

The power required from the engine to turn the propeller is found from the next formula:

Power = CPpN3D5

Where CP = power coefficient p = air density

N = RPM

D = prop diameter

Power to the Prop

From the above thrust and power formulas a further method can be used to find prop efficiency after cancelling air density

Power to the Prop

If these formulas are too complex, it can be simplified by a more straight forward formula. It has already been established the ratio of thrust horsepower to brake horsepower equals the prop’s efficiency. In addition, thrust power is thrust-force pounds times the aircraft’s speed in feet per second, or simply, TV ft-lbs/second. The power required to turn the propeller is BHP times 550 ft-lbs/second. This simplifies the propeller efficiency formula to:

Power output TV Efficiency = =

Power in P

Where T = thrust-force in pounds (or kg)

V = aircraft speed in FPS (or m/s)

P = BHP x 550 ft-lb/second (or joules)

Diagram 13, Thrust & Power Coefficients, shows the thrust & power coefficients (CT & CP respectively) plus prop efficiency plotted against V/ND. The thrust and power coefficients could be plotted against angle of attack, but being a variable quantity it is more convenient to plot against V/ ND. These types of graphs for a family of props are plotted by

Power to the Prop

the propeller manufacturer to determine the values of thrust and power coefficients for any given value of V/ND. Note the curve for Efficiency versus V/ND in Diagram 13, is the same as that included in Diagram 10, Efficiency v. TAS. In conclusion, the propeller’s efficiency can be found from various formulas, depending on which factors are available for the calculations.

Propulsive Efficiency

Propulsive efficiency, not to be confused with propeller efficiency, is the energy imparted to the aircraft, as a percentage of the energy produced by the propeller, or jet engine.

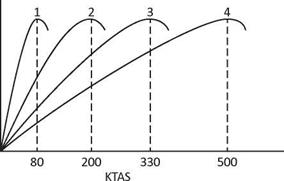
An inspection of Diagram 11, Propulsive Efficiency V. KTAS, compares the efficiency of the different types of aircraft propulsive systems, referred to here as the propulsor, piston-

prop engine, turboprop, Propfan and turbofan engines. At the average jet cruise speeds of around 500 KTAS, the efficiency of the turbofan is reaching its peak efficiency while the turbojet’s efficiency is still increasing and is good for speeds up to about 2000 knots and altitudes of 90,000 feet, making it more suitable for military aircraft such as supersonic fighters. The turbofan’s limit is reached around Mach 1.0 (575-661 knots where it fits the slot nicely between the turboprop’s and turbojet’s speed range making it ideal for Bizjets and air transport aircraft. Although the jet engine is very efficient for high cruise speeds at high altitudes, its fuel consumption is uneconomical at low speeds and low altitudes.

Подпись: Propulsive efficiency
Propulsive Efficiency

At the low end of the speed range the piston-engine/ propeller reigns supreme. However, like any airfoil, the prop obeys the laws of aerodynamics and its performance is limited by the constraints of decreasing air density with altitude and the effects of high speed The prop achieves its greatest propulsive efficiency at around 330 KTAS or so, depending on the type of engine driving the propeller The different engine

types are listed below to match the numbers above the curves on Diagram 11, Propulsive Efficiency V. KTAS, thus:

1 . Propulsor

2 .Piston-engine

3 . Turboprop

4 . Propfan and turbofan.

The curves are representative of the approximate average cruise speeds for each engine/propeller combination.

Propulsive efficiency is the product of propeller efficiency and the engine’s brake thermal efficiency expressed by the following formula:

Подпись:Propulsive efficiency =

Where Va = aircraft speed in FPS (feet per second)

Vj = propwash speed in FPS

This also will be covered in the section on ‘Propwash – thrust’. For propeller powered aircraft, the propwash velocity during cruise is nearly the same as the aircraft’s cruise speed. Therefore, the propeller and propulsive efficiency are both identical

– Thrust & Efficiency

Efficiency

In the early part of this book under the section ‘The Purpose of the Propeller’, it was stated, “The purpose of the propeller is to convert the engine torque into axial thrust, or propwash”. The statement can now be rephrased to read “the propeller produces the greatest axial thrust for the least amount of engine torque, when the maximum thrust/torque ratio is being produced”. How well the propeller converts the engine torque into axial thrust is measured by the propeller efficiency which in turn depends on several factors, namely, the prop’s diameter, solidity, number of blades, and prop blade loading to name a few. All of these factors and more will be covered in this chapter. Efficiency is therefore the best way to measure a prop’s performance; however it is not the whole story as will be revealed later. Thrust is a force that propels the aircraft through the air, but the efficiency is a measure of how well the prop succeeds in achieving this objective.

Given figures for a fictitious light aircraft, the propeller’s efficiency can be easily calculated using the following formula:

. 60 x TV x 100%

Efflclency = BHP x 33,000

Given: BHP = Brake Horsepower = 200

T = Thrust = 385 ponds

V = Air speed = 240 FPS = 142 kts

Подпись: 84%. 60 x 385 x 100%

Efficiency = 200 x 33,000

The above answer shows the prop’s efficiency to be 84%, which is a fairly good result; most metal props have a peak efficiency of around 80%. The remaining 16% of engine power
is used in counteracting the losses from friction, ancillary drive and exhaust gasses, etc. From the above formula a curve can be drawn with efficiency and true air speed as parameters, as in Diagram 10, Efficiency V. TAS. The curve is drawn for a fictitious aircraft example with a metal prop, showing the curve peaks at 84% prop efficiency at the design air speed of 142 knots. Above and below this figure the maximum efficiency deteriorates for a given speed. The lower curve is drawn for a theoretical wooden prop and shows its maximum efficiency peaks at 70%, due to greater blade thickness required for strength. A wood prop is not as structurally strong as a metal prop and so has to be built of thicker materials for extra strength, which is not as aerodynamically efficient. This is reflected in the wood prop’s curve being placed below that of the metal prop and the top curve representing a composite propeller, which is far more efficient than a metal or wooden prop. In comparison, marine propellers have an efficiency of around 56%.

- Thrust & Efficiency

Diagram 10, Efficiency V. True Air Speed

Diagram 10, represents the efficiency for a fixed pitch prop and is similar to the graphs in Diagrams 6 and 7 . The sharp angle of the curve is due to the decreasing efficiency at the lower speed ratios (V/nd). Consider the ratio V/nd, if ‘V’ (true air speed) is zero then the prop’s efficiency would also be zero and the aircraft would not move from a stationary position. However, due to the propeller’s rotation it still moves a large mass of air rearwards at a low velocity producing ‘static thrust’. This is what moves the aircraft from a stationary position. Static prop thrust will be covered in greater detail in the section on ‘Propwash-thrust’; that is where the axial momentum theory takes over from the blade element theory.

An alternative formula to find the efficiency of the prop is as follows:

„rr. . thrust x TAS

Efflclency = drag x RPM

This formula is reduced to read thrust/drag ratio (T/D) and TAS/RPM ratio, otherwise known as the speed ratio. Any change in the prop’s helix angle due to a change in either RPM or true air speed will increase one ratio and decrease the other by a like amount. The thrust is required to be as high as possible, because greater thrust equates to greater forward speed for a given horsepower. Conversely, drag is required to be as low as possible – less drag gives a higher forward speed for a given thrust; that is, a high thrust/drag ratio is required. Too high a prop tip speed due to high RPM introduces many problems, which will be dealt with later.

Variable Pitch & Constant Speed Propellers

Back in the early days of aviation, the limitations of the fixed pitch prop soon became evident with the advent of higher – powered engines and the greater speed range of newer types

Variable Pitch & Constant Speed Propellers

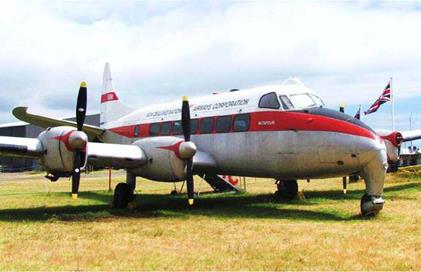
The DeHavilland Mark 1 Heron was the world s smallest airliner with four prop/engines.

of aircraft. Since the 1930s, high performance aircraft have used either a variable pitch or more commonly, constant – speed props.

Pilots quite often incorrectly refer to constant speed props as variable pitch props. It is true, the constant speed propeller does have a variable pitch change mechanism, but there is a difference here. The variable pitch props are simply that – variable; that is, they do not have constant speed ability. Variable pitch props can be classified under three basic headings of ground adjustable, two position, or controllable props. Two different methods are employed for changing the propeller’s pitch. On the ground adjustable type, after loosening the collar bolts on the round shank at the blade root, the blade angle is then adjusted to the required pitch; the bolts are then re-tightened on the collar. The second method is more convenient for the pilot, the pitch being adjusted by a control in the cockpit while in flight. The fine (or flat) pitch position is selected for take-off and climb. On reaching cruise altitude, the pitch control lever is moved to select coarse pitch. The controllable pitch propeller works on the same principle as the two-position prop but with the addition of a number of intermediate pitch positions available for selection between the fine and coarse pitch stops. Because a given pitch is selected at any one time, the engine RPM will vary in the same manner as a fixed pitch prop with changing air speed, power settings and prop loading. It is important to remember, a VP prop does not have a constant speed unit (CSU) and therefore will not maintain a constant RPM The types of VP props mentioned above are the most common types but, there have also been other less popular, or should I say, novel types?

Variable Pitch & Constant Speed Propellers

The Lockheed (L-1049) Constellation was the last of the piston/prop airliners to be built. It has four Wright R-3350 radial engines of 2200 BHP each, driving Hamilton Standard or Curtiss Electric constant-speed propellers. This aircraft is located in the Pima Air & Space Museum, Tucson, Arizona.

In 1934, a D. H. 88 Comet won the London to Melbourne air race. The two, 230 BHP engines powered two-blade VP French Ratier props. The Ratier’s unusual feature was their method of changing the blade angle. This was achieved by pressurising the pitch change mechanism cylinder with a bicycle pump to turn the blades to fine/flat pitch for take-off and climb. As the air speed increased, dynamic air pressure acting on a disc on the front of the prop spinner overcame the cylinder’s internal compressed air pressure and turned the blades to coarse pitch; and there they stayed for the remainder of the flight. There was no way to alter the pitch while airborne and the landing (and go-around if necessary) was flown with coarse pitch After landing, the cylinder was re-charged ready for the next flight.

Variable Pitch & Constant Speed Propellers

Diagram 7, VP & Constant Speed Props

There are a few aircraft in production today using variable pitch propellers. For this author, the Denny Kitfox and the Burkhart G109 Grob motor glider are two names that come to mind, however there are several homebuilt and ultralight aircraft that use VP propellers. The original Kitfox used a three – blade, wooden, ground adjustable variable pitch propeller. The

Grob has a two-blade, VP prop with a choice of three different pitch settings of fine, coarse and feathered. The feathered position is selected after the engine is shut down at altitude and the aircraft is flown as a glider, with the fine and coarse pitch settings being used in the normal manner for take-off and climb

The idea of having a selection of pitch settings on the VP prop was soon refined to produce the constant speed prop so widely used today, made possible by the invention of the constant speed unit (CSU) located at the prop hub, which may or may not be covered by a prop spinner. The CSU will be covered in greater detail later in this book

A diagram for a VP prop would show just two curves, for fine and coarse pitch only, as opposed to a diagram for a constant speed prop, which has an infinite number of curves. Refer to Diagram 7, VP & Constant Speed Props, which shows the fine

Variable Pitch & Constant Speed Propellers

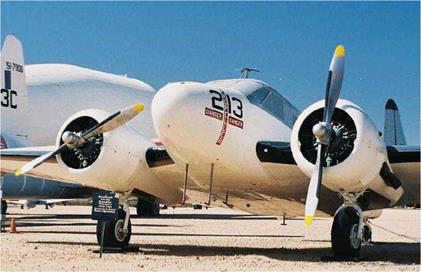
The Beech UC-45J Navigator has a pair of Hamilton Standard variable – pitch props each powered by a P&W Wasp 450 BHP engine. The Pima Air & Space Museum in Tucson, Arizona is home to this aircraft.

and coarse pitch performance curves for a VP propeller, which also represent the fine and coarse pitch limits for the constant speed prop with an infinite number of performance curves for the constant speed envelope. The dashed line along the top of the curves indicates the infinite performance curves and efficiency over the constant speed range. Apart from an overall increase in efficiency, the constant speed propeller has several other advantages over the fixed-pitch prop. Obviously, the RPM remains constant, hence the name, along with constant power for a given manifold/RPM setting. Also, decreasing air density with altitude is compensated for by an automatic increase in propeller pitch by the CSU.

Variable Pitch & Constant Speed Propellers

8A, Fine pitch

Variable Pitch & Constant Speed Propellers

8B, Coarse pitch

Diagram 8, Fine & Coarse Pitch

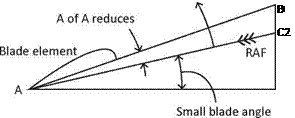
Diagram 8, Fine & Coarse Pitch, shows the advantages and disadvantages for using fine and coarse pitch for take-off and cruising respectively. Diagram 8A, shows the condition with fine/flat pitch selected for take-off, the usual setting. The small blade angle AB-AD and the resulting small angle of attack (AC2-AD) gives the thrust and efficiency required to provide the maximum acceleration to reduce the take-off run and to produce the maximum rate of climb. As the aircraft accelerates to cruise speed after levelling off at cruise altitude, the relative air flow line (A-C2) will ‘rise’ towards the extended chord line (A-D) as the advance per rev increases, in effect, increasing the length of the advance per rev line (B-C2). This results in a reduction in the angle of attack and therefore, a reduction in thrust and efficiency. This proves the necessity to increase the prop pitch to a coarse setting for cruise flight.

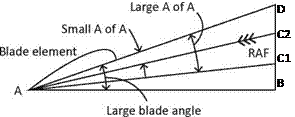
In Diagram 8B, Fine & Coarse Pitch, coarse pitch has been selected for take-off, which should never be used, by choice. The large blade angle (AB-AD) with its associated large angle of attack (AC1-AD) could possibly result in stalled propeller blades giving considerably reduced thrust and poor acceleration on take-off. Assume now, the correct setting of coarse pitch has been selected for the cruising speed. Due to the large blade angle (AB-AD) the advance per rev (B – C2) and the reduced angle of attack (AC2-AD) will be at the optimum angle of attack of about three degrees providing good efficiency.

The prop control is set to full fine/flat pitch for take-off and landing but for the remainder of the flight, the pilot selects a chosen engine RPM, not pitch. The constant speed unit to maintain a constant engine RPM is constantly adjusting the prop blade angle. If the manifold pressure is increased, the CSU will increase the blade angle automatically to absorb more engine power without any increase in RPM. Even with full fine/flat pitch set for take-off, the CSU will turn the blades

Variable Pitch & Constant Speed Propellers

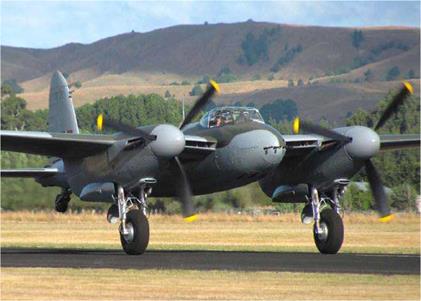
A DeHavilland DH.98 Mosquito on take-off with both props in fine/ flat pitch. This is the World’s only airworthy Mosquito in 2014.

to a slightly coarser pitch setting to prevent over speeding as the prop load is reduced with increasing take-off speed.

The prop will only ‘constant speed’ between its fine and coarse pitch limit stops. Below a pre-determined RPM, usually around 1500-1600 RPM on light aircraft piston-engines, the prop blades will reach their fine/flat pitch limit stop and RPM will vary the same as on a fixed pitch propeller with changing aerodynamic loads, air speed and power settings. This will occur for example during the approach to land with the throttle partly closed. The fine/flat pitch limit stop provides the optimum angle of attack for low speed operations, such as during take-off and landing. Some turboprop aircraft have a ‘ground fine/flat pitch’ setting; this is an ultra-fine/flat pitch setting with an angle of attack less than fine/flat pitch for ground operations only. It produces zero thrust while taxiing and saves on brake wear. The additional blade drag will reduce the landing roll distance for an aborted take-off. The use of ground fine/flat pitch is known as ‘discing’.

If the aircraft is placed into a steep descent, the constant speed unit will turn the blades towards coarse pitch to maintain the selected RPM. However, once the blades reach the coarse pitch limit stop, the RPM will increase along with increasing air speed; the prop is driven partly by the force of the air flow through the prop disc. The coarse pitch stop is there to prevent the prop blades moving in to an over-coarse pitch setting and prevent the propeller from over-speeding. When ‘feathering’ the propeller, the coarse pitch stop is removed, but more on feathering shortly.

The variable pitch range of a constant speed propeller will spread the design speed over a greater range of speeds, as opposed to only one air speed for a fixed pitch propeller. For either the fixed pitch or constant speed prop, the blade twist can only be suitable for one speed – the design air speed. At any other speed, off-point losses will occur but will be less for the constant speed propeller.

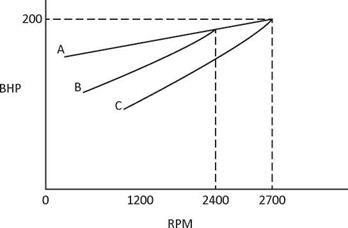
Diagram 9, Prop Load Curve, clarifies the point made above and in the previous section on fixed pitch propellers. Curve ‘A’ is the full throttle curve and represents the maximum power available from the engine at any given RPM. Curve ‘C’ represents the power absorbed by the propeller in fine/flat pitch; in this example, it produces the 200 BHP available at full revs (2700 RPM) indicated where the curves ‘A’ and ‘C’ coincide. Curve ‘B’ represents the power absorbed by the prop in coarse pitch. Full throttle is achieved before maximum RPM or maximum BHP is reached. This is usually the situation for a fixed pitch prop; on opening the throttle fully for take-off, the RPM peaks at around 2400 RPM until the aircraft’s forward speed increases and then the RPM will gradually increase to its maximum value. Some pilots refer to fine/flat pitch as flat pitch (common terminology in the USA). Same thing – different name

Variable Pitch & Constant Speed Propellers

Diagram 9, Prop Load Curve

Larger aircraft have the range of pitch change operation increased to include reverse thrust. The pitch range around the fine/flat pitch setting through reverse pitch is referred to as the ‘Beta range’. The use of reverse pitch is known as Beta mode, and when selected, the normal operation of the constant speed unit is de-activated and the pilot has direct control over the propeller pitch (via the throttle levers) to control reverse thrust for landing roll braking. This will be covered in greater detail later in the section on Propeller Operation.