Category When Is A Flow Compressible?

Subsonic Compressible Flow

Подпись: Po.i Pi Подпись: 1 + Подпись: -Mi Подпись: y/(y-О Подпись: [8.42]

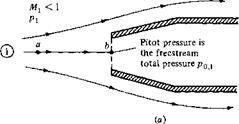
Consider a Pitot tube in a subsonic, compressible flow, as sketched in Figure 8.10a. As usual, the mouth of the Pitot tube (point b) is a stagnation region. Hence, a fluid element moving along streamline ab is brought to rest isentropically at point b. In turn, the pressure sensed at point b is the total pressure of the freestream, p„ i. This is the Pitot pressure read at the end of the tube. If, in addition, we know the freestream static pressure p, then the Mach number in region 1 can be obtained from Equation (8.42),

Подпись: Mi Подпись: 2 Подпись: (y-U/y P 0.1  Pi ) Подпись: [8.74]

or solving for Mf,

Clearly, from Equation (8.74), the Pitot pressure p,,., and the static pressure p, allow the direct calculation of Mach number.

Subsonic Compressible Flow Подпись: 2 a 7^1 Подпись:  (y — l)/y Po,i  Pi / Подпись: [8.75]

The flow velocity can be obtained from Equation (8.74) by recalling that M = u/a. Hence,

From Equation (8.75), we see that, unlike incompressible flow, a knowledge of pop and p is not sufficient to obtain и,; we also need the freestream speed of sound, a.

8.7.8 Supersonic Flow

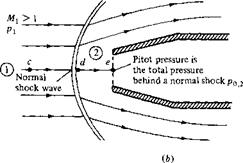
Consider a Pitot tube in a supersonic freestream, as sketched in Figure 8.106. As usual, the mouth of the Pitot tube (point e) is a stagnation region. Hence, a fluid element moving along streamline cde is brought to rest at point e. However, because the freestream is supersonic and the Pitot tube presents an obstruction to the flow,

Subsonic Compressible Flow

Subsonic flow

Subsonic Compressible Flow


Supersonic flow

Subsonic Compressible Flow

Figure 8.10 A Pitot tube in (a) subsonic flow and (b) supersonic flow.


there is a strong bow shock wave in front of the tube, much like the picture shown at the left of Figure 8.1 for supersonic flow over a blunt body. Hence, streamline cde crosses the normal portion of the bow shock. A fluid element moving along streamline cde will first be decelerated nonisentropically to a subsonic velocity at point d just behind the shock. Then it is isentropically compressed to zero velocity at point e. As a result, the pressure at point e is not the total pressure of the freestream but rather the total pressure behind a normal shock wave, po,2- This is the Pitot pressure read at the end of the tube. Keep in mind that because of the entropy increase across the shock, there is a loss in total pressure across the shock, po,2 < Po, і ■ However, knowing po,2 and the freestream static pressure p is still sufficient to calculate the freestream Mach number Mb as follows:

Подпись:P0,2 __ P0,2 Pi Pi Pi Pi

Here, p^ijpi is the ratio of total pressure to static pressure in region 2 immediately behind the normal shock, and рг/Pi is the static pressure ratio across the shock. From

Subsonic Compressible Flow Subsonic Compressible Flow Подпись: 1) Подпись: [8.79]
Subsonic Compressible Flow
Подпись: [8.77]
Подпись: [8.78І

Also, from Equation (8.65),

Подпись: ^2 = / (у + 1 )2M2 K/(K 0 1 -y+2yM2 pi AyM - 2(y - 1)У у + 1

Substituting Equation (8.78) into (8.77), and substituting the result as well as Equa­tion (8.79) into Equation (8.76), we obtain, after some algebraic simplification (see Problem 8.14),

Equation (8.80) is called the Rayleigh Pitot tube formula. It relates the Pitot pressure po,2 and the freestream static pressure p to the freestream Mach number M. Equa­tion (8.80) gives Mx as an implicit function of рол/Pi and allows the calculation of Mx fromaknown рол/Рі – For convenience in making calculations, the ratio Рол/Рі is tabulated versus Mi in Appendix B.

Подпись: Example 8.7A Pitot tube is inserted into an airflow where the static pressure is 1 atm. Calculate the flow Mach number when the Pitot tube measures (a) 1.276 atm, (b) 2.714 atm, (c) 12.06 atm.

Solution

First, we must assess whether the flow is subsonic or supersonic. At Mach 1, the Pitot tube would measure p0 = p/0.528 = 1.893/?. Hence, when p0 < 1.893 atm, the flow is subsonic, and when p0 > 1.893 atm, the flow is supersonic.

(a)

Подпись: M = 0.6

Pitot tube measurement = 1.276 atm. The flow is subsonic. Hence, the Pitot tube is directly sensing the total pressure of the flow. From Appendix A, for р0/p = 1.276,

(b) Pitot tube measurement = 2.714 atm. The flow is supersonic. Hence, the Pitot tube is sensing the total pressure behind a normal shock wave. From Appendix B, for po,2/Pi = 2.714,

Subsonic Compressible Flow

Mi = 1.3


(c)

Подпись: M, = 3.0

Pitot tube measurement = 12.06 atm. The flow is supersonic. From Appendix B, for Ро. г/Рі = 12.06,

Example 8.8 I Consider a hypersonic missile flying at Mach 8 at an altitude of 20,000 ft, where the pressure is 973.3 lb/ft2. The nose of the missle is blunt and is shaped like that shown at the left of Figure 8.1. Calculate the pressure at the stagnation point on the nose.

Solution

Examining the blunt body shown in Figure 8.1, the streamline that impinges at the stagnation point has traversed the normal portion of the bow shock wave. By definition, V = 0 at the stagnation point. Since the flow is isentropic between the shock and the body, the pressure at the stagnation point on the body is the total pressure behind a normal shock with an upstream Mach number of 8. Let us denote the pressure at the stagnation point by ps. Since p0 2 is the total pressure behind the normal shock, then ps = p02. From Appendix B, for Mach 8, Ро. г/Рі = 82.87. Hence,

Подпись:Ps = Po,2 = (Pi) = 82.87(973.3) =

Since 1 atm = 2116 lb/ft2,

Подпись: 38.1 atm_ 8.07 x 10⁴

Ps ~ 2П6 _

Note that the pressure at the nose of the missile is quite high—38.1 atm. This is typical of hypersonic flight at low altitude.

Check on the calculation This problem can also be solved by first calculating the upstream total pressure from Appendix A, and then using the total pressure ratio across the normal shock from Appendix B. From Appendix A for Mach 8, Po, i/Pi = 0.9763 x 10⁻⁴. Hence,

p0,i = (y1) Pt = (0.9763 x 10⁴)973.3 = 9.502 x 10⁶

From Appendix В for Mach 8, р0,г/Po. i = 8.8488 x 10 2. Hence,

Подпись:p, = рог = ( — ) Po і = (0.8488 x 10~z)(9.502 x 10⁶) =

’ Po. i/ ’

This is the same result as obtained earlier.

Supersonic Nozzle Design

In Chapter 10, we demonstrated that a nozzle designed to expand a gas from rest to supersonic speeds must have a convergent-divergent shape. Moreover, the quasi- one-dimensional analysis of Chapter 10 led to the prediction of flow properties as a function of x through a nozzle of specified shape (see, e. g., Figure 10.10). The flow properties at any x station obtained from the quasi-one-dimensional analysis represent an average of the flow over the given nozzle cross section. The beauty of the quasi – one-dimensional approach is its simplicity. On the other hand, its disadvantages are (1) it cannot predict the details of the actual three-dimensional flow in a convergent – divergent nozzle and (2) it gives no information on the proper wall contour of such nozzles.

The purpose of the present section is to describe how the method of characteristics can supply the above information which is missing from a quasi-one-dimensional analysis. For simplicity, we treat a two-dimensional flow, as sketched in Figure 13.7. Here, the flow properties are a function of x and y. Such a two-dimensional flow is applicable to supersonic nozzles of rectangular cross section, such as sketched in the insert at the top of Figure 13.7. Two-dimensional (rectangular) nozzles are used in many supersonic wind tunnels. They are also the heart of gas-dynamic lasers (see Reference 1). In addition, there is current discussion of employing rectangular exhaust nozzles on advanced military jet airplanes envisaged for the future.

Consider the following problem. We wish to design a convergent-divergent nozzle to expand a gas from rest to a given supersonic Mach number at the exit Me. How do we design the proper contour so that we have shock-free, isentropic flow in the nozzle? The answer to this question is discussed in the remainder of this section.

For the convergent, subsonic section, there is no specific contour which is better than any other. There are rules of thumb based on experience and guided by subsonic flow theory; however, we are not concerned with the details here. We simply assume that we have a reasonable contour for the subsonic section.

Due to the two-dimensional nature of the flow in the throat region, the sonic line is generally curved, as sketched in Figure 13.7. A line called the limiting characteristic is sketched just downstream of the sonic line. The limiting characteristic is defined such that any characteristic line originating downstream of the limiting characteristic does not intersect the sonic line; in contrast, a characteristic line originating in the small region between the sonic line and the limiting characteristic can intersect the sonic line (for more details on the limiting characteristic, see Reference 21). To begin a method of characteristics solution, we must use an initial data line which is downstream of the limiting characteristic.

Let us assume that by independent calculation of the subsonic-transonic flow in the throat region, we know the flow properties at all points on the limiting character­istic. That is, we use the limiting characteristic as our initial data line. For example, we know the flow properties at points 1 and 2 on the limiting characteristic in Figure 13.7. Moreover, consider the nozzle contour just downstream of the throat. Letting в denote the angle between a tangent to the wall and the horizontal, the section of the divergent nozzle where в is increasing is called the expansion section, as shown in Figure 13.7. The end of the expansion section occurs where в — втм (point 8 in Figure 13.7). Downstream of this point, в decreases until it equals zero at the nozzle exit. The portion of the contour where в decreases is called the straightening section. The shape of the expansion section is somewhat arbitrary; typically, a circular arc of large radius is used for the expansion section of many wind-tunnel nozzles. Conse­quently, in addition to knowing the flow properties along the limiting characteristic, we also have an expansion section of specified shape; that is, we know 6, 65, and (9X in Figure 13.7. The purpose of our application of the method of characteristics now becomes the proper design of the contour of the straightening section (from points 8 to 13 in Figure 13.7).

The characteristics mesh sketched in Figure 13.7 is very coarse—this is done intentionally to keep our discussion simple. In an actual calculation, the mesh should be much finer. The characteristics mesh and the flow properties at the associated grid points are calculated as follows:

1. Draw a C_ characteristic from point 2, intersecting the centerline at point 3.

Evaluating Equation (13.17) at point 3, we have

$3 + U3 = (А"_)з

In the above equation, 03 = 0 (the flow is horizontal along the centerline). Also,

(А"_)з is known because (A"_)3 = (K – )3. Hence, the above equation can be

solved for v3.

2. Point 4 is located by the intersection of the C_ characteristic from point 1 and the C+ characteristic from point 3. In turn, the flow properties at the internal point 4 are determined as discussed in the last part of Section 13.2.

3. Point 5 is located by the intersection of the C+ characteristic from point 4 with the wall. Since 05 is known, the flow properties at point 5 are determined as discussed in Section 13.2 for wall points.

4. Points 6 through 11 are located in a manner similar to the above, and the flow properties at these points are determined as discussed before, using the internal point or wall point method as appropriate.

5. Point 12 is a wall point on the straightening section of the contour. The purpose of the straightening section is to cancel the expansion waves generated by the expansion section. Hence, there are no waves which are reflected from the straightening section. In turn, no right-running waves cross the characteristic line between points 9 and 12. Asa result, the characteristic line between points 9 and 12 is a straight line, along which в is constant, that is, 612 = O9. The section of the wall contour between points 8 and 12 is approximated by a straight line with an average slope of ^(в% + 612).

6. Along the centerline, the Mach number continuously increases. Let us assume that at point 11, the design exit Mach number Me is reached. The characteristic line from points 11 to 13 is the last line of the calculation. Again, вц = 9ц, and the contour from point 12 to point 13 is approximated by a straight-line segment with an average slope of 5(^12 + віз).

The above description is intended to give you a “feel” for the application of the method of characteristics. If you wish to carry out an actual nozzle design, and/or if you are interested in more details, read the more complete treatments in References 21 and 34.

Note in Figure 13.7 that the nozzle flow is symmetrical about the centerline. Hence, the points below the centerline (T, 2′, 3′, etc.) are simply mirror images of the corresponding points above the centerline. In making a calculation of the flow through the nozzle, we need to concern ourselves only with those points in the upper half of Figure 13.7, above and on the centerline.

Some Analytical Considerations

For air temperatures up to 1000 K, the specific heats are essentially constant, thus justifying the assumption of a calorically perfect gas for this range. Moreover, the

temperature variations of /і and к over this range are virtually identical. As a result, the Prandtl number, ficp/ k, is essentially constant up to temperatures on the order of 1000 K. This is shown in Figure 16.11, obtained from Schetz (Reference 53). Note that Pr ~ 0.71 for air; this is the value that was used in Example 16.1.

Question: How high a Mach number can exist before we would expect to en­counter temperatures in the flow above 1000 K? Answer: An approximate answer is to calculate that Mach number at which the total temperature is 1000 K. Assuming a static temperature T = 288 K, from Equation (8.40),

Hence, for most aeronautical applications involving flight at a Mach number of 3.5 or less, the temperature within the viscous portions of the flow field will not exceed 1000 K. A Mach number of 3.5 or less encompasses virtually all operational aircraft today, with the exception of a few hypersonic test vehicles.

In light of the above, many viscous flow solutions are carried out making the justi­fiable assumption of a constant Prandtl number. For the case of compressible Couette flow, the assumption of Pr = constant allows the following analysis. Consider the energy equation, Equation (16.3), repeated below:

Inserting b and c into Equation (16.79) and simplifying, we obtain

и2 и Pr

h – b Pr — =hw—– (he – hw) + —(uue)

2 ue 2

Assume the lower wall is adiabatic; that is, (Bh/Sy)w = 0. Differentiating Equa­tion (16.80) with respect to y, we have

Recall that the condition for an adiabatic wall is that (dh/dy)w = 0. Applying Equation (16.81) at у = 0 for an adiabatic wall, where и = 0 and by definition hw = haw, we have

Since (du/dy)w is finite, then

This is identical to Equation (16.39) obtained for incompressible flow. Hence, we have just proven that the recovery factor for compressible Couette flow, assuming constant Prandtl number, is also

[16.83]

Since the recovery factors for the incompressible and compressible cases are the same (as long as Pr = constant), what can we say about Reynolds analogy? Does Equation (16.59) hold for the compressible case? Let us examine this question. Return to Equation (16.3), repeated below:

Recalling that, from the definitions,

then Equation (16.3) can be written as

Integrating Equation (16.86) with respect to y, we have

where a is a constant of integration. Evaluating Equation (16.87) at у = 0, where и = 0 and q = qw, we find that

Hence, Equation (16.87) is

q + xu = qw

Inserting Equations (16.84) and (16.85) into (16.88), we have

. dT du 4w=k~ + їли — dy dy

[16.89]

or

qw к dT du x x dy dy

[16.90]

Recall that the shear stress

is constant throughout the flow; hence,

du

r = ~ r>"

dy

or

?W

a — ——–

du/dy

[16.91]

Also,

к _ Cp

fl Pr

[16.92]

Inserting Equation (16.91) into the left-hand side of Equation (16.90), and Equa­tion (16.92) into the right-hand side of Equation (16.90), we have

qw du cp dT d{u2/2)

rw dy Pr 3у dy

Integrate Equation (16.93) between the two plates, keeping in mind that qw, ru

and Pr are all fixed values:

or which yields

CtLUe^%Te~Tw)+1^ Tw Pr 2

Rearranging Equation (16.94), and recalling that h = cpT, we have

Equation (16.98) is Reynolds analogy—a relation between heat transfer and skin friction coefficients. Moreover, it is precisely the same result as obtained in Equa­tion (16.59) for incompressible flow. Hence, for a constant Prandtl number, we have shown that Reynolds analogy is precisely the same form for incompressible and com­pressible flow.

Consider the geometry given in Figure 16.2. The two plates are separated by a distance of 0.01 in (the same as in Example 16.1). The temperature of the two plates is equal, at a value of 288 К (standard sea level temperature). The air pressure is constant throughout the flow and equal to 1 atm. The upper plate is moving at Mach 3. The shear stress at the lower wall is 72 N/m2. (This is about 1.5 lb/ft2—a much larger value than that associated with the low-speed case treated in Example 16.1.) Calculate the heat transfer to either plate. (Since the shear stress is constant throughout the flow, and the plates are at equal temperature, the heat transfer to the upper and lower plates is the same.)

Solution

The velocity of the upper plate is

ue = Meae = Mey/yRTe = 3v7(1 -4)(288)(287) = 1020 m/s The air density at both plates is (noting that 1 atm =1.01 x 10⁵ N/m2)

1.22 kg/m3

Hence, the skin friction coefficient is

(1020)2 ,

haw = (1004.5)(288) + (0.71)- – – – = 6.59 x 10⁵ J/kg

[Note: This gives Taw = huw/cp = (6.59 x 10⁵)/1004.5 = 656 K. In the adiabatic case, the wall would be quite warm.] Hence, from the definition of the Stanton number [Equa­tion (16.55)], and noting that hw = cpT„, = (1004.6)(288) = 2.89 x 10⁵ J/kg,

qw = peue(hau,-hw)CH = ( 1.22)(1020)[(6.59- 2.89) x 105](8 x КГ5)

Diffusers

The role of a diffuser was first introduced in Section 3.3 in the context of a low-speed subsonic wind tunnel. There, a diffuser was a divergent duct downstream of the test section whose role was to slow the higher-velocity air from the test section down to a very low velocity at the diffuser exit (see Figure 3.8). Indeed, in general, we can define a diffuser as any duct designed to slow an incoming gas flow to lower velocity at the exit of the diffuser. The incoming flow can be subsonic, as discussed in Figure

3.8, or it can be supersonic, as discussed in the present section. However, the shape of the diffuser is drastically different, depending on whether the incoming flow is subsonic or supersonic.

Before pursuing this matter further, let us elaborate on the concept of total pres­sure p0 as discussed in Section 7.5. In a semiqualitative sense, the total pressure of a flowing gas is a measure of the capacity of the flow to perform useful work. Let us consider two examples:

1. A pressure vessel containing stagnant air at 10 atm

2. A supersonic flow at M = 2.16 and p = 1 atm

In case 1, the air velocity is zero; hence, p0 = p = 10 atm. Now, imagine that we want to use air to drive a piston in a piston-cylinder arrangement, where useful work is performed by the piston being displaced through a distance. The air is ducted into the cylinder from a large manifold, in the same vein as the reciprocating internal combustion engine in our automobile. In case, 1, the pressure vessel can act as the manifold; hence, the pressure on the piston is 10 atm, and a certain amount of useful work is performed, say, Wi. However, in case 2, the supersonic flow must be slowed to a low velocity before we can readily feed it into the manifold. If this slowing process can be achieved without loss of total pressure, then the pressure in the manifold in this case is also 10 atm (assuming V ~ 0), and the same amount of useful work Wi is performed. On the other hand, assume that in slowing down the supersonic stream, a loss of 3 atm takes place in the total pressure. Then the pressure in the manifold is only 7 atm, with the consequent generation of useful work №2, which is less than in the first case; that is, ИА < W. The purpose of this simple example is to indicate that the total pressure of a flowing gas is indeed a measure of its capability to perform useful work. On this basis, a loss of total pressure is always an inefficiency—a loss of the capability to do a certain amount of useful work.

In light of the above, let us expand our definition of a diffuser. A diffuser is a duct designed to slow an incoming gas flow to lower velocity at the exit of the diffuser with as small a loss in total pressure as possible. Consequently, an ideal diffuser would be characterized by an isentropic compression to lower velocities; this is sketched in Figure 10.15a, where a supersonic flow enters the diffuser at M, is isentropically

j2> J,

compressed in a convergent duct to Mach 1 at the throat, where the area is A*, and then is further isentropically compressed in a divergent duct to a low subsonic Mach number at the exit. Because the flow is isentropic, s2 = si, and from Equation (8.73), pQ 2 = pop – Indeed, po is constant throughout the entire diffuser—a characteristic of isentropic flow. However, common sense should tell you that the ideal diffuser in Figure 10.15a can never be achieved. It is extremely difficult to slow a supersonic flow without generating shock waves in the process. For example, examine the convergent portion of the diffuser in Figure 10.15a. Note that the supersonic flow is turned into itself; hence, the converging flow will inherently generate oblique shock waves, which will destroy the isentropic nature of the flow. Moreover, in real life, the flow is viscous; there will be an entropy increase within the boundary layers on the walls of the diffuser. For these reasons, an ideal isentropic diffuser can never be constructed; an ideal diffuser is of the nature of a “perpetual motion machine”—only a utopian wish in the minds of engineers.

An actual supersonic diffuser is sketched in Figure 10.15/7. Here, the incoming flow is slowed by a series of reflected oblique shocks, first in a convergent section usually consisting of straight walls, and then in a constant-area throat. Due to the interaction of the shock waves with the viscous flow near the wall, the reflected shock pattern eventually weakens and becomes quite diffuse, sometimes ending in a weak normal shock wave at the end of the constant-area throat. Finally, the subsonic flow downstream of the constant-area throat is further slowed by moving through a divergent section. At the exit, clearly s2 hence pop < Pop – The art of diffuser design is to obtain as small a total pressure loss as possible, that is, to design the

convergent, divergent, and constant-area throat sections so that ро. г/Рол is as close to unity as possible. Unfortunately, in most cases, we fall far short of that goal. For more details on supersonic diffusers, see Chapter 5 of Reference 21 and Chapter 12 of Reference 1.

Please note that due to the entropy increase across the shock waves and in the boundary layers, the real diffuser throat area A, is larger than,4*. that is, in Figure 10.15, A, > AU

Mach Number Independence

Examine again the hypersonic shock-wave relation for pressure ratio as given by Equation (14.29); note that, as the freestream Mach number approaches infinity, the pressure ratio itself also becomes infinitely large. On the other hand, the pressure coefficient behind the shock, given in the hypersonic limit by Equation (14.39), is a constant value at high values of the Mach number. This hints strongly of a situation where certain aspects of a hypersonic flow do not depend on Mach number, as long as the Mach number is sufficiently high. This is a type of “independence” from the Mach number, formally called the hypersonic Mach number independence principle. From the above argument, Cp clearly demonstrates Mach number independence. In turn, recall that the lift- and wave-drag coefficients for a body shape are obtained by integrating the local Cp, as shown by Equations (1.15), (1.16), (1.18), and (1.19). These equations demonstrate that, since Cp is independent of the Mach number at high values of Mx, the lift and drag coefficients are also Mach number independent. Keep in mind that these conclusions are theoretical, based on the limiting form of the hypersonic shock relations.

Let us examine an example that clearly illustrates the Mach number independence principle. In Figure 14.13, the pressure coefficients for a 15° half-angle wedge and a 15° half-angle cone are plotted versus freestream Mach number for у = 1.4. The exact wedge results are obtained from Equation (14.38), and the exact cone results are obtained from the solution of the classical Taylor-Maccoll equation. (See Reference 21 for a detailed discussion of the solution of the supersonic flow over a cone. There, you will find that the governing continuity, momentum, and energy equations for a conical flow cascade into a single differential equation called the

Taylor-Maccoll equation. In turn, this equation allows the exact solution of this conical flow field.) Both sets of results are compared with newtonian theory, Cp = 2 sin2 0, shown as the dashed line in Figure 14.13. This comparison demonstrates two general aspects of newtonian results:

1. The accuracy of the newtonian results improves as Мж increases. This is to be expected from our discussion in Section 14.5. Note from Figure 14.13 that below Moo = 5 the newtonian results are not even close, but the comparison becomes much closer as M^ increases above 5.

2. Newtonian theory is usually more accurate for three-dimensional bodies (e. g., the cone) than for two-dimensional bodies (e. g., the wedge). This is clearly evident in Figure 14.13 where the newtonian result is much closer to the cone results than to the wedge results.

However, more to the point of Mach number independence, Figure 14.13 also shows the following trends. For both the wedge and the cone, the exact results show that, at low supersonic Mach numbers, Cp decreases rapidly as Мж is increased. However, at hypersonic speeds, the rate of decrease diminishes considerably, and Cp appears to reach a plateau as M<*, becomes large; that is, Cp becomes relatively independent of Moo at high values of the Mach number. This is the essence of the Mach number independence principle; at high Mach numbers, certain aerodynamic quantities such as pressure coefficient, lift – and wave-drag coefficients, and flow-field structure (such as shock-wave shapes and Mach wave patterns) become essentially independent of the Mach number. Indeed, newtonian theory gives results that are totally independent of the Mach number, as clearly demonstrated by Equation (14.4).

Another example of Mach number independence is shown in Figure 14.14. Here, the measured drag coefficients for spheres and for a large-angle cone cylinder are plot­ted versus the Mach number, cutting across the subsonic, supersonic, and hypersonic regimes. Note the large drag rise in the subsonic regime associated with the drag – divergence phenomenon near Mach 1 and the decrease in Сд in the supersonic regime beyond Mach 1. Both of these variations are expected and well understood. For our purposes in the present section, note, in particular, the variation of Co in the hyper­sonic regime; for both the sphere and cone cylinder, CD approaches a plateau and becomes relatively independent of the Mach number as M^ becomes large. Note also that the sphere data appear to achieve “Mach number independence” at lower Mach numbers than the cone cylinder.

Keep in mind from the above analysis that it is the nondimensional variables that become Mach number independent. Some of the dimensional variables, such as p, are not Mach number independent; indeed, p —>• oc and Mcc —»• oo.

Finally, the Mach number independence principle is well grounded mathemati­cally. The governing inviscid flow equations (the Euler equations) expressed in terms of suitable nondimensional quantities, along with the boundary conditions for the limiting hypersonic case, do not have the Mach number appearing in them—hence, by definition, the solution to these equations is independent of the Mach number. See References 21 and 55 for more details.

Figure 14.14 Drag coefficient for a sphere and a cone

cylinder from ballistic range measurements; an example of Mach number independence at hypersonic speeds. (Source: Cox and Crabtree, Reference 61 .j

The Reference Temperature Method

In this section we discuss an approximate engineering method for predicting skin friction and heat transfer for laminar compressible flow. It is based on the simple idea of utilizing the formulas obtained from incompressible flow theory, wherein the ther­modynamic and transport properties in these formulas are evaluated at some reference temperature indicative of the temperature somewhere inside the boundary layer. This idea was first advanced by Rubesin and Johnson in Reference 80 and was modified by Eckert (Reference 81) to include a reference enthalpy. In this fashion, in some sense the classical incompressible formulas were “corrected” for compressibility effects. Reference temperature (or reference enthalpy) methods have enjoyed frequent appli­cation in engineering-oriented analyses, because of their simplicity. For this reason, we briefly describe the approach here.

Consider the incompressible laminar flow over a flat plate, as discussed in Section

18.2. The local skin friction coefficient is given by Equation (18.20), repeated below:

_ 0.664

Cf ~

For the compressible laminar flow over a flat plate, we write the analogous expression

Evaluating Equation (18.54) at the reference temperature, we have

£-** ______ ^ w______

p* u*(haw hw)

Example 1 8.2 | Use the reference temperature method to calculate the friction drag on the same flat plate at the same flow conditions as described in Example 8.1b. Compare the reference temperature results with that obtained in Example 8.1b, which reflected the “exact” laminar boundary layer theory.

Solution

The reference temperature is calculated from Equation (18.53), where we need the ratio Tm/Te. For the present case, the flat plate is at the adiabatic wall temperature, hence we need the ratio Taw/Te. To obtain this, we use the recovery factor, which for a flat plate laminar boundary layer is given by Equation (18.47):

Also, the value of д* that corresponds to T* is obtained from Sutherland’s law, given by Equation (15.3)

_Д _ /rV,/2 T0 + 110 M о UJ T + 110

Recall: In Equation (15.3), до is the reference viscosity coefficient at the reference temperature T0. In Equation (15.3) T0 denotes the reference temperature, not the total temperature. Here we have a case of the same notation for two different quantities, but the meaning of T0 in Equation (15.3) is clear from its context. We will use the standard sea level conditions for the values of T0 and д0, that is,

до = 1-7894 x КГ5 kg/(m)(s) and T0 = 288 К

Hence, from Equation (15.3)

д* /Г*у1/2 T0+ 110 /612.7Л3/2 288 + 110

/У VW T* + 110 ~ V 288 / 612.7 + 110

or

д* = 1.709ДО = (1.709)(1.7894 x КГ5) = 3.058 x КГ5 kg/(m)(s)

From Equation (18.52) integrated over the entire chord of the plate, we have the same form as Equation (18.22), namely,

_ K328

7 У*?

Hence, the friction drag on one side of the plate is

Df = p*VfSC*f = 5(0.574)(1000)2(40)(2.167 x 10“4) = 2844 N

The total friction drag taking into account both the top and bottom surfaces of the plate is

D = 2(2488) =

The result obtained from classical compressible boundary layer theory in Example 18.1b is D = 5026 N. The result from the reference temperature method used here is within one percent of the “exact” value found in Example 18.1b, a stunning example of the accuracy of the reference temperature method, at least for the case treated here.

CFD Applications: Transonic Airfoils and Wings

The analysis of subsonic compressible flow over airfoils discussed in this chapter, re­sulting in classic compressibility corrections such as the Prandtl-Glauert mle (Section 11.4), fits into the category of “closed-form” theory as discussed in Section 2.17.1. Although this theory is elegant and useful, it is restricted to:

1. Thin airfoils at small angles of attack

2. Subsonic numbers that do not approach too close to one, that is, Mach numbers typically below 0.7

3. Inviscid, irrotational flow

However, modern subsonic transports (Boeing 747, 111, etc.) cruise at freestream Mach numbers on the order of 0.85, and high-performance military combat airplanes spend time at high subsonic speeds near Mach one. These airplanes are in the transonic flight regime, as discussed in Section 1.10.4 and noted in Figure 1.37. The closed – form theory discussed in this chapter does not apply in this flight regime. The only approach that allows the accurate calculation of airfoil and wing characteristics at transonic speeds is to use computational fluid dynamics; the basic philosophy of CFD is discussed in Section 2.17.2, which should be reviewed before you progress further.

The need to calculate accurately the transonic flow over airfoils and wings was one of the two areas that drove advances in CFD in the early days of its development, the other area being hypersonic flow. The growing importance of high-speed jet civil transports during the 1960s and 1970s made the accurate calculation of transonic flow imperative, and CFD was (and still is) the only way of making such calculations. In this section we will give only the flavor of such calculations; see Chapter 14 of Reference 21 for more details, as well as the modern aerodynamic literature for the latest developments.

Beginning in the 1960s, transonic CFD calculations historically evolved through four distinct steps, as follows:

1. The earliest calculations numerically solved the nonlinear small-perturbation potential equation for transonic flow, obtained from Equation (11.6) by dropping all terms on the right-hand side except for the leading term, which is not small near M„о = 1. This yields

8u 8v

(l – Ml;)— + ~ = Ml
^ 8x 8v

which in terms of the perturbation velocity potential is

Equation (11.69) is the transonic small perturbation potential equation; it is non­linear due to the term on the right-hand side, which involves a product of deriva­tives of the dependent variable <j>. This necessitated a numerical CFD solution. However, the results were limited to the assumptions embodied in this equation, namely, small perturbations and hence thin airfoils at small angles of attack.

2. The next step was numerical solutions of the full potential equation, Equation

(11.12) . This allowed applications to airfoils of any shape at any angle of attack. However, the flow was still assumed to be isentropic, and even though shock waves appeared in the results, the properties of these shocks were not always accurately predicted.

3. As CFD algorithms became more sophisticated, numerical solutions of the Eu­ler equations (the full continuity, momentum, and energy equations for inviscid flow, such as Equations (7.40), (7.42), and (7.44)) were obtained. The advantage of these Euler solutions was that shock waves were properly treated. However,

none of the approaches discussed in steps 1-3 accounted for the effects of viscous flow, the importance of which in transonic flows soon became more appreciated because of the interaction of the shock wave with the boundary layer. This inter­action, with the attendant flow separation is dominant in the prediction of drag.

4. This led to the CFD solution of the viscous flow equations (the Navier-Stokes equations, such as Equations (2.43), (2.61), and (2.87) with the viscous terms in­cluded) for transonic flow. The Navier-Stokes equations are developed in detail in Chapter 15. Such CFD solutions of the Navier-Stokes equations are currently the state of the art in transonic flow calculations. These solutions contain all of the realistic physics of such flows, with the exception that some type of turbu­lence model must be included to deal with turbulent boundary layers, and such turbulent models are frequently the Archilles heel of these calculations.

An example of a CFD calculation for the transonic flow over an NACA 0012 airfoil at 2° angle of attack with = 0.8 is shown in Figure 11.21. The contour lines shown here are lines of constant Mach number, and the bunching of these lines together clearly shows the nearly normal shock wave occurring on the top surface. In reference to our calculation in Example 11.3 showing that the critical Mach number for the NACA 0012 airfoil at zero angle of attack is 0.74, and the experimental confirmation of this shown in Figure 11.1 Ofo, clearly the flow over the same airfoil shown in Figure 11.21 is well beyond the critical Mach number. Indeed, the boundary layer downstream of the shock wave in Figure 11.21 is separated, and the airfoil is squarely in the drag-divergence region. The CFD calculations predict this separated flow because a version of the Navier-Stokes equations (called the thin shear layer approximation) is being numerically solved, taking into account the viscous flow effects. The results shown in Figure 11.21 are from the work of Nakahashi and Deiwert at the NASA Ames Research Center (Reference 74); these results are a graphic illustration of the power of CFD applied to transonic flow. For details on these types of CFD calculations, see the definitive books by Hirsch (Reference 75).

Today, CFD is an integral part of modem transonic airfoil and wing design. A recent example of how CFD is combined with modem optimization design techniques for the design of complete wings for transonic aircraft is shown in Figures 11.22 and 11.23, taken from the survey paper by Jameson (Reference 76). On the left side of Figure 11.22a the airfoil shape distribution along the semispan of a baseline, initial wing shape at Мх = 0.83 is given, with the computed pressure coefficient distributions shown at the right. The abrupt drop in Cp in these distributions is due to a relatively strong shock wave along the wing. After repeated iterations, the optimized design at the same = 0.83 is shown in Figure 11.22b. Again, the new airfoil shape distribution is shown on the left, and the Cp distribution is given on the right. The new, optimized wing design shown in Figure 11.22b is virtually shock free, as indicated by the smooth Cp distributions, with a consequent reduction in drag of 7.6 percent. The optimization shown in Figure 11.22 was subject to the constraint of keeping the wing thickness the same. Another but similar case of wing design optimization is shown in Figure 11.23. Flere, the final optimized wing planform shape is shown for Mqq = 0.86, with the final computed pressure contour lines shown on

Figure 1 1.21 Mach number contours in the transonic flow over an NACA 001 2 airfoil at Mtx; = 0.8 and at 2° angle of attack. (Source: Nakahasi and Deiwert, Reference 74.1

the planform. Straddling the wing planform on both the left and right of Figure 11.23 are the pressure coefficient plots at six spanwise stations. The dashed curves show the Cp variations for the initial baseline wing, with the tell-tale oscillations indicating a shock wave, whereas the solid curves are the final Cp variations for the optimized wing, showing smoother variations that are almost shock-free. At the time of writing, the results shown in Figures 11.22 and 11.23 are reflective of the best combination of multidisciplinary design optimization using CFD for transonic wings. For more details on this and other design applications, see the special issue of the Journal of Aircraft, vol. 36, no. 1, Jan./Feb. 1999, devoted to aspects of multidisciplinary design optimization.

(b)

Figure I 1.22 The use of CFD for optimized transonic wing design. Moo = 0.83. (a) Baseline wing with a shock wave, (b) Optimized wing, virtually shock free. Source: Jameson, Reference 76.

Incompressible (Constant Property) Couette Flow

In the study of viscous flows, a flow field in which p, p, and к are treated as constants is sometimes labeled as “constant property” flow. This assumption is made in the present section. On a physical basis, this means that we are dealing with an incompressible flow, where p is constant. Also, since /і and к are functions of temperature (see Section 15.3), constant property flow implies that T is constant also. (We will relax this assumption slightly at the end of this section.)

The governing equations for Couette flow were derived in Section 16.2. In partic­ular, the у-momentum equation, Equation (16.2), along with the geometrical property that Hp/Hx = 0, states that the pressure is constant throughout the flow. Consequently, all the information about the velocity field comes from the x-momentum equation, Equation (16.1), repeated below:

[16.1]

For constant д, this becomes

[16.4]

Integrating with respect to у twice, we obtain

и = ay + b

where a and b are constants of integration. These constant can be obtained from the boundary conditions illustrated in Figure 16.2, as follows:

At у = 0, и = 0; hence, b — 0.

At у = D, и = ue; hence, a = ue/D.

Thus, the variation of velocity for incompressible Couette flow is given by Equa­tion (16.5) as

[16.6]

Note the important result that the velocity varies linearly across the flow. This result is sketched in Figure 16.3.

Once the velocity profile is obtained, we can obtain the shear stress at any point in the flow from Equation (15.1), repeated below (the subscript yx is dropped here because we know the only shear stress acting in this problem is that in the x direction):

[16.7]

From Equation (16.6),

3 и ue

з7 ~ z>

Hence, from Equations (16.7) and (16.8), we have

[16.9]

Note that the shear stress is constant throughout the flow. Moreover, the straight­forward result given by Equation (16.9) illustrates two important physical trends— trends that we will find to be almost universally present in all viscous flows:

1. As ue increases, the shear stress increases. From Equation (16.9), r increases linearly with ue this is a specific result germane to Couette flow. For other problems, the increase is not necessarily linear.

2. As D increases, the shear stress decreases; that is, as the thickness of the viscous shear layer increases, all other things being equal, the shear stress becomes smaller. From Equation (16.9), r is inversely proportional to D—again a result germane to Couette flow. For other problems, the decrease in r is not necessarily in direct inverse proportion to the shear-layer thickness.

With the above results in mind, reflect for a moment on the quotation from Isaac Newton’s Principia given at the beginning of this chapter. Here, the “want of lubric­ity” is, in modem terms, interpreted as the shear stress. This want of lubricity is, according to Newton, “proportional to the velocity with which the parts of the fluid are separated from one another,” that is, in the context of the present problem propor­tional to ue/D. This is precisely the statement contained in Equation (16.9). In more recent times, Newton’s statement is generalized to the form given by Equation (16.7), and even more generalized by Equation (15.1). For this reason, Equations (15.1) and

(16.7) are frequently called the newtonian shear stress law, and fluids which obey this law are called newtonian fluids. [There are some specialized fluids which do not obey Equation (15.1) or (16.7); they are called non-newtonian fluids—some polymers and blood are two such examples.] By far, the vast majority of aeronautical appli­cations deal with air or other gases, which are newtonian fluids. In hydrodynamics, water is the primary medium, and it is a newtonian fluid. Therefore, we will deal exclusively with newtonian fluids in this book. Consequently, the quote given at the beginning of this chapter is one of Newton’s most important contributions to fluid mechanics—it represents the first time in history where shear stress is recognized as being proportional to a velocity gradient.

Let us now turn our attention to heat transfer in a Couette flow. Here, we continue our assumptions of constant p, p. and k. but at the same time, we will allow a temperature gradient to exist in the flow. In an exact sense, this is inconsistent; if T varies throughout the flow, then p, p, and к also vary. However, for this application, we assume that the temperature variations are small—indeed, small enough such that p, p, and к are approximately constant—and treat them so in the equations. On the other hand, the temperature changes, although small on an absolute basis, are sufficient to result in meaningful heat flux through the fluid. The results obtained will reflect some of the important trends in aerodynamic heating associated with high-speed flows, to be discussed in subsequent chapters.

For Couette flow with heat transfer, return to Figure 16.2. Here, the temperature of the upper plate is Te and that of the lower plate is Tw. Hence, we have as boundary conditions for the temperature of the fluid:

At у = 0: At у = D:

The temperature profile in the flow is governed by the energy equation, Equation

(16.3) . For constant p and k, this equation is written as

[16.10]

Also, since p is assumed to be constant, Equations (16.10) and (16.1) are totally uncoupled. That is, for the constant property flow considered here, the solution of the momentum equation [Equation (16.1)] is totally separate from the solution of the energy equation [Equation (16.10)]. Therefore, in this problem, although the temperature is allowed to vary, the velocity field is still given by Equation (16.6), as sketched in Figure 16.3.

In dealing with flows where energy concepts are important, the enthalpy h is fre­quently a more fundamental variable than temperature; we have seen much evidence of this in Part 3, where energy changes were a vital consideration. In the present problem, where the temperature changes are small enough to justify the assumptions of constant p, p, and k, this is not quite the same situation. However, because we will need to solve Equation (16.10), which is an energy equation for a flow (no matter how small the energy changes), and because we are using Couette flow as an example to set the stage for more complex problems, it is instructional (but by no means necessary) to couch Equation (16.10) in terms of enthalpy. Assuming constant specific heat, we have

[16.11]

Equation (16.11) is valid for the Couette flow of any fluid with constant heat capacity; here, the germane specific heat is that at constant pressure cp because the entire flow field is at constant pressure. In this sense, Equation (16.11) is a result of applying the first law of thermodynamics to a constant pressure process and recalling the funda­mental definition of heat capacity as the heat added per unit change in temperature, Sq/dT. Of course, if the fluid is a calorically perfect gas, then Equation (16.11) is

a basic thermodynamic property of such a gas quite independent of what the pro­cess may

Note that h varies parabolically with y/D across the flow. Since T = h/cp, then the temperature profile across the flow is also parabolic. The precise shape of the parabolic curve depends on hw (or Tw), he (or Te), and Pr. Also note that, as expected from our discussion of the viscous flow similarity parameters in Section 15.6, the

Prandtl number is clearly a strong player in the results; Equation (16.16) is one such example.

Once the enthalpy (or temperature) profile is obtained, we can obtain the heat flux at any point in the flow from Equation (15.2), repeated below (the subscript у is dropped here because we know the only direction of heat transfer is in the у direction for this problem):

д T

q = – k — [16.17]

dy

Equation (16.17) can be written as

k dh r,

g =——— [16.18]

cP dy

In Equation (16.18), the enthalpy gradient is obtained by differentiating Equation (16.16) as follows:

Inserting Equation (16.19) into Equation (16.18), and writing k/cp as /і/ Pr, we have

From Equation (16.20), note that q is not constant across the flow, unlike the shear stress discussed earlier. Rather, q varies linearly with y. The physical reason for the variation of q is viscous dissipation which takes place within the flow, and which is associated with the shear stress in the flow. Indeed, the last term in Equation (16.20), in light of Equations (16.6) and (16.9), can be written as

= ти

Hence, Equation (16.20) becomes

The variation of q across the flow is due to the last term in Equation (16.21), and this term involves shear stress multiplied by velocity. The term ти is viscous dissipation; it is the time rate of heat generated at a point in the flow by one streamline at a given velocity “rubbing” against an adjacent streamline at a slightly different velocity— analogous to the heat you feel when rubbing your hands together vigorously. Note that, if ue is negligibly small, then the viscous dissipation is small and can be ne­glected; that is, in Equation (16.20) the last term can be neglected (ue is small), and in Equation (16.21) the last term can be neglected (r is small if ue is small). In this case, the heat flux becomes constant across the flow, simply equal to

In this case, the “driving potential” for heat transfer across the flow is simply the enthalpy difference (he — h „ ) or, in other words, the temperature difference (Te — 7 „) across the flow. However, as we have emphasized, if ue is not negligible, then viscous dissipation becomes another factor that drives the heat transfer across the flow.

Of particular practical interest is the heat flux at the walls—the aerodynamic heating as we label it here. We denote the heat transfer at a wall as qw. Moreover, it is conventional to quote aerodynamic heating at a wall without any sign convention. For example, if the heat transfer from the fluid to the wall is 10 W/cm2, or, if in reverse the heat transfer from the wall to the fluid is 10 W/cm2, it is simply quoted as such; in both cases, qw is given as 10 W/cm2 without any sign convention. In this sense, we write Equation (16.18) as

к

dh

3h

qw = —

Cp

9y

By

where the subscript w implies conditions at the wall. The direction of the net heat transfer at the wall, whether it is from the fluid to the wall or from the wall to the fluid, is easily seen from the temperature gradient at the wall; if the wall is cooler than the adjacent fluid, heat is transferred into the wall, and if the wall is hotter than the adjacent fluid, heat is transferred into the fluid. Another criterion is to compare the wall temperature with the adiabatic wall temperature, to be defined shortly.

Return to the picture of Couette flow in Figure 16.2. To calculate the heat transfer at the lower wall, use Equation (16.23) with the enthalpy gradient given by Equation (16.19) evaluated at у = 0:

To calculate the heat transfer at the upper wall, use Equation (16.23) with the enthalpy gradient given by Equation (16.19) evaluated at у = D. In this case, Equation (16.19) yields

dh he – hw + Pr и2 Pr u] _ he – hw – Pr и2 By D D D

In turn, from Equation (16.23)

Let us examine the above results for three different scenarios, namely, (1) negligi­ble viscous dissipation, (2) equal wall temperature, and (3) adiabatic wall conditions (no heat transfer to the wall). In the process, we define three important concepts in the analysis of aerodynamic heating: (1) adiabatic wall temperatue, (2) recovery factor, and (3) Reynolds analogy.

Flow over an Airfoil

The viscous compressible flow over an airfoil was studied in Reference 56. For the treatment of this problem, a nonrectangular finite-difference grid is wrapped around the airfoil, as shown in Figure 20.3. Equations (20.1) to (20.5) have to be transformed into the new curvilinear coordinate system in Figure 20.3. The details are beyond the scope of this book; see Reference 56 for a complete discussion. Some results for the streamline patterns are shown in Figure 20.4a and b. Here, the flow over a Wortmann airfoil at zero angle of attack is shown. The freestream Mach number is 0.5, and the Reynolds number based on chord is relatively low, Re = 100,000. The completely laminar flow over this airfoil is shown in Figure 20.4a. Because of the peculiar aerodynamic properties of some low Reynolds number flows over airfoils (see References 51 and 56), we note that the laminar flow separated over both the top and bottom surfaces of the airfoil. However, in Figure 20.4Й, the turbulence model is turned on for the calculation; note that the flow is now completely attached. The differences in Figure 20.4a and b vividly demonstrate the basic trend that turbulent flow resists flow separation much more strongly than laminar flow.

Oblique Shock and Expansion Waves

In the case of air (and the same is true for all gases) the shock wave is extremely thin so that calculations based on one-dimensional flow are still applicable for determining the changes in velocity and density on passing through it, even when the rest of the flow system is not limited to one dimension, provided that only the velocity component normal to the wave is considered.

G. I. Taylor and J. W. Maccoll, 1934

9.1 Introduction

In Chapter 8, we discussed normal shock waves, that is, shock waves that make an angle of 90° with the upstream flow. The behavior of normal shock waves is important; moreover, the study of normal shock waves provides a relatively straightforward introduction to shock-wave phenomena. However, examining Figure 7.4a and the photographs shown in Figure 7.5, we see that, in general, a shock wave will make an oblique angle with respect to the upstream flow. These are called oblique shock waves and are the subject of part of this chapter. A normal shock wave is simply a special case of the general family of oblique shocks, namely, the case where the wave angle is 90°.

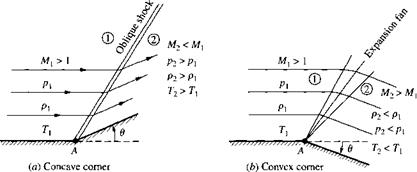
In addition to oblique shock waves, where the pressure increases discontinuously across the wave, supersonic flows are also characterized by oblique expansion waves, where the pressure decreases continuously across the wave. Let us examine these two types of waves further. Consider a supersonic flow over a wall with a corner at point A, as sketched in Figure 9.1. In Figure 9.1a, the wall is turned upward at the corner through the deflection angle в; that is, the corner is concave. The flow at the

Oblique Shock and Expansion Waves

Figure 9.1 Supersonic flow over a corner.

wall must be tangent to the wall; hence, the streamline at the wall is also deflected upward through the angle 9. The bulk of the gas is above the wall, and in Figure 9.1a, the streamlines are turned upward, into the main bulk of the flow. Whenever a supersonic flow is “turned into itself” as shown in Figure 9.1a, an oblique shock wave will occur. The originally horizontal streamlines ahead of the wave are uniformly deflected in crossing the wave, such that the streamlines behind the wave are parallel to each other and inclined upward at the deflection angle 9. Across the wave, the Mach number discontinuously decreases, and the pressure, density, and temperature discontinuously increase. In contrast, Figure 9.1 b shows the case where the wall is turned downward at the comer through the deflection angle 9; that is, the comer is convex. Again, the flow at the wall must be tangent to the wall; hence, the streamline at the wall is deflected downward through the angle 9. The bulk of the gas is above the wall, and in Figure 9.1 b, the streamlines are turned downward, away from the main bulk of the flow. Whenever a supersonic flow is “turned away from itself” as shown in Figure 9.1 b, an expansion wave will occur. This expansion wave is in the shape of a fan centered at the comer. The fan continuously opens in the direction away from the comer, as shown in Figure 9.1 b. The originally horizontal streamlines ahead of the expansion wave are deflected smoothly and continuously through the expansion fan such that the streamlines behind the wave are parallel to each other and inclined downward at the deflection angle 9. Across the expansion wave, the Mach number increases, and the pressure, temperature, and density decrease. Flence, an expansion wave is the direct antithesis of a shock wave.

Oblique shock and expansion waves are prevalent in two – and three-dimensional supersonic flows. These waves are inherently two-dimensional in nature, in contrast to the one-dimensional normal shock waves discussed in Chapter 8. That is, in Figure 9.1a and b, the flow-field properties are a function of x and y. The purpose of the present chapter is to determine and study the properties of these oblique waves.

What is the physical mechanism that creates waves in a supersonic flow? To ad­dress this question, recall our picture of the propagation of a sound wave via molecular collisions, as portrayed in Section 8.3. If a slight disturbance takes place at some point

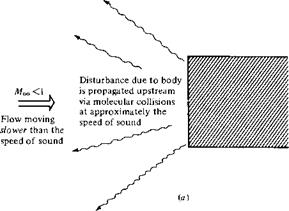
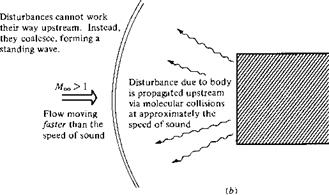
in a gas, information is transmitted to other points in the gas by sound waves which propagate in all directions away from the source of the disturbance. Now consider a body in a flow, as sketched in Figure 9.2. The gas molecules which impact the body surface experience a change in momentum. In turn, this change is transmitted to neighboring molecules by random molecular collisions. In this fashion, information about the presence of the body attempts to be transmitted to the surrounding flow via molecular collisions; that is, the information is propagated upstream at approxi­mately the local speed of sound. If the upstream flow is subsonic, as shown in Figure 9.2a, the disturbances have no problem working their way far upstream, thus giving the incoming flow plenty of time to move out of the way of the body. On the other hand, if the upstream flow is supersonic, as shown in Figure 9.2b, the disturbances cannot work their way upstream; rather, at some finite distance from the body, the

Oblique Shock and Expansion Waves

Oblique Shock and Expansion Waves

Figure 9.2 Propagation of disturbances, (a) Subsonic flow, (b) Supersonic flow.

disturbance waves pile up and coalesce, forming a standing wave in front of the body. Hence, the physical generation of waves in a supersonic flow—both shock and ex­pansion waves—is due to the propagation of information via molecular collisions and due to the fact that such propagation cannot work its way into certain regions of the supersonic flow.

Why are most waves oblique rather than normal to the upstream flow? To answer this question, consider a small source of disturbance moving through a stagnant gas. For lack of anything better, let us call this disturbance source a “beeper,” which periodically emits sound. First, consider the beeper moving at subsonic speed through the gas, as shown in Figure 9.3a. The speed of the beeper is V, where V < a. At time t = 0, the beeper is located at point A; at this point, it emits a sound wave which propagates in all directions at the speed of sound, a. At a later time t this sound wave has propagated a distance at from point A and is represented by the circle of radius at shown in Figure 9.3a. During the same time, the beeper has moved a distance Vt and is now at point В in Figure 9.3a. Moreover, during its transit from A to B, the beeper has emitted several other sound waves, which at time t are represented by the smaller circles in Figure 9.3a. Note that the beeper always stays inside the family of circular sound waves and that the waves continuously move ahead of the beeper. This is because the beeper is traveling at a subsonic speed V < a. In contrast, consider the beeper moving at a supersonic speed V > a through the gas, as shown in Figure 9.3b. At time t = 0, the beeper is located at point A, where it emits a sound wave. At a later time t this sound wave has propagated a distance at from point A and is represented by the circle of radius at shown in Figure 9.3b. During the same time, the beeper has moved a distance V t to point B. Moreover, during its transit from A to B, the beeper has emitted several other sound waves, which at time t are represented by the smaller circles in Figure 9.3b. However, in contrast to the subsonic case, the beeper is now

Oblique Shock and Expansion Waves

constantly outside the family of circular sound waves; that is, it is moving ahead of the wave fronts because V > a. Moreover, something new is happening; these wave fronts form a disturbance envelope given by the straight line BC, which is tangent to the family of circles. This line of disturbances is defined as a Mach wave. In addition, the angle A BC which is the Mach wave makes with respect to the direction of motion of the beeper is defined as the Mach angle /л. From the geometry of Figure 9.3b, we readily find that

Подпись: 1 M Подпись: a V at

sin a — — lft

Oblique Shock and Expansion Waves

Thus, the Mach angle is simply determined by the local Mach number as

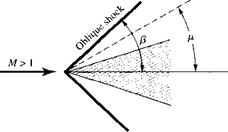
Examining Figure 93b, the Mach wave, that is, the envelope of disturbances in the supersonic flow, is clearly oblique to the direction of motion. If the disturbances are stronger than a simple sound wave, then the wave front becomes stronger than a Mach wave, creating an oblique shock wave at an angle /3 to the freestream, where fi > fi. This comparison is shown in Figure 9.4. However, the physical mechanism creating the oblique shock is essentially the same as that described above for the Mach wave. Indeed, a Mach wave is a limiting case for oblique shock (i. e., it is an infinitely weak oblique shock).

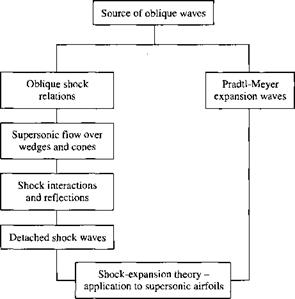
This finishes our discussion of the physical source of oblique waves in a super­sonic flow. Let us now proceed to develop the equations which allow us to calculate the change in properties across these oblique waves, first for oblique shock waves, and then for expansion waves. In the process, we follow the road map given in Figure

9.5.

Oblique Shock and Expansion Waves

Figure 9.4 Relation between the oblique shock-wave angle and the Mach angle.


Oblique Shock and Expansion Waves

Figure 0.5 Road map for Chapter 9.