Effects of the Hybrid Border on the Flow Solution
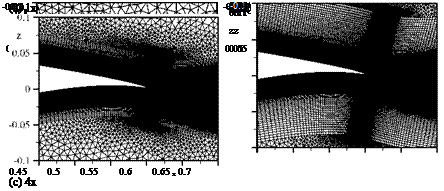
Hybrid grids are widely used in many scientific and industrial applications. Commonly, these grids have very thin structured layers. But the effects of the size of the structured layer on the flow solution and especially on the aerodynamic coefficients are not well known. Thus, an analysis was conducted for the NLF(0)416 airfoil with sharp trailing edge and c-type mesh. Four grid variants were generated by varying the thickness of the structured layer where the reference thickness was derived from the flat plate boundary layer at Re = 4 • 106, Ma = 0.1. The structured layers were sized with one, two, four and eight times the size of the reference thickness. These four grids, named 1x, 2x, 4x and 8x, are shown in Figure 6. To perform a grid
 |
0.45 0.5 0.55 0.6 0.65 x 0.7 0.45 0.5 0.55 0.6 0.65 x 0
Fig. 6 Variation of the structured layer dimension for the NLF(0)416 airfoil with sharp trailing edge, c-type grid. The dimension is given in multiple of the corresponding flat plate boundary layer thickness.
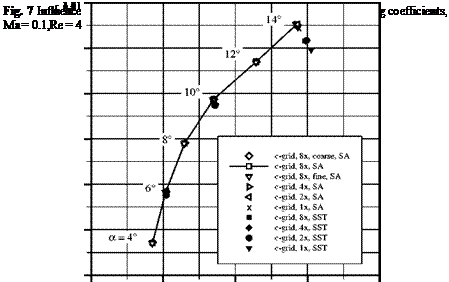
convergence study, two additional grids were generated by unified coarsening and refinement of the grid 8x. Solutions were obtained for a = 4° to 14° in steps of two degrees using the Spalart-Almaras turbulence model. In addition, solutions were obtained at a = 6°, 10° und 14° using the SST-Model [8]. The results are shown in Figure 7.
The polar curve shows that 8x yields a sufficiently grid converged solution across the whole range of a. The differences to the next finer grid "8x, fine" are negligible. The coarse grid "8x, coarse" gives slightly different results at a = 14°. The polar curves computed with the SA-turbulence-model show that the effect of the structured layer thickness on the lift coefficient is small for attached flow (a = 4° to 12°). The difference in the lift coefficient varies from 1.50 to 3.70 lift counts, while it is increasing with the angle of attack. For a > 12°, trailing edge separation occurs, so at a = 14° the differences in the lift coefficients are not negligible anymore. As it will be shown later, this is attributed to the poor resolution of the trailing-edge separation. The differences in the drag coefficients are primarily caused by different
 |
0.04
levels of resolution of the region surrounding the stagnation point and the suction peak. The thicker the structured layer is, the better it can resolve the flow gradients in that area. The same conclusions are true for the results obtained with the SST-model. For attached flow, differences ranging from 1.50 to 2.60 drag counts are observed. Though, with flow separation at the trailing edge, the SST-model shows a higher sensitivity to the thickness of the structured layer. Here, cl differs by 3.0 lift counts, whereas cd differs by 8.20 drag counts. For both turbulence models, the flow solution is moderately affected by the thickness of the structured layer for attached flow. In case of separated flow, a significant influence on both cl and cd is observed. These differences can be mainly ascribed to two effects.
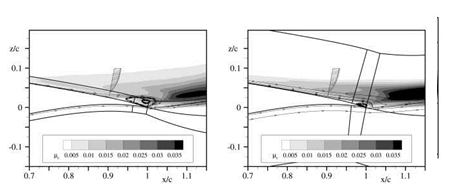
The first effect is the influence of the structured layer thickness on the size and shape of the trailing edge separation. Figures 8(a)-8(b) show the flow field solution at the vicinity of the trailing-edge gained with the SA-model. In Figures 8(c)-8(d) the flow field solution obtained with the SST-model are depicted. The eddy viscosity fat is shown via a contour plot. In addition, a velocity profile in the separation region is shown. On the grid 1x large parts of the boundary layer as well as parts of the free shear layer reach into the unstructured part of the grid. On 8x those parts are completely captured by the structure part. A comparison of the plots reveal that the production of fat is related to the thickness of the structured layer. Thus, the thickness of the structured layer has an influence on the size of the trailing edge separation. Regarding the case with the SST-model, the influence of the structured
![]()
 |
Re = 4-10′
layer thickness on дt is even greater and thus the size of the trailing edge separation is bigger. To further analyse this, the velocity profiles and the rotation rot (v) at two slices x/c = 0.3 and x/c = 0.9 normal to the airfoil contour are plotted in Figure 9. At x/c = 0.3 the boundary layer is completely within the structured layer, on both grids. Velocities and gradients are continuous and show little difference. At x/c = 0.9, the structured part of grid 1x does not cover the boundary layer, the flow separation and the free shear layer completely. Here, the velocity profile has a discontinuity at the hybrid border whereas the velocity gradient shows a kink at z/c & 0.016. Taking into account that the turbulence equations are solved using the velocity gradients, the influence of the hybrid border becomes obvious.
The second effect is the difference in cd caused by the erroneous prediction of the trailing edge separation as well as the poor resolution of the flow gradients at the vicinity of the suction peak.


