Category FLUID-DYNAMIC LIFT

LIFT FORCES ON STRUCTURES

The drag force produced on fixed buildings or structures is considered in Chapter IV of “Fluid-Dynamic Drag”. The lift force generated on the structure is also an impor­tant design element, especially in the design of roofs and structural overhangs. Also, the lift force produced on smaller objects is important as these can become airborn and cause damage under certain conditions.

Ambient Wind Characteristics.!о determine the wind gen­erated loads on buildings, the worst ambient conditions that would occur in a given time span are used. These would be, for instance, the worst mile of wind over a period of say 50 years and would not necessarily include the winds generated as a result of tornados or hurricanes. In certain instances it is necessary to consider the forces and pressures generated as a result of tornados and hurri­canes where a large loss of lift might be involved.

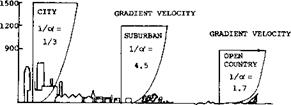
Fastest Mile Wind. The average speed of one mile of air passing an anemometer is defined as the fastest mile wind. This definition is used as a basis for design so that the effects of gusts that are small with respect to the structure will be eliminated. Charts of the occurrence of the fastest mile-speed are given for the United States at a height of 30 feet above the ground (16,b). In calculating the loads due to the fastest mile wind corrections are made for the exposure, wind profile gradient as a function of terrains and gusts, figure 22. The velocity at any height is deter­mined from the equation

Vz = VG (Z/Za t (11)

where V is the velocity at any height Z and V and Z are standard values adopted (16,a) for various terrains, figure 22, and are given in the table

Terrain

(ft)

l/of

Open Country

900

1/7

Suburban

1200

1/4.5

City

1500

1/3

GRADIENT VELOCITY

LIFT FORCES ON STRUCTURES

Figure 22. Wind profile variation with height for city, suburban and open country locations.

The characteristics of hurricanes and tornados are needed for the design of structures; such as atomic power plants, and associated structures.

Hurricanes (16,b). Hurricanes are defined as tropical cyclones with a speed of at least 74 mph. The wind field is a function of the radius of maximum winds, the central pressure difference and forward speed. The strongest winds occur along the rim of the eye near the wall cloud. The wind speed will often reach a speed of 100 ter 135 mph with winds of over 200 mph occurring in severe storms. The damage on structures produced by such high winds where the dynamic pressure can exceed 50 is usu­ally severe.

Tornados. One of nature’s most violent phenomena is the tornado. Although its horizontal extent is small it is char­acterized by a visible funnel, which contains dust and debris extending downward from the base of a cumlo – nimbus cloud of a thunderstorm. The winds and motion of air in a tornado vortex can be divided in four com­ponents; translational, rotational, vertical and radial. At the ground level the translational and rotational com­ponents are most significent. The translational speed of a tornado is anywhere from 0 to 70 mph with the usual speed being 40 to 45 mph. The maximum rotational speeds are believed to be based on wind damage estimates from 200 to 300 mph. With q’s up to 230 psf widespread damage is certain. In the core of the tornado the pressure can be 3 psi below the ambient. With this low pressure and the high winds, large objects can become airborn and cause large amounts of damage when striking stationery structures.

At altitudes above Ze the gradient velocity is assumed to be constant.

The effect of the direction of the exposure and gusts are covered by various standards (16,a, b) and should be used to find the true speed for finding the loads on a given structure.

(16) Lift in buildings and structures:

a) American National Standards Institute, Standard Building Code Requirements, ANSI A58.1-1972.

b) Defense Civil Preparedness Agency, “Multi Protection De­sign” TR-20 (Vol 6) Dec 1973.

c) Ackeret, “Aerodynamics in Structural Engineering” RAE LT 1185 (1965).
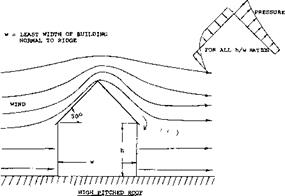
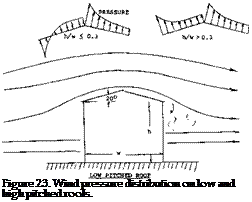
LIFT FORCES ON STRUCTURESLift in Structure Design. The lift forces generated on the various parts of a building must be determined and con­sidered in their structural design. These forces can be as important as the drag forces discussed in “Fluid-Dynamic Drag” and generally are more poorly understood (16,c). The lift forces on a structure generally effect the roof design as large negatvie pressures in combination with positive pressures, as illustrated on figure 23, produce high loads. Based on the effective pressure as determined based on the fastest mile wind corrected for height, terrain and exposure as discussed previously, the effective dynamic pressure is calculated from the equation:

Подпись: ii Я N О II Я N О

Подпись: Figure 23. Wind pressure distribution on low and high pitched roofs. where q is the basic wind pressure based on the fastest mile of wind at a height of 30 feet. is the velocity pressure coefficient at height Z from equation (12) and G is a gust factor (16,b). The subscripts F and P correspond to the effective velocity pressure for the full building or a part.

Based on qr or qp above, the standards have been gen­erated (16,a) for establishing the pressure coefficients. These depend on the type of roof. A Cp of —0.7 is typi­cal of gable roofs on the leeward slope. At ridges, eaves and sharp corners the Cp varies from —1.7 to —5.0. In addition to (16,c) estimates of Cp can be estimated from the data given in Chapters II, III and XVII..

Tall Buildings, Towers, Stacks. Structures that are tall where the height exceeds the base by a factor of 5 or greater can be subjected to dynamic effects. For instance, round smoke stacks can have a natural frequency near the vortex shedding frequency as determined using figure 2&4. Similar problems are found with other tall str uctures and should be checked.

[1] Theoretical advancement of aerodynamics: *

a) Prandtl, Necrology, see Journal Aeron Sciences 1953 p 779.

b) Lanchester, “Aerodynamics”, London 1907; and “Aero – netics”, 1908.

c) Prandtl, “Essentials of Fluid Dynamics”, Traro New York 1952.

d) The aerodynamic center of airfoils and/о" wings was established by v. Mises (1917 and 1920) and quoted or re­peated by Munk (1922), Glauert (3,f), Durand (3,i), and Theodorsen (NACA Rpt 383 and 411).

e) Dryden, Karman’s Contributions, Astronautics Aerospace Engg July 1963.

0 Glauert, “Aerofoil and Airscrew Theory”, Cambridge 1926.

g) Schlichting, “Boundary Layer Theory” (1951, 1965), McGraw Hill 1955.

i) Durand, 6 volumes of “Aerodynamic Theory”, 1934/36/43.

[2] Experimental fluid dynamics (wind tunnels):

a) Otto Lilienthal, Rotating Arm, see reference (2,b).

b) Flachsbart, History of Experimental FIJid-Dynamics (from the Greeks to past 1900), Volume IV-2 of Wien-Harms “Handbook Experimentalphysik” (1932).

c) Eiffel, Recherches de ГАіг et TAviation, Paris 1910 and 1914.

d) Ergebnisse AVA Gottingen, Volumes I (1920) II (1923) III (1927) IV (1934).

e) Lewis: “The model test may be considered as an anlogue type of computer”, stated in Transactions SNAME 1954 p 431.

f) Schulz, Design and Use of Tunnels. Luftfahritechnik 1958 p 1 05.

g) Hoerner, Design and Operation of a WaterTunnel. Fieseler Rpts 1939.

[4] Characteristics and description of wind tunnels:

a) Prandtl, Wind-Tuunel Design, in Wien-Harms Handbook Vol IV-2 (1932).

b) Hoemer, Survey of European Tunnels, Z. VDI 1936 p 949.

c) DeFrance, Full-Scale Wind Tunnel, NACA Rpt 459 (1933).

d) Schaefer, Wind Tunnels at Langley Field, NASA 1M X-1130 (1965).

e) Hoerner, Spheres and Turbulence, Lufo (March 1935) p 42; NACA TM 777.

f) Hoerner, TH Brunswick Wind Tunnel, Luftf Forschurg 1937 p 36.

g) Schuh, Tunnel Turbulence and Noise Measured, ARC RM 2905 (1957).

h) Anon, National Wind-Tunnel Summary, NASA and De­fense Department (1961), available from U. S. Department of Commerce.

[5] General and varied information on applied aerodvanmics:

a) Goldstein, “Modern Developments Fluid Dynamics”, Lon­don 1938.

b) Eck, “Technische Stromungslehre”, Springer 1941 aid 1961.

c) rhwaites, “Incompressible Aerodynamics”, Clarendon C <- ford 1960.

[6] Physical properties and characteristics of water:

a) See tor example in Transactions INA (London) 1953 p 35 8.

b) See in chapter I of kT luid-Dynamic Drag”.

c) The salinity in the Dead See is 2 2%. The corresponding density ratio as against fresh water is estimated to be 1.2 6.

[9] Consideration of dynamic stability:

a) Braun, Static Stability, Ringbuch Luftfahrtechnik LB-6 (1940).

b) Jones, Airplane Dynamics, in Volume V of Durand (3,1).

c) Rodgers, Neutral Point, AIAA J. Aircraft 1965 p 33 and 352.

d) Carlson (Wright-Patterson AF Base), Analysis of Stability and Control of Lockheed C-5A Airplane, Astronautics V Aeronautics 1965 p 60.

[10]

(F^, ) is as in equation 42. Note that numerically, W(kp) = m(kg). The “huge” airplane is assumed cruising at an altitude of 10 km, where air density is less than half of that at sea level. The hydrofoil boat is “flying” in (or above) water, where density is a 1000 times that of atmospheric air at an altitude of 2 km.

[12]

[13] Early investigations of wing sections:

a) Lilienthal, “Vogelflug/Fliegekunst”, Berlin 1889.

b) Eiffel, “La Resistance de l’Air et FAviation”; and "Nouvelles Re( herches. . .” Paris 1910, 1919.

c) Munk (k others), Systematic Tests, Tech Berichte der Fliegertruppen Vol I (1917) and Vol II (1918).

[14] Practical information on foil sections and their mechanics can be found in engineering books, such as:

a) Diehl, “Engineering Aerodynamics”. Ronald 1936.

b) Prandtl, “Fiihrer Stromungslehre”, 1942; “Essentials of Fluid Dynamics”, London к New York 1952.

c) Goldstein, “Developments in Fluid Dynamics”, 1936.

d) Schlichting,’Boundary Laver Theory,’ Mc-Graw-Hil

e) Wood. “Aircraft Design”. Author Uni Colorado, 1965.

f) Pope. “Wing and Airfoil Theory”, McGraw Hill

[15] McLarren, “Wright Fiver", Aero Digest July 1953.

[16] Theory and tunnel testing of [oukowsky sections:

a) (oukowsky, Zeitschr Flugtech Motorluft РЖ).

p 281; also in his “Aerodvnamique”, Paris 1916.

b) AfA Gottingen, 36 Foils. Erg III к IV (1927/32).

c) Glauert. Generalі/.(ч’1 Family. .ARC’ RM 911 (1924).

d) ARC, Series 4‘ested. RM 1241 (1929) A 1670(1931,0.

[17] British information on airfoil sections:

a) Pankhurst, NPL Catalogue, ARC C’Paper 81 (1952).

b) Experimental results are found in (36).

c) Nonweiler, Survey, Aircraft Engg 1956 (July).

[18] Riegels, “Aerodvnamische Profile”, Mimchen 1958;

Theorv 8c Experimental Results Over Past 30

[19] Reflexed foil sections for airplane wings:

a) Defore, In V’Densitv Tunnel, NACA TN 388 (1931).

b) Jacobs, “M” Series Foils, NACA Rpt 532 8c 628.

c) 23012 (figure 5) considered to be reflexed?

tl) 2-R-12 Sections in VD Tunnel, NACA TR 460.

e) Moscow, ‘B’ Airfoils, САНІ Rpt 903 (1923).

0 British RAF-34 (figure 3), ARC RM 1771 (1936).

g) For supercritical M’Numbers, NACA T’Rpt 947.

[20] Fage, Lift and Drag = f(A), ARC RM 903 (1923).

[21] For example, a = 4 (as in the 64 Series of NACA airfoil sections) means that at design lift, pressure due to camber remains at its minimum plateau up to x = 0.4 c.

[22] flow pattern and mechanics of vortices:

a) Betz, About Vortex Systems, NACA TM 767.

b) Newman, Trailing Vortex, Aeron Quart 1959 p 149.

[23] Characteristics of elliptical sections:

a) Williams, Elliptical in CAT, ARC RM 1817 (1937).

b) Polhamus, Non-Circular, NASA TR R-46 (1959).

c) Dannenberg, “Airfoil” w’Suction, NACA TN 3498. (1955).

d) Gregory, Thick with Suction, ARC RM 2788 (1953).

[24] Characteristics of sharp-nosed sections:

a) Daley, 6% Thick Sections, NACA TN 3424 (1955).

b) DVL, Double-Arc Sections, see (6) or (34,c).

c) Solomon, Double Wedge, NACA RM A1946G24.

d) Critzos, 0012 to cx 180°NACA TN 3361, 3241.

e) Lift in reversed flow similar to that in (d) for 2212,

Ybk D Lufo 1938 p 1-90 (NACA TM 1011).

f) Lock, Symmetrical Also Reversed, ARC RM 1066 (1926).

g) Polhamus, Drag Due to Lift, NACA TN 3324 (1955).

h) Williams, 4 Circular Arc Foils, ARC RM 2301 (1946).

i) Note that flow does go around leading edge (“no” boundary laver vet), to considerable degree.

[25] In a manner related to that of maximum lift (see the chapter on this subject) the lift-curve slope is also affect­ed (usually increased) by stream turbulence. For ex­ample (as reported by Millikan, CIT, around 1939) dC^/doGd 2412 increases from 0.094 (for 0.3% turbu­lence) to 0.105 (for 5.3% turbulence) at Rc = 1.4 (10)^.

.0! .o2 <03 -05*

Figure 22. Lift angle (15) ol toil sections as a function of minimum drag (friction and roughness).

—I—

Figure 23. The lift angle (15) of airfoil sec­tions as a function of Reynolds number, affecting their skin friction drag.

REYNOLDS NUMBER. Combining the last equation with a function expressing the section – drag coefficient for fully turbulent BTayer flow:

<W,„ – 0.1/R,/6 (14)

we can predict the variation of the lift angle at higher Reynolds numbers to be

A(da7dCL)»200 (t/c)/R/6 (15)

Some experimental results (reduced to two – dimensional coij&ition) as plotted in figure 23, confirm this expression at Renumbers above

[28]6. Below that number, serious variation can take place (due to BTayer transition) the character of which seems to depend upon the particular shape of the section nose.

B’LAYER TRANSITION. Growth andflowcon­dition of the boundary layer are a function of the Reynolds number (and of wind-tunnel tur­bulence). The character of the BTayer, whether laminar or turbulent, also depends upon the angle of attack. As a consequence, the Cl (o<) function is not always completely straight. Transition from laminar to turbulent BTayer flow may, for example, make the lift – curve slope slightly irregular, particularly at smaller R’numbers. We have, wherever this seems to take place, in the many graphs in this text, indicated discontinuities in the Cl(o<) function by not fairing a line through them, but by leaving the experimental results as discontinuous as they are found.

[29] High Lift, Low Drag Airfoils

a) Wortmann, The Quest for High Lift, AIAA 74-1018.

b) Nash-Webber, Motorless Flight Research, NASA CR-2315.

c) Althaus, Stuttgarter Profilkatalog I, U of Stuttgart 1972.

d) Liebeck, Airfoils for High Lift, J of А/С Oct 1973.

e) Hicks, Optimizing Low-Speed Airfoils, NASA TM X-3213

[30] High Performance Airfoils for General Aviation

a) McGhee, Characteristics of a 17% Airfoil, NASA TND-7428.

b) Wentz, Fowler Flap System, NASA CR-2443.

[31] Mechanism of, and penalties due to icing:

a) Gelder, Droplet Impingement, NACA TN 3839.

b) Bosoden, Aerodyn Characteristics, NACA TN 3564.

c) Gray, Penalties (Summary), NASA TN D-2166 (1964).

[32] At negative angles (negative camber):

a) NACA, In Variable Density Tunnel, TN 397 & 412.

b) AVA Gottingen, Ergebnisse III (1927) p 78, 79.

c) Williams, RAF-34 in CAT, ARC RM 1772 (1937).

[33] NACA “H” sections, for helicopter blades:

a) Stivers, Several Sections, W’Rpt L-29 (1946).

b) Schaefer, Between 9 and 15% Thick, TN 1922 (1949).

c) Stivers, 8-H-12 Section, TN 1998 (1949).

[34] “Laminar” airfoils for sailplanes:

a) Carmichael, Thick Foils, “Soaring” 1958 (Nov/Dec).

b) Wortman, Laminar Profiles, ZFW 1957 (May).

[35] Cascades of foils, vanes, blades:

a) Krober, Ingenieur Archiv 1932 p 516.

b) Patterson, Duct Corners, ARC RM 1773 (1936).

c) ARC, Tests, RM 1768; Analysis, RM 2095 & 2920.

[36] Principles and results of lifting-line theory:

a) Prandtls Wing Theory, Nachrichten Konigliche Gesellschaft Wi’schaften 1918 p 451, 1919 p 107.

b) Glauert, “Elements of Aerofoil and Airscrew Theory”, Cambridge University Press, 1926 and 1948.

c) Account of Lanchester’s work given by Prandtl “Generation of Vortices”, Paper RAS London, 1927.

[37] Analysis of trailing wing vortices:

a) Wetmore, Hazard For Aircraft, NASA TN D-1777; also Astronautics/Aeronautics, Dec 1964 p 44.

b) Kaden, Roll-Up Analysis, Ing Archiv 1931 p 140.

c) McCormick, Vortex Sheet, Penn U A’Engg 1965.

d) See AIAA J. 1963 p 1193; Aeron Quart 1965 p 302.

e) Mechanism of vortices (cores) by Newman, Aeron Quart 1959 p 149; Schaefer, J. Fluid Mech 1959 p 241.

f) Squire, Viscous Analysis, Imp Coll London (1954).

[38] Experimental results end plates and winglets

a) NACA Technical Rpts 201 and 267 (1927).

b) Riley, End-Plate Shape, NACA TN 2440 (1951).

c) Clements, Canted Plates, Aeron Eng Rev July 1955.

d) See due-to-lift chapter in “Fluid-Dynamic Drag”.

e) Riebe, On 45° Swept Wing, NACA TN 2229 (1950).

f) Wadlin, On Hydrofoil, NACA RM L1951B13.

g) Bates, H’Tail Surfaces, NACA TN 1291 (1947).

h) САНІ (Moscow) Technical Rpt 58 (around 1930).

i) Halliday, Very Large Plates, ARC CP 305 (1956).

k) Riley, Vertical With Horizontal Tail, NACA Rpt 1171.

j) Roberts, Drag Planer Wings USAACLABS TR 65-79

k) Whitcomb, Design and tests Winglets, NASA TN D-8260, 1976

l) Kirkman, Effectiveness Devices Tests, NASA CR-2202, Dec. ’73

m) Flechner, Second-Generation winglets, NASA TN D 8264 1976

n) Wentz, Wing-Tip devices N76 11012, July ’75

[39] Pressure distribution around foil sections:

b) Kochanowsky, Theoretical, Ybk D Lufo 1940 p 1-72.

a) Pinkerton, 4412 Distribution, NACA T Rpt 613.

[42] Airfoils with A = 6, tested in NACA FSTunnel:

a) Silverstein, Clark-Y Airfoil, T Rpt 502 (1934).

b) Goett; 009, 0012, 0018 Airfoils, T Rpt 647 (1939).

c) Bullivant, 0025 and 0035 Airfoils, T Rpt 708 (1941).

[43] Airfoils as tested in “large” DVL wind tunnel

a) Doetsch and Kramer, Lufo 1937 p. 367 and 480; also Yearbk D Lufo 1937 p. 1-69, 1939 p. 1-88 and 1940 p. 1-182.

b) Hoerner, Clark-Y Series, DVL Rpt Jf 208/3 (1940): also in small tunnel, FB 65 (1934).

c) Collection of DVL Results, ZWB FB 1621 (1943).

d) For DVL (and other) results see also reference 19.

e) Pressure Distributions, Ringbuch Luftf Tech I, A,11.

[47] Influence of stream turbulence:

a) Platt, Turbulence Factors, NACA T Rpt 5 58 (1936).

b) Dryden, Turbulence Companion of R’Number, J A Sci 1934 p. 67; also Wind Tunnel Turbulence, NACA T Rpts 320, 342, 392, 581 (1929/37).

c) Milliken, Turbulence Aircraft Engg 1933 p. 169; Max­imum Lift, ASME Trans 1934 p. 815.

d) Hoerner, Influence on Spheres, Lufo 1935 p. 42 (NACA Memo 777).

e) Dryden, Low-Turbulence Tunnels, T Rpt 940 (1949). 0 Jacobs, NACA VDT Tunnel, T Rpt 416 (1932).

[48] A variety of wing sections can be found in:

a) Ergebnisse AVA Gottingen, 4 volumes (1920/32).

b) Louden, Collection of Foils, NACA T Rpt 331 (1929).

c) ARC, RAF-34, RM 1071, 1087, 1146, 1635, 1708, 1772 (1927/37).

d) Characteristics of airfoil sections from all over the world, at lower or intermediate R’numbers, have been collected and presented in NACA T Rpts 93, 124, 182, 244, 286, 315 (1920 to 1929).

[49] Influence of roughness caused by icing:

a) Gerhardt, (AVA), Ybk D Lufo 1940 p. 1,575.

b) Bowden, Ice Formation, NACA TN 3564 (1956).

c) Gray, 65-212 Airfoil, NACA TN 2962 (1953).

[50] Lift at High Angles of Attack 0-180°:

a) Critzos, NACA 0012, oc-Q to 180°, NACA IN 3361.

b) Helicopter Model Blade Stall, J of AHS, Jan 1972.

c) Sike and Gorenberg, 63A, oC – 0 to 180° AVLABS TR 65- 28, AD 619153

[51] Particularly thick airfoils with flaps:

a) Wenzinger, 23021 With Slotted Flaps, NACA TRpt 677 (1939).

b) Duschik, 23021 With 40% Slotted Flap, NACA TN 728 (1939).

c) Recant, 23030 Airfoil With Various Slotted Flaps, NACA TN 755 (1940).

d) Harris, Pressure Distribution With Slotted and Split Flap, NACA TRpt 718.

e) Harris, 23012/30 Airfoils With Slotted Flaps, NACA TRpt 723 (29,a) (1941).

f) Wenzinger, 23012/30 Airfoils With Split Flaps, NACA TRpt 668 (15,b) (1939).

[52] Airfoils with slats and trailing-edge flaps:

a) Seiferth, High-Lift Airfoils, Yearbk D Lufc 1939 p 1-84.

b) Lyon, High-Lift Devices, ARC RM 2180 (‘.939).

c) Schuldenfrei, 23012 With Slat and Flaps, NACA WRpt L-261 (1942).

* САНІ SECTION WITH 30° SLOTTED FLAP (3,a)

О SAME COMBINATION IN WATER TUNNEL 106 (3,b)

* 23012 W’ MAXWELL SLAT AT 2(10 )6 (6,b, C)

[54] (WITH AND WITHOUT 204/60° SPLIT FLAP)

X CLARK-Y W’ MAXWELL SLAT AT 6(10)5 (6,a)

x (WITH AND WITHOUT 20%/60° SPLIT FLAP)

Л BRITISH EQ-1040 SECTION AT 9(10)5 (5,e)

Л (WITH AND WITHOUT 204/60° SPLIT FLAP)

О RAF-31, WITHOUT TRAILING FLAP (5,g)

Figure 7. Maximum lift coefficients as a function of the slat-chord ratio.

[55] Investigation of so-called Kruger flaps:

a) Kruger, Laminar Wings with Nose Flaps, ZWB FM-1148 (1944);

b) Kruger, Mustang Airfoil (including pressure distributions) ZWB UM-3153 (1944); see NACA TM 1177.

c) Riegels, Russian Airfoil, ZWB UM-3067 (1944); see NACA TM 1127.

d) Fullmer* 64-012 Airfoil With Kruger Flaps, NACA TN 1277 (1947).

[56] Boundary-layer control of nose flaps by suction:

a) Holzhauser, Airplane With Flaps and BL Control, NACA RM A1957K01.

b) Koenig, Wing Fuselage With Flaps and Suction, NACA RM A1956D23.

c) There are many wind-tunnel results available, dealing with flaps and boundary-layer control on swept wings such as NACA RM A1953J26, A1955K29, A1956F01, A1957H21. Some information on such wings is presented in the “swept wing” chapter.

d) Holzhauser, Tunnel and Flight Tests on a 35 Swept Wing With Leading-Edge Suction Flap, NACA TRpt 1276 (1956).

[57] Hoerner, Maximum Lift by Blowing, ZWB (DVL) FB-276/1&2 (1935).

[58] Munk, Comments on Velocity of Sound, J. Aeror Sci 1955 p Figure 1. Propagation of pressure disturbances in a compressible 795. fluid in relationship to operating speed.

[59] Pressure distribution and lift of airfoils as a function of M’number:

a) von Doenhoff, Cambered at Low Speed, NACA TN 1276 (1947).

b) Wall, Chordwise Distribution, NACA TN 1696 (1948).

c) Cooper, Testing the Same Wing as in (a), NACA TN 3162 (1954).

e) McCullough, 10% Sections Cambered at Low Speed, NACA TN 2177 (1950).

f) Graham, Five Airfoil Sections, NACA Rpt 832 (1945).

g) Goethert, OOXX Series, ZWB FB-1505 (1941); see Cana­dian Nat Res Laboratories Trans TT-25, 26, 27, 28, 29 (1947).

h) Nitzberg, Evaluation of (f) and (g), NACA TN 2825 (1952).

i) Tapered Wing, Original DVL Graphs Jf-712 (1944).

[60] Characteristics of wings as a function of Mach Number:

a) Nelson, 36 Different Wings on Bump, NACA TN 3529

(1955).

b) Hamilton, 6 Wings 65-Series Airfoils, NACA Rpt 877

(1947).

c) Nelson, 22 Rectangular Wings on Bump, NACA TN 3501

(1955).

d) West, 64-210 Tapered Wing, NACA TN 1877 (1949).

e) Nelson, 38 Cambered Wings on Bump, NACA TN 3502

(1955).

f) Polhamus, 65A Series with A = 2 and = 4, NACA TN 3469

(1955).

[61] Diederich (NACA), analysis of lift as a function of A’ratio

and M’number:

a) Correlation on the Basis of “F”, TN 2335 (195 1 ).

b) Spanwise Lift Distribution (Flaps), TN 2751 (1952).

[65] Characteristics of flaps and control surfaces:

a) Knappe, Heinkel Tunnel Tests, Yearbk D Lufo 1941 p 1-96.

b)Tinling, Horizontal Tail Surface, NAC’A RM A19^9Hlla.

[66] Hydrodynamic characterіstіc-s~ ofv>hip mdders:

a) Hagen, TMB Rpt C-398; also C-125 & 373 (I 951).

b) Jaeger, Torque 8c Pressures, J. Shipb Progr 1955 p 243.

c) Thiemann, In Wind Tunnel, Schiff & Hafen 3962 p 42.

d) The 0015 section with various flaps (rudders) in NACA Wartime Rpts L-378, L-448, L-454 (1942).

[67] Rudder forces and turning of ships:

a) Davidson, Turning 8c Steering, Trans SNAM E 1944/46.

b) Becker 8c Brock, Trials, Trans SNAME 1958, p 310.

c) Mandel, Appendages, Trans SNAME 1953 p 464.

[68] Control Surfaces with flaps, for ships or boats:

a) Windsor, 0015, Univ Md Tunnel Rpt 268 (1959).

b) Bowers, for submarine application, see (9,a).

c) White, Rudder in W’Tunnel, TMB Rpt 1231 (1958).

d) Bates, Collection Tail Surfaces, NACA TN 1291.

[69] Analysis of small aspect ratio wings:

a) Polhamus, Low A’Ratio Wings, NACA TN 3324.

b) Bartlett, Shape of Edges, J Sci 1955 p 517.

[70] Information on modern submarines:

a) McKee, Design Practices, SNAME Paper 11, 1959.

b) Submarines & Destroyers, The Engineer Jan 1962.

c) Control, by McCandliss in IAS Paper 1961-45,

d) Malloy, Aircraft Techniques, IAS Paper 1961-42.

[71] Control surfaces designed for submarines:

a) Bowers, on Simulated Hull, U Md Tunnel Rpt 259.

b) Harper, 0015 Hull, Georgia Inst Tech 1959.

c) Some “surfaces” under (1) for submarines?

[72] An exception are the tests in (15,c).

[73] NACA, Fully Submerged Hydrofoils Tested:

a) Benson к Land, Foils in T’Tank, W’Rpt L-757 (1942).

b) Wadlin, Aspect Ratio 10, RM L9Kl4a (1950).

c) Wadlin-Ram-Vaug, Flat Plates, Rpt 1246 (1955).

d) Wadlin-Shuf-McGeh, Also Theory, Rpt 1232 {1955).

e) See references (15,d) and (17,a).

[74] Fully-submerged hydrofoils (with struts):

a) Kaplan, With A = 6, Stevens ETT Letter Rpt 428.

b) Ripken, 16-509, Univ Minn SAF Lab Rpt 65 (1961).

c) Feldman, 6 Hydrofoils in Tank, DTMB Rpt 1801.

d) Wadlin, End Plates Struts, NACA RM L51B13; see (11,d).

e) Hoerner, Struts-Nacelles, G&C Rpt 14 (1953).

f) Jones, Various Foils, Convair Rpt ZH-146 (1960).

[75] Characteristics of small-aspect-ratio hydrofoils:

a) Wadlin, Rectangular Flat Plates with A =- 0.125, = 0.25, – 1.0; NACA Rpt 1246, TN 3079 & 3249 (1954).

b) Ramsen, Strut Interference, NACA TN 3420 (1955).

c) Vaughan, Plate to 80 ft/sec, NACA TN 3908 (1957).

d) Vaughan, Hydroskis, NASA TN D-51 &: D-166 (1959).

[76] Influence of control flaps upon hydrofoils:

a) Jones, 16-309 With Flaps in Towing Tank,

Convair Rpt ZH-153 1961; AD-268,233.

b) Conollv, Review of Hydrofoils, J Aircr 1965 p 443.

c) Conolly, Flaps in Waves, Convair Rpt GDC-1953-032.

[77] Experimental characteristics of hinged flaps:

a) Silverstein, Horizontal Tail Surfaces, NACA T Rpt 688 (1940); also J Aeron Sci 1939 p 361.

b) Ames and Others, 0009 Pressure Distributions, NACA TN 734, 759, 761 (1939/40), see (2,e).

c) Gothert, Systematic Investigations, ZWB

FB 552 к 553 (1938/40);Yearbk D Lufo 1940 p 1-542.

d) Gothert, Horizontal-Tail Characteristics,

Ringbuch Luftfahrt Technik (Chap I-A-13, 1940).

e) Ergebnisse AVA Gott, Vol. Ill (1926) p 102.

f) Dods, A’Ratio and Sweep, NACA TN 3497 (1955).

g) Wenzinger, Wing Flaps, NACA TR 554 (1936).

h) Irving, Elevators, ARC RM 679 (1920).

i) Jacobs, Pressure Distrib., NACA T Rpt 360 (1930).

j) Polish Results, see (4,d) also NACA TR 688.

k) NACA, Report/Memorandum L1948D09.

l) Glauert, ARC RM 761 (1921) & RM 1095 (1927).

m) Abbott-Doenhoff-Stivers, NACA TR 824 (1945).

n) Swanson, Tail Surface, NACA TN 1275 (1947).

o) Spearman, With 25 к 50% Flaps, NACA TN 1517.

[78] The span ratio bp/b is taken into account in these cases. In presence of a fuselage, “b” of a horizontal tail is to be measured from tip to tip, while the span of the elevator is usually reduced either by a cut-out or corresponding to the width of the fuselage.

[79] Truckenbrodt, Flapped Delta Wing, ZFW 1956 p 236.

[80] It is general practice in tunnel testing to correct the angle of attack for boundary effects of the wind stream, A corresponding correction (likely in proportion to dcx/d<S ) should be applied to the flap angle. We have, wherever possible, used uncorrected tunnel-tested val­ues for the angle of attack.

[81] Flaps on swept-back wings:

d) Harper, NACA TN 2495 (1951); (18,d) (22,c).

e) Letko, Swept-Back Wings, NACA TN 1046 (1946).

f) Dods, Horizontal Tails, NACA TN 3497 (1955).

g) Dods, Swept-Wing Theory, NACA TN 2288 (1951).

[82] In the discussion of flap characteristics as a function of aspect ratio, derivatives considered are those at and around zero lift. At aspect ratios approaching zero, a

non-linear, “second” term of lift originates as a func­tion of the angle of attack or when deflecting a trailing – edge flap.

[84] Influence of foil section shape:

a) Lockwood, Beveled, NACA W Rpt L-666 (1944).

b) Jones, Beveled Trailing Edge, NACA WR L-464.

c) See Harper (18,d), Various Foil Sections.

d) Batson, 0015 Modified, ARC RM 2698 (1943).

e) Halliday, Rudder Moments, ARC RM 2184 (1941).

f) Sears, Flap and Tab, NACA WR L-454 (1942).

g) Toll, Surface Distortion, NACA TN 1296 (1947).

h) Toll, Lateral Control, NACA T Rpt 868 (1947)

i) Crane, Modifications, NACA T Rpt 803 (1944).

j) Hemenover, T’Edge Angle, NACA TN 3174 (1954).

k) Halliday, Boundary Layer, ARC RM 2730 (1955).

l) ARC, Flaps, RM 1996, 2008, 2256, 2506 (1942/45).

[85] Characteristics of flap-plus-tab systems:

a) For theory5see references (2,b) and (2,e).

b) For results, see references (4,b) and (4,d).

c) Harris, Moments due to Tabs, NACA T Rpt 528.

d) Wenzinger, Pressure Distrib., NACA T Rpt 374.

f) Bausch, Wing, Yearbk D. Lufo 1940 p.1-182.

g) Crandall, Correlation, NACA TN 1049 (1946).

h) Brewer, Balanced Tabs, NACA TN 1403 (1947).

i) 0015 with Flap and Tab, ARC RM 2314 (1943).

[87] For tab-chord ratios exceeding 0.2, interpola­tion by dC^/d^ V C|/Cj. would be better.

[88] Note that the hinge moment due to lift (at fixed flap angle) is not affected by a tab.

[89] Characteristics of linked-tab balance:

a) Harper, Tail Surfaces, NACA TN 2495 (1951).

b) Dunn, DC-6 Airplane Control Surfaces, Proc Internat Aeron Conf IAS/RAS, New York 1949.

c) Balancing Tabs, ARC RM 2510 (1941).

[90] Stiess, Influence of Linked-Tab Upon Stability and Control, Yearbk D. Lufo 1941 p.1-252.

[91] McKee, H’Tail Leading Tab, NACA WR L-702 Ц943).

[92] Characteristics of servo-tab control:

a) ARC, Rudders, RM 1105 & 1514 (1927/32).

b) Reid, Servo Control, J Aeron Sci 1934 p. 155.

c) Wright, Servo-Control, ARC RM 1186 (1928).

d) ARC, Servo Ailerons, RM 1262 (1929).

[93] Steering machinery including accessories of an ocean liner may weightwise be in the order of 20 tons. This much may only be 0.1% of the vessel’s displacement weight, however.

[94] Reid (38,b) reports that between 1921 and 1926 some 25 sea-going ships were equipped with servo-tab rud­ders. He also reports that between 1926 and 1934 a number of larger British airplanes were using servo rudders.

[95] Investigation of spoiler-type devices by the NACA :

(a) Weick, Rolling Moments Obtained, NACA IN 415 (1932).

(b) Weick, Ailerons and Spoilers, NACA T Rpt 494 (1934).

(c) Weick, Slots and Spoilers, NACA TN 443 (1933).

(d) Shortal, Location and Effects, NACA TN 499 (1934).

(e) Shortal, Slot-Lip Ailerons, NACA T Rpt 602 (1937).

(f) Sou(e, Flight Investigation, NACA T Rpt 517 (IS 35).

(g) Wetmore, Retractable Ailerons, NACA TN 714 (1939).

(h) Wenzinger, NACA TN 801 and T Rpt 706 (1941).

(i) Rogallo, Plug-Type Aileron, NACA Wr Rpt L-376 & 420 (1941).

(j) Spahr, Flight Investigation, NACA W Rpt A-28 (3943).

(k) Spohr, Flight Investigation, NACA TN 1123 (1947).

(l) Fishel, Location of Spoiler, NACA TN 1294 (19^-7).

(m) Deters, With Full-Span Flaps, NACA TN 1409 (1 947).

(n) Schneiter, On Swept Wing, NACA TN 1646 (19z-3).

(o) Fishel, Retractable Ailerons, NACA T Rpt 1091 (1952).

(p) Fishel, Collection of Data, TN 1404 (1948).

(q) Wenzinger, Lateral Devices, NACA TN 659 (1958).

(r) NACA, T Notes 1015,1245,1409,3705,4057.

[96] Differential-linkage balancing of ailerons:

(a) Weick, Rigged-Up Ailerons, NACA T Rpt 423 (1932).

(b) Differential Linkages, NACA TN’s 586 & 653 (1936/38).

(c) Differential Gearing, ARC RM 2526 (1940).

[98] The subscript n as in equation (16) indicates the vertical or normal axis of the airplane, about which the yawing moment is defined.

[99] Compensation for CDS, – Diehl (l, b) recommends a value of 0.15. The corresponding factor in equation 12 is 0.30.

[100] “Cross flow” and “upwash” are covered in connection with

Chapter IX on the “horizontal tail”, Chapter XII on “engine nacelles”, and Chapter XIX on “streamline bodies”.

[102] Contribution of fuselage to longitudinal moment;

a) Vandrey, Analysis, Yearbk D Lufo 1940 p 1-367.

b) Jacobs, 209 Combinations, NACA T Rpt 540 (1935).

c) Sherman, Interference of Wing-Fuselage Combinations, NACA T Rpt 575 (1936); and TN 1272 (1937); see also TN 641 & 642 (1938) for special junctures.

d) Liebe, Theoretical Analysis, Ybk D Lufo 1942 p 1-280.

e) Moller, Ybk D Lufo 1942 p 1-336; also ZFW 1953 p 2.

f) Yates, Flying Boat Hulls, NACA TN 1305 (1947).

[103] See “Fluid-Dynamic Drag”, Chapter VIII, under “induced interference drag”.

[104] Influence of wing shape on downwash:

a) Crowe, Tapered Wings, Aircr Engg March 1937 p 59.

b) Muttray, Cut-Out, Lufo 1935 p 28 (NACA TM 787).

c) Schulz, Plan-Form Analysis, Lufo 1942 p 367.

[105]

[106] Interference of wing wake upon horizontal tail:

a) Ruden, Study, Ybk D Lufo 1939 p 1,98 & 1940 p 1,204.

b) Walter, Interference, J Aeron Sci 1938 p 300.

c) White, Wing-Fuselage Interference, NACA T Rpt 482 (1934).

d) Lieblein, Wake Characteristics, NACA TN 3711 (1956).

e) Spence, Wake Behind Foil, ARC CP 125 (1952).

f) See Silverstein in NACA T Rpt 651 (17,d).

[107] Ankenbruck, Comparison of Performance, Conventional/- Tailless/Tail-Boom, NACA TN 1477 (1947).

[108] Underslung Engines – V/ing Augmentation:

a) Parlett, Wind-Tunnel Test Jet Transport with External – Flow Jet Flap, NASA TN D-6058.

b) Powers, Experimental STOL Configuration with Ex­ternally Blown Flap Wing or Augmentor Wing, NASA TN D-7454.

c) Patterson, High-Bypass Engine Wing-Nacelle Interference Drag, NASA TN D-4693.

d) Parlett, STOL Model with Externally Blown Jet Flap, NASA TN D-7411.

e) Zabinsky, STOL Designs for NASA Short Haul Transport Study, NASA SP-116, P-339.

[109] Influence of propeller slipstream on downwash:

a) Stuper, Slipstream on Tail, Lufo 1938 p 18.1 (NACA TM 874).

b) ARC, Downwash in Slipstream, RM 882 (1924).

c) Katzoff, Slipstream Effects, NACA T Rpt 690 (1940).

d) Helmbold, Airplane Model, Lufo 1938 p 3.

e) Muttray, Distribution, Lufo 1938 p 109 (NACA TM 876). (12) Downwash behind isolated propellers:

0 In biplane configuration, ARC RM 1488. a) Glaurert, ARC RM 882; see Durant IV p 357.

g) Goett, Pitching Moments, NACA W’Rpt L-761. b) Turin, Experimental, J Roy A Soc 1936 p 388.

[110] Influence of single propeller on stability, experimental:

a) Goett, Tilted-Engine Axis, NACA T Rpt 774 (1944).

b) Priestley, Fighter Airplanes, ARC RM 2732 (19.53).

c) Recant, Pursuit Model, NACA W Rpt L-710 (1942).

d) Weil, Curtiss BTC-2, NACA W Rpt L-667 (1944).

e) J Aeron Sci, High Wing, 1936 p 73; Low Wing, 1937 p 411.

f) Wallace, Influence on Low Wing, NACA TN 1239 (1947).

g) Purser, Unsymmetrical Horizontal Tail, NACA TN 1474 (1947).

[113] Airplane models with running propeller:

a) Stuper, Collection of Data, Ringb Luftf Technik IA12 (1939).

b) He-70 and AR-196, tested at AVA, are included in (a).

c) Hoerner, “Fi-157” in DVL Tunnel, Fieseler Rpt April 1937.

d) Weil, 29 Configurations, NACA TN 1722 (1948); T Rpt 941.

[115] Contra-rotation in twin-engine airplanes:

a) Engines or propellers rotating in opposite directions are undesirable with respect to fabrication and number of spare parts to be kept available.

b) Seiferth, In Wind Tunnel, Ybk D Lufo 1938 p 1-220.

c) Stiess, Do-17 in Flight, Ybk D Lufo 1938 p 1-206.

(1938).

[117] Directional characteristics of engine nacelles:

a) Fournier, “Exotic” Configuration, NASA D-217 (1960).

b) Pabst, FW-200 Airplane, Focke Wulf Wind-Tunnel Rpt 41

[120] Lateral stability and control characteristics:

a) Schlichting, Interaction Between Wing Fuselage and Tail Surfaces, Ybk D Lufo 1943 Rpt IA028.

b) McKinney, Lateral Stability, NACA TN 1094 (1946).

c) Maggin, Swept Model Flight Tests, NACA TN 1288

(1946).

d) Michael, Fuselage V’Tail Interaction, TN 3135 (1954).

[121] Sidewash induced by wing and fuselage:

a) Bamber, Wing + Fuselage + Fin, NACA TN 730 (1939).

b) House, Wings Fuselages Fins, NACA Rpt 705 (1941).

c) Recant, Side Flow at V’Tail, NACA TN 804 & 825 (1941).

d) Schlichting, Wing & Fuselage, Ybk D Lufo 1941 p. 1-300.

e) Sweberg, Load on V’Tail, NACA W’Rpt L-426 (1944).

f) Goodman, Wing and H’Tail, NACA TN 2504 (1951).

[122] Characteristics of “V” tail surfaces:

a) Purser, Simple Vee-Tail Theory, NACA T Rpt 823 (1945).

b) Schade, Isolated Vee-Tail Surfaces, NACA TN 1369

(1947) .

c) Polhamus, Airplane with Vee Tail, NACA TN 1478

(1947).

[123] Twin-engine airplanes, flight-tested:

a) Sjoberg, Douglas A-26, W’Rpts L-606, 607, 608 (1945).

b) Crane, DeHavilland “Mosquito”, W’Rpt L-593 (1945).

[124] That difference can be important, however, when considering larger angles of attack, such as in stalled and/or spinning conditions.

[125] Tunnel-tested characteristics of straight wings:

(a) Bamber, Plan Forms, NACA TN 703 & 730 (1939).

(b) British ARC, Reports RM 394, 1059, 1203, 2019.

(c) Blenk, Dihedral Sweep Twist, Lufo 1929 p 27.

(d) Zimmerman, Small Aspect Ratios, NACA TRpt 431 (1932).

(e) Shortal, Shape and Dihedral, NACA TR 548 (1935).

(f) Doetsch, 6-Component, Yearbk D Lufo 1940 p 1-62.

(g) AVA Gottingen, results. quoted by Seifirth (5,d).

(h) Moller, Rectangular Wings, Lufo 1941 p 243.

(i) Results from AVA Gottingen, see (5,d).

(j) Hansen, Elliptical Wings, Ybk D Lufo 1942 p 1-160.

.(3) The smallness of the lateral forces is also the reason for the scatter of the experimental points in figure 3.

[126] Influence of wing flaps on lateral characteristics:

(a) Teplitz, Configuration w’Flaps, NACA TR 800 (1944).

[127] Lateral characteristics of wing-fuselage configurations:

(a) Moller, 6-Component Results, Ybk D Lufo 1942 p 1-336.

(b) Bamber, Wing, Fuselage & Fin, NACA TN 730 (1940).

(c) Schlichting, Review of Subject, Ybk I) Lufo 1940 p 1-113.

[128] Lateral Stability Theory:

(a) Babister, A. W., Aircraft Stability and Control, Pergamon Press 1961.

(b) Stemfield, L., Dynamic Stability, NACA University Conf 1948.

(c) Perkins & Hage, Airplane Performance Stability and Con­trol, John Wiley & Sons,’ 1949.

(d) Campbell & McKinney, Calculating Methods Dynamic Lateral Stability, NACA TR 1098.

[129] Predicting spanwise loading of swept wings:

a) Weissinger, Original Method (1940), NACA TM 1120.

b) Multhopp, Lifting-Surface, Brit RAE Rpt Aero 235 3.

c) Schneider, Comparison/Experiments, NACA Rpt 1208.

d) Kuchemann, Calculated Distribution, ARC RM 2935.

e) Toll, Stability Derivatives, NACA TN 1581.

0 DeYoung, For Arbitrary Plan Form, NACA Rpt 921.

g) Van Dorn, Comparison of Methods, NACA TN 1476.

h) Falkner, On 3 Wings A = 6, ARC RM 2596 (1952).

[130] The function for sharp rectangular wings as described in the text, corresponds to a – 0.9 and ^b/c = 0; while that for “round” wings is obtained for a = 0.9, (дЬ/с) =-0.2, and ДЬ/с = -0.2/ &1 + 2/A3 , while дЬ/Ь = (ДЬ/с)/А and к = f(“A”) as in figure 1, where A • = A + ab/c. Note that the latter line ends below A = 1 in a constant lift ratio of 0.8 as against that of the sharp-rectangular wings.

a 1 U

[132] 5 6

Figure 19. Correction to Prandtl-Glauert compressibility equa­tion for aspect ratio.

Where M i_ B is the Mach number where the force break occurs and M L m is the Mach number at the

minimum lift slope. The reduction in slope at M |_ m is a function of thickness and aspect ratio and can be estimated using figure 22. It is noted that when the thickness ratio of the wing is below 5% low aspect ratio wings do not exhibit a reduction in lift slope.

[133] Analysis considering delta wing vortex formation:

a) Legendre, Recherche Aeronautique No. 30, 31. 35 (1952/53).

b) Brown, “Separation”, NACA TN 3430 and J Aeron Sci 1954 p 690.

c) Chang, Non-linear Lift, J Aeron Sci 1954 p 212.

d) Jones, NACA T Rpt 835 (1946); also J Aeron Sci 1951 p 685.

e) British Efforts, ARC RM 1910, 2596, 2819, 3116.

f) NACA, Wing Theory, T Rpts 921 & 962 (1948/50)

g) Lomax, Slender Wing Theory, NACA T Rpt 1 105 (1952).

The coefficients

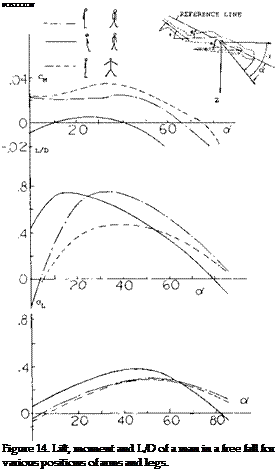
CL = L/qS, CD = D/qS, and CM = M/qS 1 where S is the area based on the man’s height Л and shoulder width. The reference length noted in the mo­ment equation is the height. The wind tunnel test results are given on figure 14 for the man in the best position to give peak L/D as well as other typical positions of possible interest.

Based on the drag the effective aspect ratio is about one half the apparent value. The lift curve corresponds to the function 1.6 sin2o^ cosa. This value is somewhat less than would be predicted in Chapter XIX.

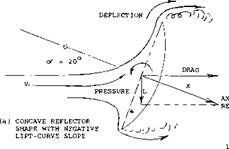
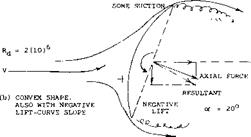
Radar Screens. Radar screens are structures similar in aerodynamic shape to parachutes. They are usually very porous; that is, their solidity ratio is small (for exampe, in the order of 40%). However, the parabolic reflector shown in figure 15 is solid.. As a function of the yaw angle/3 (measured against the center axis of the circular screen) maximum forces correspond to the coefficients (based on total fontal area, at $ = 0).

Подпись:CDo =1.08 at /3= 0°

CYo =-.41 at /$= 40°

The lateral force is negative in comparison to a positive angle of yaw. Considering flow in the opposite direction (against the convex side) maximum values are

CDo

= 0.85

о

о

и

75

О

-<

о

= – .14

at /3 = 30°

The lateral force is negative again, evidently on account of negative “base” pressure and some suction, as indicated in the illustration.

The coefficients

(8) Characteristics of “cups” and “caps”:

a) See in Chapter XIII of “Fluid-Dynamic Drag”.

b) Hansen, Sheet-metal Caps, AVA Gottingen Ergebnisse Vol IV (1932).

c) Breevort, Forces on Anemometer Cupt, NACA TN 489 (1934).

d) Doetsch, Sheet-metal Parachute Models, Luftf’Forschg 1938 p 577.

e) Babish, Two-dimensional Flow Pattern, FDL-TDR-1964-136, AD-461,342.

(9) Lateral forces and stability of parachutes:

a) See references in Chapter XIII of “Fluid-Dynamic Drag”.

b) Niccum, Cross-type Parachutes, U/MinnRpt FDL-TDR-1964-155, AD-460, 890.

(10)Experiments with steerable parachutes:

a) Gamse, Parachutes With “Flaps”, NASA TN D-1334 (1962).

b) Kinzy, Gliding Parachute, Northrop Venutra Rpt 2818 (1960).

c) Riley, Glding & Turning, Northrop Rpt FDL-TDR-1964-81, AD-453, 219.

The coefficients

Figure 15. Forces on a reflector “dish”, tested (12,b) at o’ = 20° , both with the concave and the convex side ahead.

(11)Wind Tunnel test on human beings:

a) Oehlert, Trajectory Control, Parachutist in Free Fall, Wichita State Univ, Report AR 67-1 (1967).

b) Schmitt, Air Loads on Humans, David Taylor, Report 892, Aero 858 (1954).

Half Sphere. When reversing the direction of flow against a “cap” we obtain the flow pattern around a half sphere, as in figure 16. Drag and lift coefficients are plotted in polar form. The lift-curve slope is negative; between (+ and —) 10 (in the definition as shown) it is found:

dCLe/dcy° =-0.01 (8)

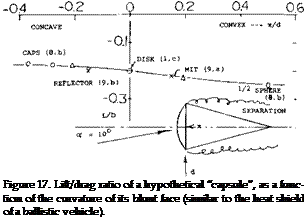
Подпись: Figure 17. Lift/drag ratio of a hypothetical “capsule”, as a function of the curvature of its blunt face (similar to the heat shield of a ballistic vehicle). Lift also remains negative up to angles above 85* The moment around oc = 0°, about the center of the sphere, is given by
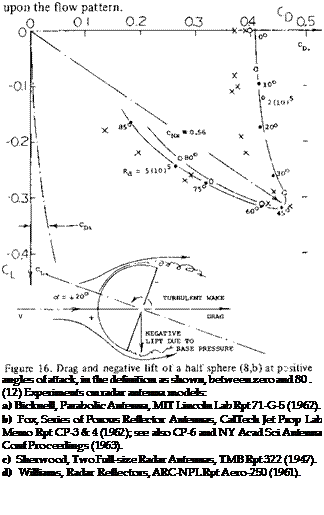
dCmd/d</ =-0.0007 dCmd/dCL =+0.700

Lift and moment are thus “unstable”. Drag may corre­spond to CD = 0.4, plus Cp; = C^/trA = C /4. For practical purposes CD =0.4 for ex’ between (+ and —) 20c.. The open cup (hollow half sphere) also plotted in figure 16 shows somewhat different coefficients, in particular less drag at of between + 20 and —20°. Besides the open base (bottom) the Reynolds numbers is likely to have an effect

Подпись: angles of attack, in the definition as shown, between zero and 80 . (12) Experiments on radar antenna models: a) Bicknell, Parabolic Antenna, MIT Lincoln Lab Rpt 71-G-5 (1962). b) Fox, Series of Porous Reflector Antennas, CalTech Jet Prop Lab Memo Rpt CP-3 & 4 (1962); see also CP-6 and NY Acad Sci Antenna Conf Proceedings (1963). c) Sherwood, Two Full-size Radar Antennas, TMB Rpt 322 (1947). d) Williams, Radar Reflectors, ARC-NPL Rpt Aero-250 (1961).

Gliding. Satellite capsules such as those developed in the United States (7) can al so be steered when re-entering, in longitudinal and/or lateral direction, by means of the high pressure forces on their blunt heat shield. This happens at supersonic speeds; the principle is the same, however, as in figure 15,b. Some kind of diving capsule could also be designed to be used in deep water. The gliding angle could be controlled either by shifting a weight inside, or by adjusting the angle of attack (against the water with the help of a flap, for example). Some (L/D) values are plot­ted in figure 17. This value is approximately proportional to the angle of attack as against the body axis. There would be a limiting angle, however, where the flow gets attached to one side of the afterbody assumed to be conical. It should also be noted that with the CG behind or above the blunt front end, vehicles of this type are likely to be stable.

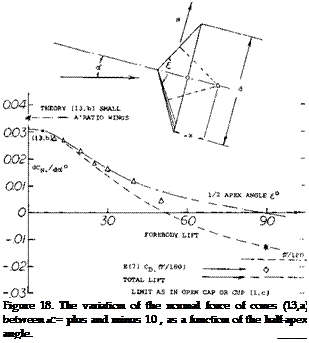
Cones. In a manner similar to the lift of the wedges in figure 10 the normal-force derivative of cones (with their point against the wind) reduces as the cone angle is in­creased. The experimental data plotted in figure 18 have been extended. For small cone angles, equation (3) in (12,b) can be applied. At t = 90 , we have a thin disk as in (7,e). Its force normal to the axis is zero. The center of forebody pressure is roughly obtained as indicated in the sketch. It moves from x/d = 0.97 (ahead of the base) for £ = 10°, to —0.47 (behind the base) fort = 50°. In reality, the cones also have a negative base pressure, contributing to drag, and providing a negative component of lift (at right angle to the direction of the wind) similar to that in figure 10 at larger angles.

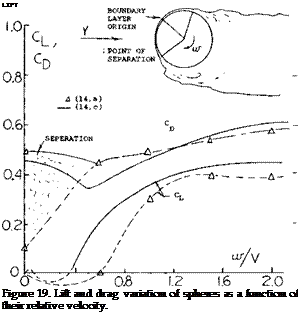
Rotating Spheres. The motion of spinning tennis, golf and base balls show that lateral forces are developed that cause them to curve in flight. For instance, it has been shown (14,b) that a regulation baseball as used in the National or American Legues which weighs between 5 and 5lA ounces and is 9 to 9lA inches in circumference will move as shown

speed

V

= 100 ft/sec

spin

n

= 1200 rpm

distance

X

= 60 ft

“curve”

У

= 1 foot

Подпись:Подпись:The spin of 1200 rpm means a speed ratio of w/V = 0,15. The speed corresponds to a Reynolds number based on diameter of Rj = 5.7(10)b which would result in a Row pattern above the critical.

Test data (14,a, c) on the lift and drag coefficients meas­ured on smooth rotating spheres is given on figure 19. These data essentially confirm the results-given in “Fluid Dynamic Drag” and show a CLx of between 0.4 and 0.45.

As in the case of a rotating cylinder, the lift and drag coefficiens are dependent on the rotational speed ratio w/V. This ratio is important as it effects the separation on the cylinder and thus the lift. Since the lift is dependent on the separation points on the upper and lower surfaces it would be expected that surface roughness and Reynolds number would effect the results. Qualitative data is not available for an evaluation.

Подпись: Figure 18. The variation of the normal force of cones (13,a) between oC = plus and minus 10 , as a function of the half-apex angle.

Normally when considering the forces acting on ground vehicles the drag force is of primary concern, as this ef­fects the power required. The variation of the drag force of representative vehicles with variations of shape are cov­ered in “Fluid-Dynamic Drag” and (15,a). The lift forces produced by a vehicle can be important, especially if we consider the side force to be lifted as in the case of a vehicle operating in a cross wind. In this case, the side force will effect the stability and handling characteristics of the vehicle.

(13) Lifting characteristics of cones moving point-first:

a) Owens, Large of Cones M = 0.5 to 5.0, NASA TN D-3088 (1965).

b) See results in the “wing and body” chapter.

(14) Lateral forces on revlolving spheres:

a) See “Drag Due to Lift” in Chapter VII of “Fluid-Dynamic Drag”.

b) Briggs, Deflection (curve) of a Baseball, NBS Rpts 1945 and later, NY Times “Sports” 29 Mar 1959.

c) Niccum, Lift and Drag of a Rotating Sphere, Dept of Aero & Mech, U of Minn. 1964.

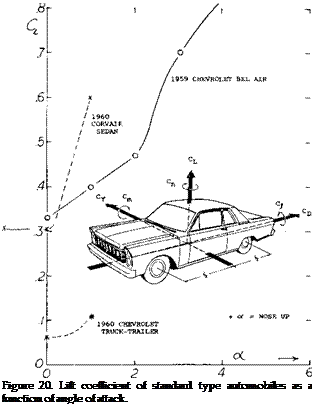
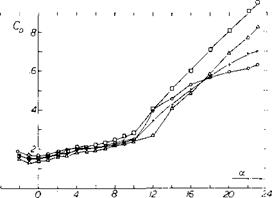
Automobile Lift. The lift coefficient of the conventional passenger car is given on figure 20 as a function of angle of attack. Here, the lift force, L, is that tending to de­crease the weight of the vehicle on the road

Cu=WqSf (10)

where Sf is frontal area of the car.

Even at an angle of attack of zero automobiles have a positive lift coefficient of 0.3. This is due to their basic shape, which is effectively cambered. The lift curve slope is high and shows the importance of ground effect. Al­though the lift coefficients for the automobile are high, the actual lift is very small in comparison with the weight of the basic car. For instance, even at 90 MPH and a lift coefficient of 1.0 the actual lift force is only of the order of the weight of one passenger. This is small considering automobiles in the 3 to 4Q00 weight class.

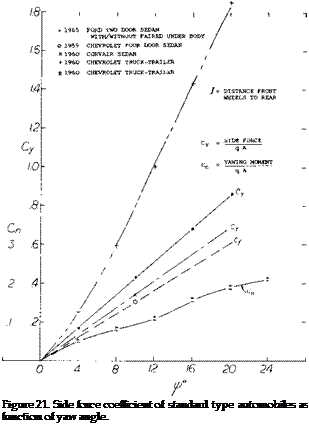
The more important lift force on an automobile is that produced in a cross wind. Although the side force co­efficient is the same order of magnitude as the lift force, figure 21, it is more significant as it will effect the direc­tional control of the car. It should also be noted that the actual lift coefficient of the car increases with yaw angle. An increase up to 0.5 due to a yaw of 25° (15,c). The importance of the side force is due to the variation of the force due to sudden changes. For instance, when operat­ing a light weight car or trailer in a cross wind, the passing of a large truck can cause a sudden side force change of 50 to 200 pounds. This can cause sudden unwanted direction change, which can be dangerous. Thus, automobile shapes which minimize the side force are desirable. The large side force produced by trucks causes a side-wash change in the direction of the air, which is also a safety problem.

(15) Ground vehicles lift and side force:

a) Turner, Automobile Test Moving-belt, NASA TN-D-4229.

b) Flynn, Truck Aerodynamics, SAE Preprint 284A, 1961.

c) Подпись:Подпись:Whitcomb, Aero Forces on Critical Speed of Automobiles, CAL Report No. YM-2262-F-1 (1966).
THREE-DIMENSIONAL DRAG BODIES

Among drag devices in three-dimensional flow, parachutes in particular are gaining more and more importance as decelerators for high-speed vehicles.

Plates. Since the invention of sails and kites, and certainly since Newton (1643-1727), flat obstacles were known to have a force normal to the drection of the wind, which we now call “lift”. The normal forces of disk and a square plate are shown in Chapter III of “Fluid-Dynamic Drag” up to angles of attack of 90 . The coefficient is constant between of = 50 and 140°; thus CN = 1.17 and CL = 1.17 cosof, which reduces to zero at ctf =90°. Lift fluc­tuations, while irregular, are not as severe as those of cyl­inders or plates in two-dimensional flow. The lateral-force or lift derivative of rectangular plates (6) around о = 90 is negative; it varies with aspect ratio and camber, as fol­lows:

Aspect Ratio

Camber

CD

dCL Idol

0.2

flat

1.20

-0.025

1.0

flat

1.16

-0.021

5.0

flat

1.20

-0.023

5.0

10%

1.22

-0.029

It might be expected that the value of the derivative corre­sponds to the drag coefficient. As pointed out in (10,c) the lift-curve slope of flat “wings” around of = 90° may approximately be

dCL Idol =-CD = (ТГ/180) CD (7)

where of first in radians, and Cp^ = drag coefficient on frontal area. The results tabulated above show lift deriva­tives some 10% higher. Camber (10%, with the concave side against the wind) increases the lateral force con­siderably. This may be a consequence of shape, rather than drag.

THREE-DIMENSIONAL DRAG BODIES

THREE-DIMENSIONAL DRAG BODIES

THREE-DIMENSIONAL DRAG BODIES

Figure 11. Lift and drag variation of bodies of revolution for range of diameter to length ratio and leading edge radius ratio.

Bodies of Revolution. The lift of bodies of revolution with a blunt nose for length diameter ratios from.5 to 2.0 (7,d) show an increase in lift slope with increasing length, figure 11.

Here

C l_a = L/q A

where A is the maximum cross section of the model TT’d2/4. This trend is opposite to that expected based on the aspect ratio for rectangular wings, Chapter XVII, and illustrates the importance of 2 о( flow discussed in the streamline body chapter. For nose radius ratios of.05 to.2,dC /do is essentially constant. For the body with an jP/d of 0.5 the small nose radius ratio of.05 gives CL = -.2 throughout angles of attack range. For the low nose radius ratio of 0.05 and X/d of 1.0 negative values of lift are also obtained. Increasing to {/d to 1.5 and above re­sults in a positive lift as with the very blunt leading edge. Effects of other leading edge shapes on finite bodies revo­lution are given in Chapter XIX.

(7) Blunt ballistic reentry vehicles:

a) Satellite Capsules, see Chapter XVIII of “Fluid-Dynamic Drag”.

b) Phillips, Blunt-faced Around ot = 90°, NAsa TM x-315 (1960).

c) Mugler, Lenticular Vehicle, NASA TM X-423 (1960).

d) Hayes, Effects of Nose Bluntness, Fineness Ratio of Bodies of Revolution, NASA TN D-650.

e) Flachsbort, Disk and Rectangular Plates, AVA Gottingen IV (1932).

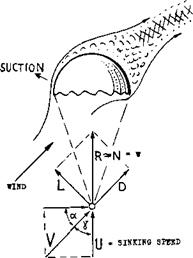
Parachutes Parachutes of the old and simple type (a fabric canopy with a man hanging underneath) were not really stable. Depending upon shape, porosity and dynamic con­ditions (mass, size, speed, Froude number) they had a tendency of moving in an irregular pattern of swinging, coning, circling and gliding. Lift and drag coefficients of half-spherical sheet-metal models (8,b, c,d) are plotted to­gether in (8,a). When using these “caps” as parachute canopies, a configuration as in figure 12 is obtained. At angles of attack (wind against the plane of the rim) be­tween 70 and 100 the lift coefficient CL. (in any direc­tion normal to that of the wind) varies between plus and minus 0.6. The lift-curve slope is negative:

dCL /dof° = -0.024

Assuming that man or load be the center of gravity of the configuration, the negative lateral-force derivative as in the equation, readily explains that the system is not stable statically. In aerodynamic language, the moment deriva­tive (dCm/dCL) is positive. The same goes for a drag chute as they are used to decelerate high-speed airplanes after touching ground when landing. However, since the man below a parachute descending through the air begins to move sideways as soon as the canopy assumes an angle of deflection, a complicated system of dynamic stability is set in motion involving mass and damping of man and canopy. On top of it the flow pattern in the wake of the parachute is not steady. It exhibits fluctuations of pres­sures and directions, at irregular frequencies. The only stable position at which the parachute might arrive is as in figure 12. At angles of attack between 40 and 50° the flow gets around the leading edge, thus producing suction and a maximum lift coefficient in the order of —1.2. It should be noted that V is larger than the sinking velocity U, and that the resultant force is larger (1.6) than the original drag (1.4). To say it in different words, the para­chute is stably gliding, approximately at an angle of 45 corresponding to a ratio (L/D) = 1.

THREE-DIMENSIONAL DRAG BODIES

Figure 12. Sketch of flow pattern and forces acting upon a parachute when gliding; see also Chapter XIII of “Fluid-Dynamic Drag”.

CIRCLE USED TO DEFINE THE SOLIDITT RATIO OF 42*

CIRCLE OF EQUAL AREA,

DEFINING THE NOMINAL DIAMETER d ** 1.16 ft

/ /

Steerable Parachutes. Parachute jumping has been de­veloped with skydiving to the point where an experienced jumper can land within a one-meter circle from 1000’s of meters of altitude. The parachutes used for this purpose are steerable by means of an open sector (gore). The open­ing causes gliding; the rate of gliding depends upon the size of the opening. An adjustment of the two gore edges against each other makes the parachute turn. Both of the motions are controlled by the “pilot” with the help of his arms and hands through a pair of lines. The cross-type parachute as in figure 13 could also be steered by control­ling one of the four gores. However, while one of these schemes (10,a) provides only a maximum L/D = 0.6, a more complicated configuration was developed (10,c) hav­ing an L/D ratio of 2, which is twice as high as found in optimum single-canopy designs. What we really have in this parachute is an inflated wing (Anade out of cloth) with an aspect ratio in the order of 2. Such devices are dis­cussed in Chapter XVII.

Cross Parachute. The basic fluctuations of the wake and the instability of a parachute can be minimized by porosity of the canopy (using more or less loose fabric or a net­work of ribbons). Another way is shown in figure 13. The cross shape (9,b) gives the wake a regulated pattern. The moment coefficient C mo is based on developed cloth area S0 and the nominal diameter dc = S0/tT, derived from So = do TT /4. Sufficient stability about the point as in the illustration is obtained with some 30% of geometric solidity (ratio of material to open areas, “inflated” condi­tion). The derivatives are then

dCmo/doT

= -0.011

forCDo

= 0.840

0

О

>-

U

чз

= +0.007

^mo /

= -0.160

where Y indicates the lateral force in the canopy. This state of static stability discontinues, however, at (plus and minus) 15° away from the position corresponding to straight and vertical sinking.

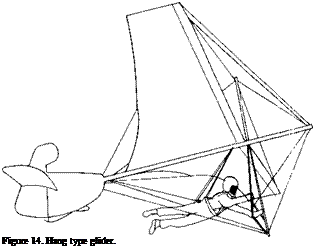
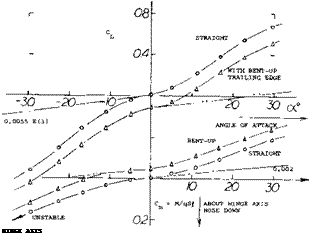
Man in Free Fall. The forces and moments of a para – chutsist in free fall have been determined from wind tun­nel tests (ll, a,b). These tests indicate that during “sky diving” trim is obtained only at fairly high values of angle of attack, which appears to agree with the actual results. At these high angles the best L/D of approximately 0.61 is obtained at an angle of attack of 40 ro 45 with the arms along side of the body, the legs spread at an angle of 16 and the legs bent at the hip so as to give the body camber with a negative angle with respect to the back of approxi­mately 60°, figure 14. At this condition the lift coeffi­cient is approximately 0.35. The lift drag ratio for the trimmed condition is 0.55.

LIFT OF BLUNT BODIES

Lift can be developed on bodies with blunt shapes that have no resemblance to wings. In this case the lift on the bodies is defined as that force acting normal to the direc­tion of the relative wind motion. Any lateral force may then be considered to be a lift force, although in the strict sense the force is side force. Since these forces are of interest in the design of land vehicles, they are included in this chapter.

1. IN TWO-DIMENSIONAL FLOW

Any structural beam or cylindrical elements (cables, pipes for example) exposed to wind, or in water, will usually react as in two-dimensional flow.

Flat Plate. A flat plate produces lift like an airfoil or wing when at small angles of attack. Long before reaching о = 90 the flow is completely separated, however. A review of forces and pressures in this condition is given in (l, a). According to theory the normal force on the forward, side of the plate is given by the coefficient

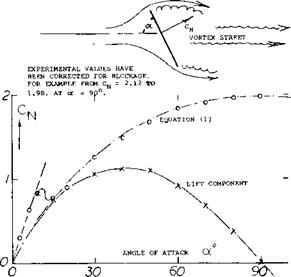
CN = 2 rrsinof/(4 + rfsinof) (1)

This average pressure and its variation is of interest in stalled airfoil sections and in cavitating flow. At a’ == 90 the result is CN =0.88. However, in real flow there is a negative rear-side pressure Cp = —1.1, so that the total drag coefficient is 1.98, as found in Chapter III of “Fluid – Dynamic Drag”. On the basis of tests (l, b) it is suggested that the value of the rear-side Cp varies in the same man­ner as the forward-side normal force. Multiplying equation (1) by (1.98/0.88) = 2.25 = (9/4), the following equation is found:

1/CN = 0.222 + (0.283/sinoO (2)

(1) Flat plates with separated flow pattern:

a) Wick, Inclined Plate Bewteen Walls, КАСА TN 3221 (1954).

b) Fage, Experimental Between Walls, ARC RM 1104 (1927); also Proceedings Royal Society London Vol 116 (1927).

c) Flachsbart, Disk and Rectangular Plates, Erg AVA Got­tingen IV (1932).

This function, plotted in figure 1, agrees well with experi­mental points. Splitting up the normal force in drag and lateral or lift components, CL = coso is obtained. Around of = 90° (that is between 80 and 100 ) the “lift”-curve slope is negative:

(dCL /dotf )& — Cq& —2/rad; — 0.035 per degree (3)

where 2 ~ 1.98, as above, and the second value per de­gree. It must be realized, however, that all these forces are by no means steady. Because of a Karman-type vortex street (discussed later in connection with circular cyl­inders) drag and particularly lift are fluctuating around the mean measured values. As shown in “Fluid-Dynamic Drag”, pressures and forces also decrease considerably when the aspect ratio of the plate is reduced from infinity to say below A = 10. Around a = 90 they are then similar to those of a square plate or disk, to be discussed later.

LIFT OF BLUNT BODIES

Figure 1. Normal force and lift component of a flat plate in two-dimensional How (equation 1) and as tested between tunnel walls.

Circular Cylinders. The flow characteristics around cir­cular cylinders are given in Chapter II in conjunction with the explanation of circulation. At Reynolds numbers be­low = 10 , the flow pattern past cylindrical elements such as cables, pipes, periscopes, smoke stacks and even rocket vehicles on their launching pads is that of the well – known Karman vortex street; see Chapter III of “Fluid – Dynamic Drag”. Corresponding with the wake swinging up and down (or from one side to the other) there is a fluctuating lifting or lateral force in the cylinder. In fact, the vortex street originates because of a circulation around the cylinder, alternating between the two possible directions, once right or up and once left or down, respec­tively. As reported in (2,d) the point of separation fluctu­ates between 60 and 150*, measured on the circum­ference, from the ideal forward stagnation point that is roughly by (+ and —) 45 around an average point. The maximum of the lateral force Су is in the order of (+ or -) 1.0 in this example, while CD varies by (+ or —) 0.1. The Strouhal number is

(a)


LIFT OF BLUNT BODIES

LIFT OF BLUNT BODIES

LINE, AND MINIMUM AT THE TOP OF EACH AMPLITUDE.

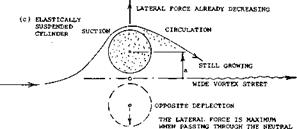
Figure 3. Sketches, showing the flow pattern around a circular cylinder (at R’numbers between 104 and 10s) under three differ­ent conditions.


S = fsD/V (4)

Where fs is the frequency of vortex shedding, D is the cylinder diameter and V the free stream velocity.

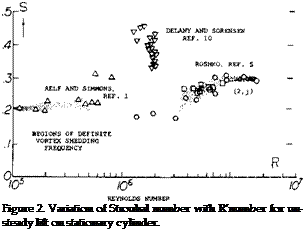
The frequency of vortex shedding is dependent on the Reynolds number for a stationary cylinder, no lateral mo­tion, and varies between 0.2 and 0.3 as illustrated on fig­ure 2. At Reynolds numbers between 6 x 10⁵ and 4 x 10⁶ there appears to be a region where the vortex shedding frequency is not definite (2j) with much higher values of Strouhal numbers obtained. Measurement problems may have led to the high values shown on figure 2 at R = 10


LIFT OF BLUNT BODIESLIFT OF BLUNT BODIES

LIFT OF BLUNT BODIES

Подпись:Unsteady Lift. Although the steady state lift on a non­rotating cylinder is zero, the vortex shedding leading to the Karman vortex street results in an oscillating lift force. If all the vortex-street circulation were developed without skin friction theory (2,b) predicts a maximum transient force coefficient of +3.6. For a fixed cylinder, part (a) figure 3, operating between Rd = 10^ to 10s the force coefficients reported are
Су = + 0.6 to 1.3

CD/ = .05 to.10

and the Strouhal number is S = .205 = C.

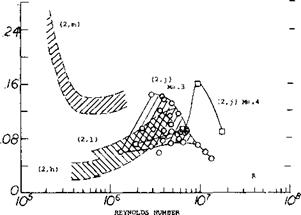
The RMS lift coefficient CLl rms(0; for cylinders with no lateral motion is on figure 4 as a function of Reynolds number. This unsteady lift or side force can, depending on the natural frequency of the structure, cause lateral mo­tions which will produce further force changes.

CL, rms (0)

LIFT OF BLUNT BODIES

Figure 4. Unsteady lift coefficient on stationary cylinder.

Lateral Motion. The unsteady lift force on an elastically suspended cylinder as a result of lateral motion can either be stabilizing or destabilizing depending on the Strouhal number (2,c). The unsteady lift due to cylinder motion will increase with the motion when the cylinder is operat­ing at a frequency near the Strouhal frequency for the stationary cylinder, figure 2. Below the Strouhal number for the stationary cylinder the unsteady lift force is de­stabilizing; while above, the unsteady lift force is stabiliz­ing. Thus, if the natural frequency of the cylinder and its mounting is above the Strouhal number, the system will be aerodynamically damped.

Laateral motions (vibrations) of cylinders are caused by the force fluctuations discussed above, and these motions in turn amplify transient circulation and lateral forces. The amplitude of the vibrations is then maximum under conditions of resonance. As suggested in (2,f) drag may correspond to the ratio (d + 2a)/d, where a = value of the half amplitude of displacement, as indicated in part (c) of figure 3. As reported in (2,1) the lateral coefficient may, for example, increase from Cy* = 0.5 to 1.0 when the cylinder displaces itself by a = (+ and — )d.

Splitter Plates. As indicated in “Fluid-Dynamic Drag” splitter plates behind the cylinder will reduce the drag. Tests (3,c) have shown that splitter plates also reduce the unsteady lift and the transverse oscillations. This occurs as the strength of the shed vortices and their frequency are reduced, figure 3. Test showed that a splitter plate with a chord equal to the diameter of the cylinder to be effec­tive.

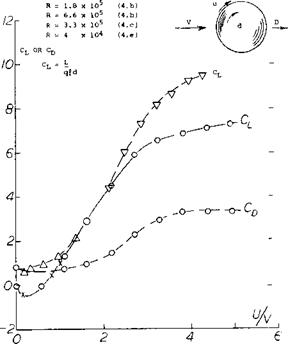
Magnus Force. By rotating the cylinder about its axis the boundary layer that causes the periodic separation dis­cussed above is changed. If the stream is moving from left to right and the cylinder is rotating in the clockwise direc­tion, separation is delayed on the upper surface while the lower side of the cylinder separation occurs earlier, figure

5. As a result of the cylinder rotation the velocity is much higher on the upper surface, thus giving a lift force. This lift force would be expected to vary with the relative rotational speed of the cylinder, the free stream velocity and the Reynolds number. At a U/V equal to 4 the stagni – tation point front and rear coincide and theory (4,a) in­dicates that in two dimensions the lift per unit length is

L = 4irqd (5)

where d is the cylinder diameter and q the dynamic pres­sure.

Equation 5 leads to

CL =4tr

As noted in figure 1, Chapter IV this is the ideal maxi­mum lift coefficient in two dimensional flow.

Experimental results of tests with rotating cylinders are given on figure 5 for a range of Reynolds numbers. These data indicate that after the rotational to forward speed ratio exceeds.0 the lift increases linearly up to a speed ratio of 3.0. Above this ratio the cylinder does not appear to stall in the sense that it loses lift. In the critical Rey­nolds number range of 10? to 5 x 10⁵ the data of (4,c) indicates a negative magnus lift. This occurs at a low speed ratio of 0.2 and appears to be caused by a bubble on the lower surface which reattaches resulting in negative lift.

(2) Circular cylinders, vortex streets, fluctuating forces:

a) Cylinders, Smoke Stacks, Cables, Power Lines; Chapter IV “Fluid-Dynamic Drag”.

b) Landweber, Analysis of Lateral Forces, TMB RPT 485 (1942).

c) Gerrard, Evaluation of Various Results, AGARD Rpt 463 (1963); AD-431, 328.

d) Drescher, Transient Pressures, Z. Flugwissenschaften 1956 page 17.

e) Macovsky, (Periscope) Vibrations, TMB RPt 1190 (1958).

f) Boorne, Vibrations of Tall Stacks, IAS Paper 851 (1958).

g) Goldman, Vanguard Rocket, Vibration Bull Part II Nav Res Lab (1958).

h) Schmidt, Fluctuating Loads at High R’Numbers, J. Air­craft 1965 p 49.

l) Petrikat, Vibrations of Round Struts, WTunnel Rpt TH Hannover (1938).

j) Jones, Oscillating Circular Cylinder at High R’No., NASA TR R-300.

(k) Tulio, Oscillating Rigid Cylinder, NASA CR-1467.

(l) Schmidt, Fluctuating Force on Circular Cylinder, NASA June 1966 Conference.

m) Fung, Cylinder at Supercritical R’Number, IAS No. 60-6

Power and Drag. The power per unit length to rotate a cylinder in two dimensional flow due to the aerodynamic forces can be estimated from the equation

HP = C Df? (U)2 ТГ d N/21,000 (6)

where Cpf is the skin friction drag coefficient at a Rey­nolds number corresponding to the tangential rotational speed and the cylinder parameter, rrd. In equation 6 N is the rpm. Added to the above power, must be the mechani­cal power requirements due to bearings, gears, etc. As noted on figure 5, the drag coefficient is somewhat less than a cylinder at a corresponding Reynolds number. As a result of the required power for rotation and drag losses, the effective lift drag ratio of the rotating cylinder is low.

CL OR Cj,

LIFT OF BLUNT BODIES

Figure 5. Lift and drag of a rotating cylinder as function of relative rotational speed, Magnus force.

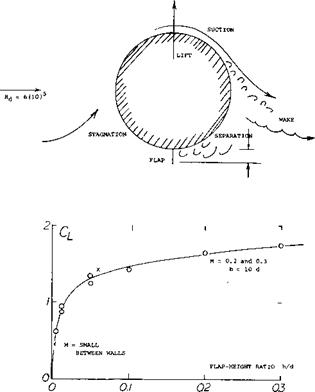
Cylinders With Flaps. The addition of a flap to a non rotating cylinder has a large influence on the cylinder lift as illustrated on figure 6. Even with relatively low flap to diameter ratios as illustrated, a flap at 90 to the flow results in lift coefficient as high as 1.75. Thus, if a splitter were used to change the frequency of the vortex and se­verity of the fluctuating lift forces and the wind changed by 90 large values of lift could be generated as illustrated on figure 6.

LIFT OF BLUNT BODIES

Figure 6. Lift of a circular cylinder in cross flow, induced by a small flap, extended from the lower side.

TWO DIMENSIONAL SHAPE VARIATIONS. The lift of sections in two dimensional flow other than cylinders and sections designed for good performance are often needed, as well as the lift of circular cylinders discussed pre­viously.

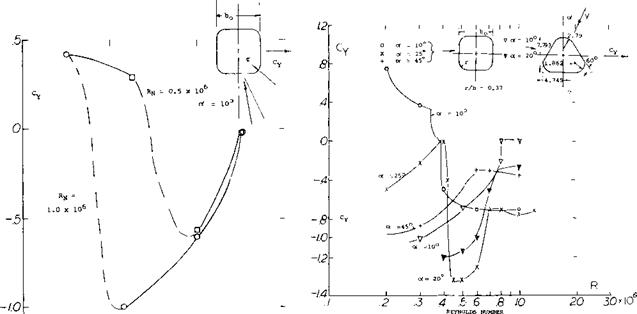
Non-circular Cylinders. The flattening of the sides of cir­cular cylinders influences the lift (5,c) as illustrated on figure 7 for variations of corner radius at ot = lO^.Peak lift is obtained at a radius width ratio of 0.25 to 0.375 depending on the Reynolds number. When RN is above the critical and the radius ratio is 0.25 the lift of the cylinder approaches that for a flat plate, 2 rfsinof.

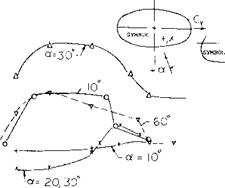
On figures 8 and 9 the variation of the side force co­efficient Су with RN is given for square shapes with rounded corners, triangular and elliptical sections. The side force coefficient in this case is equivalent to the lift coefficient by the

Cu = -Су cosof

LIFT OF BLUNT BODIES

2 ТҐsin


Figure 8. Side force variation with R’number for square and triangular sections for range of angles of attack.


r/b


_ L

.2


.6


4


12-

.8-

.4-

O-

.4-

-8-


Figure 7. Side force variation of square section with rounded corners operating at ol =10°.


These coefficients are based on the width b normal to the body axis per unit length. The RN is based on the depth of the section C0. Below the critical Reynolds number the side forces variation is large. This large variation tends to be eliminated at RN’s above 1.5 x 10 . The importance of separation and the corresponding formation of vortices which have a large influence are illustrated from these results.


LIFT OF BLUNT BODIES

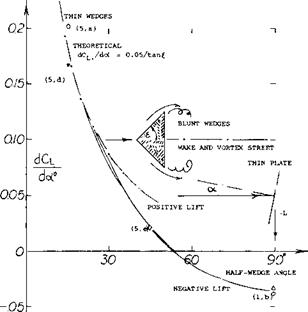
Wedge Shape Sections. With their sharp edge leading, wedges develop lift in a manner similar to airfoils, as long as their base (thick trailing edge) is small. However, as shown in figure 10, the lift-curve slope is considerable as thickness ratio and apex angle are increased beyond a point where the geometrical similarity with any airfoil section ceases to exist. “Lift” is then again a component of drag, and its slope changes sign above € = 50°. Con­sidering a triangular cross section (with four included an­gles of 60° = 2(30°) in each corner) it is clear that within 360° there will be three angles of attack, around which the lift-curve slope is positive, and three angles where it has a maximum negative value.

(3) Circular culinders with devices affecting circulation:

a) Pankhurst, Cylinder With Thwaites Flap, ARC RM 2787

(1953).

b) Grimminger, Various Guide Vanes, TMB Rpt 504 (1945).

c) Welsh, Splitter Plate Reducing Transverse Oscillations, U. S.

Navy USL Report No. 759, 1966.


Figure 9. Variation of side force with R’number for sections with elliptical shapes.

(4) Magus effect circular cylinders:

a) Prandtl, Applied Hydro & Aeromechanics, Dover, N. Y. 1957.

b) Mathews, Lift & Drag Rotating Cylinder, DTMB Report 977, 1960.

c) Fletcher, Negative Magnus Forces in M Range, J of А/С Dec. 1972.

d) Platou, Rotating Cylinder in Transonic Cross Flows, BRL Report No. 1150.

e) Reid, Rotating Cylinders, NACA TN 209.


(5) Wedges and other prismatic shapes in cross flow:

a) Lindsey, Simple Cylindrical Shapes, NACA Rpt 619 (1938).

b) Polhamus, Non-circular Cylinders, NASA TR R-29 (1959).

c) Polhamus, Pressures, Side Forces, Theory; NASA TR R-46 (1959).

d) Tanner, Lifting Wedge Flow, German DLR FB 1965-14.

e) Neilhouse, Spin Research, Fuselage Shape; NASA Rpt R-57 (1960).

(6) Flachsbart, Forces of Plates as a Function of Aspect Ratio and Camber, AVA Gottingen Ergebnisse Bol IV (1932).


LIFT OF BLUNT BODIESLIFT OF BLUNT BODIES

LIFT OF BLUNT BODIES

LIFT OF BLUNT BODIES

Figure 10. The lift-curve slope of sedges (in two-dimensiona.; flow) as a function of their half-vertex angle.

Round Corners. The square cross section in figure 10 at € = 45 , might be assumed to have the same lift-curve slope as the corresponding wedge shape. Then rounding the la­teral edges of these shapes, different values are obtained, however. Pressure distributions of various more or less sharp-cornered cross-section shapes are presented in (5,b) and (5,c). Depending upon the Reynolds numbers em­ployed, the flow tends to get around rounded corners and to produce suction forces of considerable magnitude. Pris­matic shapes and their forces can be of interest in the field of structures exposed to wind. As far as airplanes are con­cerned, drag and lateral forces of fuselages can be impor­tant during spinning (5,e) if they get into this undesirable condition of cross flow.

Thick Airfoil If considering a negative lift-curve slope to be the criterion for lift due to drag of blunt bodies, the 70% thick 0070 airfoil section in Chapter II must be in­cluded in this discussion. The derivative as found between tunnel walls, at R = 6(10) , is dCL/doif0 = -0.08, al­most up to or = + 10 . The flow pattern shown in figure 13 of that chapter explains this result. The minimum lift corresponds to CLx = —0.8. The graph also shows how unstable the flow pattern is, with fluctuations up to лСр = (+ and —) 0.1.

TOTAL AIRCRAFT LIFT

Throughout the preceding chapters we have considered the lift of the various components of the airplane and how it is predicted. The ultimate object of all this is to determine the lift of the complete airplane system for any condition and configuration. To evaluate the performance of a given airplane the lift is needed as a function of attitude and power. In particular the maximum lift is needed as a function of operating flap settings and center of gravity for the complete airplane as this directly influences overall capability of the airplane. The variation of the lift and its maximum value also is needed to determine the stalling characteristics and stalling speed (25,b, c,d).

Stalling Speed. The stalling speed is of primary concern as it determines the capability of the airplane and is, of course, the minimum speed at which the airplane can be operated. The stall of an airplane may be defined by the unpreventable nose drop or an unmistakable manifesta­tion of stall, such as a sever buffeting or oscillation (25,c). The speed at which stalling takes place is determined by the maximum lift coefficient and is expressed by the equation

Ys = »/2W/Clx f s

where CLx is the maximum lift coefficient for the airplane configuration in the trimmed condition. The actual demonstration of the stalling speed of the airplane is a dynamic maneuver and depends on the rate of approach to the stall angle and the inertia of the airframe. If the dynamic approach angle to stall is large C^x wiH be larger than that based on static tests as noted in Chapter

IV.

* STALLING AT CL = 0.75

Figure 36. Influence of cutouts in the center of a wing on the induced characteristics.

(23) Lift of horizontal tail surfaces:

a) Bates, Horizontal Tails, NACA TN 1291 (1947).

b) Goethert, Aspect Ratio, Control Surfaces Ybk D Lufo 1940, P. I, 542.

c) Silverstein, Horizontal Tail Collection, NACA TR 688, 1940.

(22) Wings with longitudinal gap:

a) Munk, Tech Berichte Flug Meist, Vol. I (1917) p 219.

b) Windsor, Streamwise Gap, Univ. Md. Rpt. 453 (1965).

c) Dugan, Theory of a Gap Between Wing and Body, NACA TN 3224 (1954).

(24) H’tails with disturbance in the center:

a) Jacobs, 0012 With Proturberances, NACA Rpt 446 & 449.

b) Engelhardt

Stalling Characteristics. The stalling speed and character­istics of an airplane are a matter of safety as well as performance. For instance, if the stall is sudden and without warning, severe loss in altitude could be encountered during landing if the landing speed were not sufficiently high to eliminate gust effects. Stalling of certain types of airplanes has been found to be insidious and dangerous. This stalling problem is caused by the loss of rolling stability near maximum lift which causes the airplane to roll or possibly flip into a spiral dive, and incipient spin. Recovery from the spin can only be accomplished after some loss of altitude, which becomes critical when stalling takes place near the ground as during takeoff and landing.

Desired Stall Characteristics. An airplane with good stall characteristics will generally have a gentle stall that starts inboard on the wing. This type of stall will reduce the downwash on the tail which results in a stabilizing moment tending to eliminate the stall. Buffeting will be encountered on the tail from this as a warning. As the stall is approached there should be no loss of lateral control and the airplane should have no tendency to fall off on one wing or the other. Recovery from the stall should be easy to accomplish with a push of the control column.

If stalling can not be made safe (stable) the pilot should be forewarned by an indication of buffeting of the airplane and/or control column as well as its behavior: sagging, swaying, reduction of control response. When the stall is too dangerous it must be completely avoided by such devices as restricting longitudinal control in such a manner that the angle of attack needed for stall can not be obtained, While this appears to be a suitable approach, problems at other flight conditions may make it unsuit­able.

In modern airplanes, the wings (airfoil section) are basically designed for high speed (low drag). Thin sections with small camber, and with the maximum thickness at 40% chord have a small nose radius and influence stalling as follows:

a) the angles of attack are lower

b) the stall is more sudden and more pronounced in manner

c) little warnings, such as gentle stick buffeting, occur.

Higher wing loadings, that is increased take-off and landing speeds, also make any stall more dangerous. The pilot may be forewarned of the impending stall as follows:

a) position and force of the elevator control column, also attitude of the airplane nose up.

b) vibration and sound of the airplane as a function of engine, propeller and structure

c) lateral behavior (rolling, swaying aileron response).

d) by instruments: speed, sinking or climbing.

Unfortunately, the angle of attack (against air) cannot easily be measured and indicated.

TOTAL AIRCRAFT LIFT

Figure 37. Aircraft configuration (25,a) with part-span double – slotted flaps.

(25) Lift characteristics of complete aircraft:

a) Sweberg, Summary Maximum Lift Coefficients and Stalling Characteristics of Airplanes, NACA WR L-145.

b) Fink, Full-Scale Wind Tunnel Test Single Engine Airplane, NASA TN D-5700.

c) Wimpenny, Low-Speed Stalling Characteristics, AGARD Report 356.

d) Kier, Minimum Flying Speed for a Large Subsonic Jet Transport, NASA D-5806.

(26) Maximum lift of flapped sections:

a) Sivells, 64/75-210 Wings with Flaps, NACA TR 942.

b) Serby, Review of Full-Scale Landing Flaps, ARC RM 1921 (1937).

c) Sherman, 18 Wing-Fuselage Combinations, NACA TN 640 (1938).

d) Abbott-vonDoenhoff-Stivers, Airfoil Data, NACA TR 824 (1945).

Prediction of Aircraft Maximum Lift. The determination of CLX for the complete airplane with straight wings starts with finding the area of local stalling of the various wing sections employed as described in Chapter IV. If the wing has high lift devices Chapters VI and VII are also used. For moderate or high aspect ratio straight wings the local variation of CLX can be chosen to give the desired stalling pattern. Even with flaps the secondary effects are such that the desired stall can be predicted (25,c). In the case of swept wings the CLX is influenced to a large degree by the boundary layer flow as discussed in Chapters XV and VI. Here CLX ls increased inboard and reduced outboard making the prediction difficult.

The effect of the fuselage, nacelles and the moments needed for trim must also be considered in determining CLX. These are discussed throughout this book. Unfor­tunately, interference effects, gaps and associated effects make the prediction of C^x for the complete airplane somewat inaccurate. This is true even with complete model wind tunnel test results, as there are many factors that influence the results including:

a) Differences in Reynolds number between test and full scale.

b) Effect of extremely low pressures in the slots of the flaps and leading-edge devices leading to Mach number problems in the wind tunnel tests that change the results compared to full scale.

c) Trim and c. g. changes not properly measured.

d) Poor simulation of full scale airplane by model due to lack of representation of such items as flap tracks, inlets, exits, landing gears, gun openings and gaps.

e) Change in wing stalling pattern, due to Reynolds number.

f) Changes in lift due to simulation of power effects.

It has been found that generally the model test results have a C LX 10 to 15% higher than would be measured on the full scale airplane. These higher values of CLX, determined from model test results, illustrate the dif­ficulty in accurately predicting the maximum lift of full scale airplanes. Generally, the model results are reduced by 15% when making the final prediction for these reasons.

FLAP-SPAN RATIO bf/b

Подпись:C2 04 00 08 Ю

Figure 39. Flight test results of small airplane with various types of wing flaps as a function of span ratio.

Maximum Lift Build Up. In determining the maximum lift of the complete airplane for any given configuration the value of each component is found as a function of angle of attack. Starting with the wing, CL is found for the clean configuration; then the effect of flap deflections, fuselage, tail, engines and their mutual interferences are determined. Equations and data are provided throughout this book to accomplish this. A typical buildup of C j x is given on figure 37 to illustrate the effect of the various components.

TOTAL AIRCRAFT LIFTThe airplane configuration as in figure 37 was tunnel tested (30,d) among others with double-slotted flaps. The maximum lift coefficient varies as follows:
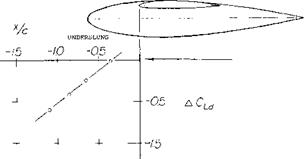
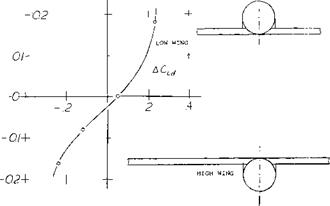
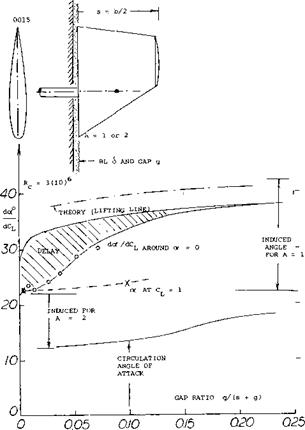
CLX = 2.76

wing with full-span flaps

= 2.41

wing with 60% span flaps

= 2.09

after adding the fuselage

= 1.94

after adding a horizontal tail

= 1.35

for the plain wing alone

= 1.18

airplane with flaps neutral

While it thus might be claimed (on the basis of two-dimensional wind tunnel tests) that lift is increased 100% through the use of flaps, the realistic increase corresponds to 1.94/1.18 = 1.64 or to 1.94/1.35 = 1.45 only when including the fuselage. As far as gliding and climbing is concerned, the sinking speed is roughly doubled with the part-span flaps down (CUopt = 1.9) as against the condition with flaps neutral (where C opt = 1.1). The illustration also shows the stall pattern. On account of inboard flaps and fuselage, stalling begins in the parts of the wing adjoining the fuselage while the wing tips reserved for the ailerons have a completely undis­turbed flow.

Another example of the variation of lift with angle of attack and CLX for an airplane with and without flaps is given on figure 38. The maximum lift coefficient of the complete full scale airplane as tested agrees with flight results, thus showing that when the exact conditions and configuration are duplicated in the wind tunnel reliable results are obtained. The increase in C [_x with power is also shown on figure 38. This would be expected based on the increased velocity in the propeller wake that impinges on the wing. In Chapter XII the procedures for calculating this increase are presented.

Figure 40. Statistical evaluation of the maximum lift on airplane configurations with trailing-edge flaps.

Effect of Flap Design. Wing flaps are presented in detail in Chapter V. The effect of the application of these flaps as a function of flap-span ratio for the complete airplane are given on figure 39. These are data from flight test results of a series of small aircraft. The drag lift ratio D/L presented shows the characteristics for evaluating landing and takeoff. At the higher values of D/L the approach angle is increased, which is usually an advantage when landing. Since Fowler and similar flaps have less drag during takeoff, the best flap system might be this type, providing it cou]d be deflected to a very high angle when landing so that the approach angle would be large due to the high D/L. The effect of flaps on C LX can also be evaluated from the data given on figure 40, an evaluation of wind tunnel test result

INTERRUPTIONS OF SPAN

In the practical design of an airplane the need for data on the physical interruptions of the span may be encoun­tered. This is particularly true in the application of all movable surfaces, such as might be encountered with tilt wing aircraft or the structural mode control fin illustrated on figure 33.

With Longitudinal Gap. Really cutting a wing in two eventually means reducing its aspect ratio to one half. The effective ratio decreases as a function of the gap between the two halves of such a wing. Theory (22,a), considering two lifting lines (having no physical chord), expects a rapid decrease of At /А. Experimental results (22,b) of a rectangular wing (presented in Chapter VII of “Fluid Dynamic Drag”) show, however, that chord and thickness of the square and blunt wing ends are obstructions for the flow through the gap, at least for ratios of y/b below 0.03, or y/c = 0.2. The induced characteristics of a pair of wings or airplanes flying side by side can be derived from this information. A real gap is found between an all-movable control surface (fin or rudder, as on submarines in particular) and the adjoining “wall” of the vehicle.

INTERRUPTIONS OF SPAN

INTERRUPTIONS OF SPAN

Figure 32. Influence of vertical position of a wing nacelle body combination on the lift.

Theoretically, the aspect ratio of the fin as in figure 33 is doubled through reflection in the wall. The lift angle, however, increases as the gap is opened from that for A = 2 to that corresponding to an A = 1. The increase is steady but not at all as sudden as theory (permitting infinitely high velocities without losses) would expect. It should be noted that in reality (as for instance at the end of a fuselage) the boundary layer can be appreciably thicker than that found on the wall of the wind tunnel in which the rudder, as in figure 33, was tested.

INTERRUPTIONS OF SPAN

Figure 33. Influence of a wall gap upon the lift angle of a control surface.

(20) Pearson and Anderson, Wings with Partial-span Flaps, NACA Tech Rpt 665 (1939).

(21) Characteristics of wings with cutouts:

a) Ergebnisse AVA Gottingen Vol. Ill (1928) p 92.

b) Muttray, 2’ts Flugtechnik Motorluft 1929 p 161.

c) Sherman, Cut-Outs, NACA Г Rpt 480 (1934).

d) Smith, Wing Cut-Outs, NACA T’Rpt 266 (1927).

Подпись: THE TAIL SURFACE SHOWN IS ONE EXAMPLE OF THOSE REPORTED IN (23,a) AND SHOWN ON THIS FIGURE; t/c = 13% IN CENTER, = 10% AT TIPS; ELEVATOR WITH OVERHANGING-NOSE BALANCE (INTERRUPTION OF SURFACE) AND GAP = 0.5% c; R = 5(10). WITH THE COEFFICIENTS BASED ON ACTUAL AREAS, EXPERIMENTAL CHARACTERISTICS ARE AS FOLLOWS::INTERRUPTIONS OF SPANПодпись: WITHOUT CUT-OUT WITH CUT-OUT 4.3 A 4.4 .055 dCL/do( .055 0.35 Sf/S 0.33 0.59 dcY /db 0.53 .0014 0 X О .0009 .0050 CHo .0040 THE SIZE OF THE CUT-OUT CORRESPONDS TO S/S = -3.3% AND S/Sf = -9.5%; THE MAXIMUM LIFT (NOT AFFECTED BY CUT-OUT) CORRESPONDING TO CLx = 0.7 FOR o=0 AND CLx =0.6 FOR o=0. Подпись:Horizontal Tail Surfaces are an example of “wings” with moderate aspect ratio. The type, as in figure 34, has a more or less rounded planform, has a cut-out for the rudder, and has gaps to permit deflection of the elevator. The effective aspect ratio as well as the section efficiency are reduced, accordingly. Regarding cut-outs, the experi­ments reported in (23,a) do not show any influence upon the lift curve slope, provided that the lift is referred to the reduced area. The lift-curve slope of typical horizontal surfaces are plotted in figure 34. The difference between the tail surfaces and the “round” wings, figure 2, Chapter III, can be accounted for by reducing a from 0.9 to 0.8. This difference is primarily due to the open gaps along the hinge lines of the elevator flaps. In comparison to sharp-edged and rectangular wings the lift-curve slope is appreciably reduced, roughly between 16 and 19%.
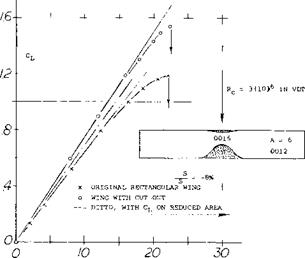
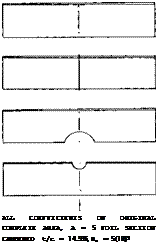
Influence of Fuselage. When testing a half wing at the wall of a wind tunnel or mounted on a suitable end plate, the boundary layer developing along the wall can noticeably reduce the lift of that wing. In combination with an adverse pressure gradient, boundary-layer interference is particularly strong at the end of a fuselage. The B’ layer developing reaches such proportions that at the location of the tail surfaces it fills a circle roughly equal in diameter to that of the fuselage. As pointed out in Chapter VIII of “Fluid Dynamic Drag”, the horizontal tail is thus cut in half, so to speak; and its induced drag can be doubled. The lift of the combination reported in (16,b) is shown in figure 2 of Chapter III. The lift deficiency is largest at small angles of attack, where the lift-curve slope is but 11% of that of the isolated tail surface. At some angle of attack corresponding to CL = 0.7, the maximum value of (C Jot) is still 11% below the isolated slope. As indicated in “Fluid Dynamic Drag” the effective aspect ratio reduces according to

А(УА = 1 – 12 Срн (25)

where the coefficient represents the fuselage drag (includ­ing everything attached to it and wing-root interference) and is referied to the total planform area of the tail surface (subscript H).

INTERRUPTIONS OF SPAN

Figure 35. Lit characteristics of a wing with faired cutouts. Coefficient based on the original wing area.

Подпись:Подпись: ALL COEFFICIENTS ON ORIGINAL COMPLETE AREA, A = 5 FOIL SECTION CAMBERED t/c = 14.9%, Rc = 5(10)5 Cutouts. Figure 35 presents the influence of a well profiled cutout as it was used many years ago in the upper wings of biplanes (to give the pilot a better view). Disregarding lift coefficients above 0.9, the effect is that of lift distribution (with a dent in the center). Some possible reductions in chord in the center of a wing are shown in figure 36. Because of flow separation the leading edge is more sensitive than the trailing edge. A lot of lift can also be lost, however, on account of a cutout from the rear. While the reduction of wing area in part (c) of the illustration is only 8%, that of the lift is 15%. Analysis shows that the effective aspect ratio is reduced to 82%. Any disturbance of the high-speed flow along the upper side of the wing roots may thus produce the equivalent of a gap or cutout in the wing span. In fact, cutouts have sometimes been used at the trailing ends of the wing roots to reduce downwash and improve longitudinal stability.
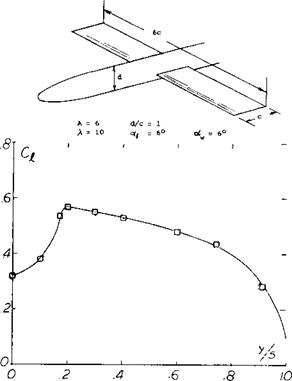
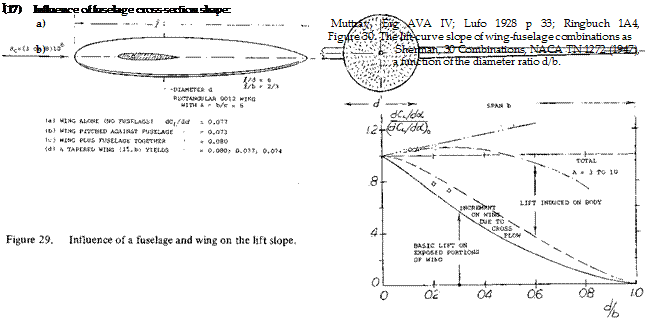
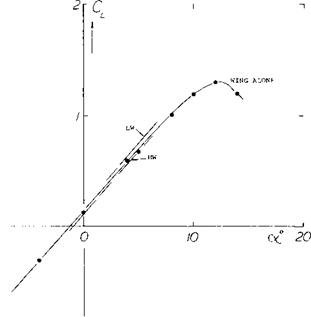
dc* /dcL dcD/dc2L

LIFT OF WING-BODY COMBINATIONS

When a wing fuselage and/or engine nacelle are combined the lift of the combination is different than would be found by summing the lift of each body alone. The difference in the total lift is a result of the mutual interference due to the flow fields of each body. Until recently the mutual interference effects of wing-body combinations could only be determined by test. With the development of the vortex lattice technique, progress has been made in calculating the lift of the combination (15,g).

Alpha Flow. The interference of wing-body combinations can be determined by considering a circular cylinder inclined at some small angle of attack. At this condition then a component of the flow corresponding to (V sinof ) crosses the cylinder. This component is zero at the windward “stagnation” line of the body. At least theoretically, it reaches the maximum value of (2V sinof ) at the sides of the cylinder. As a result, the angle of the flow relative to the body axis is doubled. Placing now a wing across the cylinder, its angle of attack at the roots is equal to “2 ex’ ”. This type of upwash is illustrated in figure 6, Chapter XIX. The resultant lift distribution of a mid-wing fuselage configuration is shown in figure 28. At the roots a pair of peaks is evident.

Body Lift. Circulation and pressure distribution around the roots of a wing are transferred to a certain degree upon the fuselage. To understand this phenomenon, we may consider the two wing panels to be end plates prohibiting any flow around the sides of the body (at least within the length of the root chord). For example, in the configuration as in figure 28 the aspect ratio of the center part of the wing covered by the fuselage is A0 = d/c =

1.0. The “height” of the “end plates” each is ‘h’/d = 3.0. According to the function presented in Chapter III, the effective aspect ratio of the fuselage is then Ac = 5.7A = 5.7. The coefficient of the lift on area (dc) induced upon the body by the wing is then 95% of the average of the wing panels. A more accurate analysis is presented in (15,d). The lift induced by a wing rotated to an angle of attack against a long cylindrical fuselage with d = 0.36 c, kept at zero angle of attack, is indicated by the differential based on area (dc):

zlCLcj – kCL (14)

where CL = average lift coefficient in the panels of the two-dimensional rectangular wing, and к is a constant to be discussed in the next paragraph. At any rate, the lift is less in this case than that of the wing alone. A situation similar to this one is obtained when deflecting trailing – edge wing flaps, such as in (16,c) for example.

LIFT OF WING-BODY COMBINATIONSПодпись: Figure 28. Lift distribution of a wing fuselage combination.

(14) Airplanes using tandem wings, as the once-famous French “Pou du Ciel” (“Sky Flea”), were more a combination of biplane and tandem system.

(15) Analysis of the lift of wing-body combinations:

a) Multhopp, Alpha Flow, Lufo 1941; NACA TM 1036.

b) See NACA RM A1951G24, L1951J19, L1952J27a.

c) Weber, Spanwise Loading, ARC RM 2872 (1956).

d) Cross Flow, see also “slender body” chapter.

e) Hoerner, T’Rpt F-TR-1187-ND WP AFB (1948).

f) Vladen, Fuselage and Engine Nacelles Effects on Airplane Wing, NACA TM 736.

g) Ashley, Wing-body Aerodynamic Interaction, Annual Review of Fluid Mechanics, Vol. 4, 1972, p 431.

h) Flax, Simplification of the Wing-Body Problem, J of A, Oct. 1973.

i) Mendenhall, Vortex Shedding on Aero Characteristics of Wing-Body Tail, NASA CR-2473,1975.

(16) Wing-body combinations, experimental:

a) Jacobs, 209 Combinations, NACA T’Rpt 540 (1935).

b) Sherrnan, 28 Combinations, NACA T’Rpt 575 (1936).

c) Sherman, With Split Flaps, NACA TN 640 (1938).

d) Gimmler, Pressure Distribution on Wing-fuselage Com­bination, German ZWB FB 1710 (1942).

e) Goodman, Wing-body Position with reference to interference NACA TN 2504.

Wing With Body. When rotating wing and fuselage together the lift induced on the body, aCLcj corresponds to

AC[_d = 2kCj_ (15)

where к – 0.2. However, considering a wing with conventional aspect ratio and possibly elliptical lift distribution, the proper factor might be к = (4/тГ)0.2 = 0.25. At least the same amount of lift is added to that of the wing panels so that the combined lift is somewhat increased. For example, in the combination as in figure 29 where d/b = 0.1, the increment is in the order of 4%. Figure 30 shows the increase of total lift as a function of the diameter/span ratio. As derived in (15,f) the three components of lift in larger aspect ratios are approxi­mately as follows:

the lift increment of the exposed portions of the wing

LV =L^B (1-о)5/з (16)

due to cross flow or alpha flow

L„ = L^B cr(l-o/3 (17)

lift induced on the body by the wing

LB =LwB <г(1+а)(1-<т)2/з (18)

where о is the body diameter d over the full span b, cr = d/b and is the lift of the complete body system. The interference effects of the wing and body have also been given in (15 ,g) as

LwB=Lw- 0 +0-)2– Total lift @CX (19)

= L*r (1 + cr) – – Lift wing alone (20)

L B = L*. <r (1 + cr) – – Body lift (21)

The lift given in equations 19 and 20 include the interference effects.

For small (d/b) ratios we find approximately

(dcL /dor)/(dCL Ida) =1+0.2 (d/b) (22)

Fuselage Shape. Not all fuselages are circular in cross section. Shapes as in figure 7, Chapter XI have been investigated. In general it can be said that bodies with a more or less flat bottom, adjoining the wing roots, tend to produce higher lift-curve slopes. Minimum drag and drag due to lift of such shapes are not necessarily higher than for the circular cross section.

LIFT OF WING-BODY COMBINATIONS
WEBER EXPERIMENTAL A = 3 AND = 10 (15,C) JUNKERS, RECTANG LOW WING A = 6,SEE(15,e) NACA, RECTANGULAR MID WING A = 6 (16,a) NACA, WING COMPONENT (MAYER-GILLIS)

LIFT OF WING-BODY COMBINATIONSHIGH WING

LOW WING POSITION

LIFT OF WING-BODY COMBINATIONS

Figure 31. Lift differentials caused by typical high – and low- wing engine nacelle bodies.

Displacement. A fuselage or an engine nacelle displaces the flow around it (perturbation). This effect becomes particularly evident in high-wing or low-wing combin­ations. To explain the consequences of displacement, we may assume that in one strip of an airfoil the velocity may be reduced 50% and in another strip increased 50%. While the average velocity thus remains constant, the average of the dynamic pressure is now 0.5 (0.52 + 1.52) = 1.23 times that of the undisturbed flow. A pair of round nacelle bodies (with a length І = 1.5 c) are shown in figure 31. For practical purposes the lift-curve slope remains unchanged. However, the low-wing type (with the nacelle above the wing) exhibits an increment of the lift coefficient, based on the covered area (d c), of AC|_ = + 0.18 while the underslung nacelle shows a differential of – 0.17. The signs of these differentials can be explained by displacement, as above. In regard to drag, it should be noted that the low-wing configuration evidently suffers from interference along the roots (on the upper side of the wing).

Engine Nacelles. The wing position on the streamline body as in figure 32 was systematically varied. In an underslung forward position (with the body nose at x/q 100% of the wing chord ahead of the leading edge) a displacement Tow develops, resulting in ACLd = – 0.5. For x/c = – 30% (aft position investigated) the lift coefficient is not affected. As a function of height (low wing and high wing), ACtd varies as shown in the illustration.

LIFT OF WING-BODY COMBINATIONS

Fillets. Of course, viscosity (skin friction, boundary layer, flow separation) reduced any peak in the lift distribution which may theoretically be predicted for the wing roots. Fillets used to fill out the corners between the upper side of the wing roots and the fuselage walls (18,a) are only effective when extending downstream, somewhat beyond the trailing edge. Their benefits are found at higher angles of attack and in the maximum lift coefficient. A disadvantage of fillets can be increased down wash and reduced longitudinal stability. Bending up the trailing ends of the root sections is a possible method of reducing downwash without causing separation.

Induced Drag. The influence of the angular setting of the nacelle against the wing chord results in dCLd /di = 0.036. At least half of this lift originates on the wing panels. As pointed out in Chapter VIII of “Fluid-Dynamic Drag”, a certain amount of induced drag results from any lift differential. In the low-wing or high-wing position, as in figure 31, the induced component of the nacelle corresponds to C D<k = 0.01, while the total drag (body, interference, induced) is in the order of = 0.04. It is suggested that the variations of the forces are similar to those due to the deflection of a trailing-edge flap over a part of the span equal to the diameter of the body, as described in (22). This approach accounts for constant differentials of lift and induced drag.

(18) Wing-fuselage junctures (fillets):

a) Sherman, NACA TN 641 & 642, T’Rpt 678 (1939).

b) Muttray, see NACA TM 517 and 764 (1935).

(19) Influence of engine nacelles on lift:

a) McLellan, Nacelle Position, NACA TN 1593 (1948).

b) Becker, Twin-engine Model NACA T’Rpt 750 (1942).

c) Pepper, Fuel Tanks, NACA W’Rpt L-371 (1942).

VARIOUS WING ARRANGEMENTS

In the case of most single wing aircraft, the lift and performance are determined by analyzing the wing operating in the flow field as generated by the fuselage, and the tail operating in the wake of the fuselage and wing. A pair (or any number) of wings can be arranged so that they interfere or combine with each other. Configura­tions of this kind, such as biplane or tandem wings in particular, and related characteristics are considered as follows.

Tip-to-tip Coupled. When putting together two airplanes in flight, joining them by means of some mechanism at their wing tips, it can be speculated that their effective aspect ratio might be doubled and their range be increased, possibly to the /2 – fold. Actually, to keep each of these airplanes balanced without straining the coupling it will be necessary to deflect the ailerons, thus reducing the lift distribution approximately to that as when flying alone. Only when joining three airplanes together, as in figure 17, might the one in the middle really benefit. Considering what is said and presented quantitatively in Chapter VII of “Fluid Dynamic Drag” about flying in swept formation (as migratory birds do), it might be better to do just that, thus eliminating physical contact. The lateral stability problems described in (6) would then also be avoided. Of course, to transfer fuel two or more airplanes have to make physical contact somehow, but not for any long duration of time.

VARIOUS WING ARRANGEMENTS

Figure 16. Oblique-winged configuration of a supersonic trans­port airplane.

DYNAMIC (FORMATION-FLYING) MODEL OF A POSSIBLE TIP-TO-TIP COMBINATION OF A BOMBER WITH A PAIR OF FIGHTER

AIRPLANES. bQ = 1.1 m

b3 = 1.7 m

Aq = 5.1

A3 = 9.4

VARIOUS WING ARRANGEMENTS

Figure 17. Arrangement of a bomber and two fighters coupled to each other.

Biplane. In the early years of aviation, hundreds of biplane-type airplanes were designed and built and they reached the peak of their development as fighter airplanes, particularly in England, between 1915 and 1925. Their aerodynamic characteristics were studied as a function of gap or height ratio, span ratio, stagger and so-called decalage (difference in angular setting as against each other). The optimum biplane (providing maximum L/D) has equal-size pannels. Many biplanes were developed, however, with a larger upper and a smaller lower wing (7,g). Theory indicates that in such configurations, aerodynamic efficiency is highest when the geometric aspect ratio of the upper wing is smaller and that of the lower wing is larger than the average. Since biplanes are hardly built any longer, except as sport or special purpose types, we will limit our presentation to that of the simple identical-panel type.

(6) Bennett, Tip-to-Tip coupled wings:

a) Bomber with Two Fighters, NACA RM L1951A12.

b) With Floating Fuel Tanks, NACA RM LI951E17.

(7) Theory and results of biplanes (multiplanes):

a) Prandtl, NACA T’Rpt 116, also Erg AVA Go III.

b) Munk, Bi – & Triplanes, NACA T’Rpts 151 and 256.

c) Knight, At High Angles of Attack, NACA T’Rpt 317 (1929), also TN 310, 325, 330 (1929).

d) Diehl, Engineering Aerodynamics, 1928 and 1936.

e) Griffith, Triplanes, ARC RM 250 (1916); many results as a function of height and stagger.

f) Noyes, Various Configurations, NACA T’Rpt 417.

g) Pressure distribution on one upper and Vi lower wing panel is reported in NACA T’Rpt 271 (1927).

h) Diehl, Relative Loading, NACA T’Rpt 458 (1933).

i) NACA, Load Distribution, Rpts 445 & 501 (1932/34).

Подпись:Подпись:Подпись:A “boxplane” (having a pair of end plates connecting upper and lower lateral edges) has even higher ratios. Note
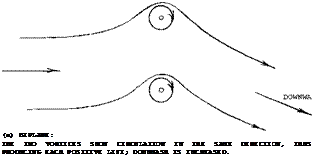
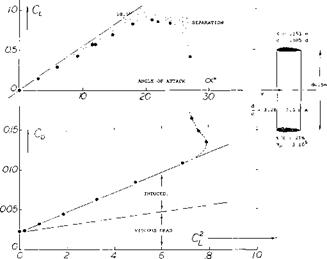
that the upper limit (for h/b…… oo ) is Ac /А = 2 for

the biplane, while for the “boxplane” A-JA……. oo.

Lift Distribution. In part (a) of figure 19 a pair of lifting lines is shown representing a biplane. At the location of the lower vortex, the upper one induces a component of velocity against the oncoming flow. Vice versa there is such a component in the direction of the flow at the upper vortex. The average dynamic pressure is changed, accordingly. As a consequence, the lower wing of a biplane tends to exhibit somewhat less and the upper wing somewhat more lift, provided that both are set to the same angle of attack. Evidence for the difference is found in (7,b) where the combination of two panels each with A = 6 is tested at a gap ratio h/b = 0.1. The drag due to lift in the upper panel is found to be almost 20% higher, and that of the lower panel 20% lower than the average. For a certain lift coefficient, the loading can be made uniform by giving the lower wing a somewhat higher angle of attack (negative decalage). Another method is to give the lower panel a somewhat larger aspect ratio in a manner similar to that mentioned above. There are other considerations involved, however, in the design of biplanes, such as stalling for example.

Подпись:VARIOUS WING ARRANGEMENTSEffective Aspect Ratio. The average induced lift angle of a monoplane wing is a function of the deflected volume of air and that volume corresponds to a cylinder of air having a diameter equal to the span V of the wing. Two identical wings far enough apart from each other have together two such cylinders, twice the volume and twice the lift, for a certain angle of attack but at the same induced angle of attack. Bringing the two wings together, in the form of a biplane, we may roughly assume that the cross section of the cylinder of air affected is that of two half circles with a diameter equal to ‘b’, plus twice the area between the two panels equal to 2(h b), where h = height or gap. We thus obtain tentatively

Al/A= 1 + (8/TT) (h/b) (2)

where A = b2 /S, and S = combined area of the two panels. Note that the value h/b = 0 represents a monoplane wing with twice the chord of the panels assumed. A more accurate analysis and experimental results are plotted in figure 18. The function can be approximated by

A-JA = (1 + 3.6(h/b))/(l + 1.4 (h/b) (3)

VARIOUS WING ARRANGEMENTS

(b) GROUND EFFECT:

THE GROUND IS SIMULATED BY AN IMAGE OF THE LIFTING VORTEX HAVING NEGATIVE LIFT; DOWNWASH IS REDUCED.

Figure 19. Repiesentation of a biplane and of a wing near the ground, each by a pair of lifting lines.

VARIOUS WING ARRANGEMENTS

Figure 20. Lift characteristics of a ring-shaped airfoil (8,e).

Multiplanes. On the basis of constant span the induced efficiency increases not only as the height ‘h’ is increased, but also as the number of panels placed within that height is increased. Theoretically, the effective aspect ratio thus increases to that of the “boxplane” as in figure 18. The practical incentive for building biplanes or multiplanes is or was structural, compactness and maneuverability (rolling). A number of triplanes have actually been built and flown (2,a) over 50 years ago. Aerodynamic characteristics are reported in (7,e).

Ring Foil A ring-shaped “wing” such as in figure 20 is somewhat similar to a biplane. Analysis (8,a) concludes that the effective wing area of a ring is

S’ = 0.5 ТГ dc ^ 1.6 dc (4)

where (0.5 ТГ d) = half of the circumference. The equivalent stream of fluid deflected by such a wing is twice the cylinder defined by the diameter ‘d’ = 7Td/2. According to this theory, the induced angle of attack is less than half of that of a plane wing having the same span and developing the same lift. The effective aspect ratio is

A і = 2 d2/‘S’ = 4 d/(TTc) (5)

The induced angle is

dof /dCL = 1/(1ГАі ) = 0.25 c/d (6)

where CL is based upon the area S’ as in equation (4). The lift angle is

d«/dCL – (0.5/a TF) + (1/ TfAi ) (7)

The experimental results in figure 20 confirm this function when using the efficiency factor of the foil section a = 0.8. It must be noted, however, that the coefficients as plotted are based upon the area 2(d/c). Ring-shaped surfaces are sometimes used as stabilizing tails for bombs and similar devices. Ring foils are also discussed in the chapter on “small aspect ratios”. Accurate theoretical methods have been developed (8,g) for calculating the lifting characteristics. This method is based on the finite element method and given good correlation with experiment.

Подпись: h Подпись:Подпись: PLAIN AIRFOILSVARIOUS WING ARRANGEMENTSVARIOUS WING ARRANGEMENTS

(8) Characteristics of ring-shaped foils:

a) Analysis by Ribner, J Aeron Sci 1947 p 529.

b) Muttray, Experiments, ZWB FB 824/3 (1941).

c) See also in the “small aspect ratio” chapter.

d) Dickmann, Axial Theory, Ing Arch 1940 p 36; see Brooklyn Poly Dpt. Aero Engg PIBAL Rpt 353 (1956).,

e) Fletcher, 5 Annular Foils, NACA TN 4117 (1951).

f) Milla, Lift and Drag Characteristics Biannular Wing Aircraft, JofA/C, Nov., Dec. 1966.

g) Carmichael, Finite Element Methods for Wing Body Combination, NASA SP-228,1969.

(9) Influence of ground on wings, theoretical:

a) Wieselsberger, AVA Gottingen Ergeb II (1923).

b) Datwyler, Wings Close to Ground, Mitteilung Aerody Inst., TH Zurich 1934; see ZFM 1933 p 442.

c) Analysis by Meyer, Hydrofoil Rpts 1950/51; and by Wu, Caltech Hydromechanics Rpt 26-8 (1953).

EXPERIMENTAL RESULTS:

0QATYYLER (9, b)

Л HOE. INER (10, b)

X DITTO UNDER CEILING

H/C,

7 ~2 3 4 3

Figure 21. Influence of the ground on the lift angle of airfoil sections in two dimensional flow.

VARIOUS WING ARRANGEMENTSПодпись:Подпись: 6Подпись: 8VARIOUS WING ARRANGEMENTSGROUND EFFECT. As far as the lift of an airplane wing is concerned, there are two effects through which the ground (of an airfield) affects the angle of attack necessary to produce a certain lift coefficient: the circulation of the airfoil section in two-dimensional flow is changed, and downwash and induced angle of attack are reduced. In case of the first effect, the height of the trailing edge above the ground is the parameter to be considered. Theory (9,b) predicts that roughly below CL = 1.5 lift will be increased in proximity of the ground, while above that coefficient with wing flaps deflected, for example, there will be a reduction of the sectional lift. Figure 21 presents results obtained in the range of lift coefficients (up to Cu = 1, where

Cu(cx) is still linear). The lift angle da’/dCu

reduces considerably when approaching the ground, below h/c = 0.1. It must be realized, however, that there has to be a limit to the function plotted imposed by the fact that the trailing edge of the wing eventually touches the ground. When this happens, the pressure on the lower side is equal to the dynamic pressure (9,b) so that theoretically Cu# 1, at o^O.

ASPECT RATIO A _(dctf ±/йСь)h

VARIOUS WING ARRANGEMENTS

VARIOUS WING ARRANGEMENTS

0______________ L

0 2 4

I

VARIOUS WING ARRANGEMENTS

Figure 22. Induced angle of attack of wings operating near the ground.

Induced Effect. Wings of conventional airplanes may never get close enough to the ground where the sectional effect as described above would become noticeable. For practical purposes, only the influence upon the induced angle of attack will then be left. The lifting-line equivalent to this ground effect is shown in part (b) of figure 19. While in a biplane the two vortices turn in the same direction, the ground is replaced by a mirror image of the lifting vortex. The plane of symmetry is characterized by the fact that no transport of air takes place across, as in the case of a solid plate. The influence of the ground upon the induced angle of attack (and drag) is presented in figure 22 in the form of the ratio

A/Ai=(dori/dCL)h/(d(y/dCL)oo (8) where h = height over ground measured to the wing’s quarter chord axis, and where ‘ oo ’ indicates conditions at h = oo. Note that the tangent near h/b = zero in part (a) of figure 22 indicated by d(A/A ) is twice that in figure 18 indicated by d(A /А). The two derivatives would be alike if defining for the ground effect 4T as the distance between the two lifting lines as in figure 19. The function as in figure 22 might be interpolated by

A/At = (33(h/b)Vi )/(33(h/b)y*+ 1) (9)

For conventional airplanes, when near the ground (taking off or landing), the height ratio can be between h/b = 0.1 and 0.2, (ЮДі) Figure 22 shows that at b/h = 10 the induced angle of attack is reduced to half. As to the spread of the experimental results in figure 23 (end plates), it can be said that on the average the more favorable points reflect the induced lift angle, while the less favorable ones indicate the drag due to lift. In this drag, there is usually a parasitic component involved due to interference on top of the viscous component of the airfoil section CmjnC* , which was always

subtracted when evaluating experimental results, mental results.

The reduction of the induced angle due to the ground may affect longitudinal stability and control of the airplane during the landing maneuver. In airplanes landing tail-down, the ground must also be expected to affect the horizontal tail surface directly. The ground effect will resist the effectiveness of the elevator in getting the tail down. The drag due to lift may not be of particular concern during landing. It is interesting, however, to speculate upon the reduction of drag to be expected when flying as close as possible to the surface. At an assumed h/b = 0.25′ or b/h = 4 the reduction of the induced drag is some 20% and that of the total drag (when flying at maximum L/D) is possibly 10%.

VARIOUS WING ARRANGEMENTSLanding Flaps. As in swept wings where the wing tips are closest to the ground, Chapter XV, landing flaps can bring some portion of the trailing edge down to a small distance ‘h Here, as in wings, it might be better to define that distance from the 3/4 point of the “mac”. There is a good reason for selecting the three-quarter axis of the wing as the level of reference. Analysis (ll, a,b) shows that the effective angle of attack of the airfoil sections at the three-quarter point of the chord is really responsible for the lift produced.
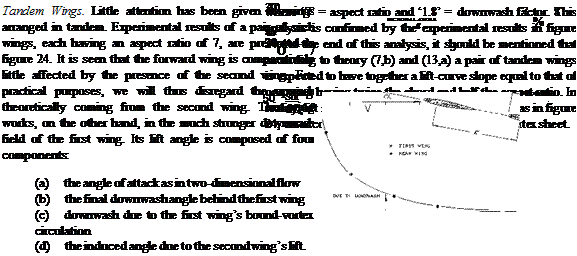
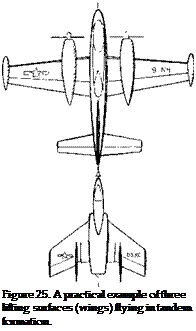
Ram Wings. So-called “Ground Effect Machines” or “Air Cushion Vehicles” have been investigated and built. One version of these vehicles, called “Ram Wing”, uses one or more wings with end plates or skegs attached to the lower side, thus coming very close to the ground or even slicing through the water surface. Figure 23 shows typical test results (12,e) of wings with aspect ratios of 1, 2 and 4 with and without end plates. Analysis of the induced angle is not readily possible because of the close proximity to the ground. The improvement with aspect ratio of the L/Dx is apparent from figure 23. The L/Dx also improves rapidly as the ground is approached and the end plates allow the main wing to operate further from the ground while maintaining high lift drag ratios.

VARIOUS WING ARRANGEMENTS

Figure 23. Lift drag characteristics of a “ram wing” as a function of height above the ground.

(10) Influence of ground on wings, experimental:

a) See some references under (7).

b) Hoerner, Fieseler Water Tunnel Rpt 9 (1939).

c) See “due to lift” chapter “Fluid-Dynamic Drag”.

d) Reid, Full Scale Flight, NACA T’Rpt 265 (1927).

e) ARC, Experimental Results, RM 1847 and 1861.

f) Buell, On Delta Wings, NACA TN 4044 (1957).

g) Fink, 22% Thick A = 1 to 6, NASA TN D-926.

h) Baker, Ground Effect Low-aspect-ratio Airplanes, NASA TN D-6053.

i) Lockwood, Ground Effect Ogee Wing, NASA TN D-4329.

To provide longitudinal stability, two wings in tandem are used in (12,c). Analysis of pitching characteristics is simple, insofar as down wash (behind the first wing) is practically zero. When pitching, the height over ground of the first wing increases while that of the second one reduces. Within the small values of ground clearance investigated in (12,b, c) the section characteristics (such as the angle of attack for zero lift) change considerably. Also, when these vehicles are to be used over water the deformation of its surface (due to the pressure below the wings) must be taken into account.

(11) Wing theory:

a) Weissinger, Yrbk D Lufo 1940 p 1-145; ZWB Rpt FB 1553 (1942) see NACA TM 1553; Tech Berichte ZWB 1943; ZWB Rpt UM 1392 (1944); Math Nachrichten 1949 p 46; ZFW 1956 p 225; see NACA T Memo 1120 and TN 3476.

b) Pistolesi, 3/4 Chord Principle, Conf Rpt Lilienthal Ges Lufo 1937 p 214; applied by Weissinger (43,b).

(12) Longitudinal characteristics of “ram wings”:

a) Foshag, Ground Bibliography, DTMB Rpt 2179.

b) Harry, With End Plates, DTMB Rpt 1979 (1965).

c) Harry, Tandem Wings, DTMB Rpt 2259-1 (1966).

d) Low Aspect Ratios, See Chapter on this subject.

e) Lockheed study, Single and Tandem Low-Aspect Ratio Wings in Ground Effect, U. S. Army Trecom TR63-63.

Regarding downwash see Chapter XI dealing with “longi­tudinal stability and control”. The lift angle of the rear wing (in radians) is theoretically

(da/dCL)2= l/(2atf) + (d«i/dCL)(l <£/<*0Cu/CL2)

-(d‘£7dCu)(CL,/CL2)/(x/c) (10)

Подпись:

VARIOUS WING ARRANGEMENTS

where є = final downwash angle (having a negative sign), where subscript ‘1’ indicates the first and ‘2’, the second wing, and where x = distance as indicated in the illustration. Note that in a tandem system using equal angles of attack CU1 is larger than C L2. • The last term of the equation covers the downwash component due to the first wing’s circulation. Replacing that wing by a bound vortex, the circulation velocity at the radius r = x is

w/V = – (0.25/тґ) CL)/(x/c) = – 0.08 CLj/(x/c) =‘£ ’ (11) where ‘£’ in quotation marks to distinguish this angle from the permanent or final downwash angle.. When considering the lift angle of the second wing, the angle ‘ C has to be multiplied with (Сиі/Сцг,). Therefore, m degrees:

d‘£VdCu= – 0.08 (180) (Cu/CL2)/TT(x/c) (12)

Also in degrees, the angle of the rear wing can be approximated by

(dor 5 /dCL = 11 + (20/7) (1 + 1.8 CL| /C(_2 )
+ (d‘fVdCL2.)

Figure 24. Interaction between a pair of wings operating in tandem (13,b).

Tandem Wings – Refueling. Except for some special VTOL aircraft, few vehicles have been built with tandem wings. Thus, the mechanism given above becomes of interest only during special cases such as the refueling operation. One example is illustrated in figure 25. In this case the airplane being refueled is almost directly behind and is effected to a considerable degree by the downwash produced by the lead or tanker aircraft. In some cases where the tanker is large as compared to the refueled airplane, the downwash is the major factor. Refueling can also take place from a relatively small airplane such as the KC-135, figure 9 Chapter I, to a very large cargo airplane such as the C-5, figure 12. In this case the aft airplane can have a large effect on the tanker and the refueling boom. The supervelocity around the nose of the airplane can be particularly troublesome as the refueling boom must “fly” through this field to make contact with the airplane. The upwash produced by the aft airplane also gives a problem to the tanker, causing a nose-up change in trim (13,g). This can be a problem during the initial contact and breakaway maneuver.

Подпись:shown on figure 27, there is little difference between lift curves for both the high and the mid vertical position canard arrangements up to an angle of attack of 16 . Above 16 the canard surfaces with increased leading-edge sweep develop higher values of lift with a corresponding increase in the total lift. When the wing and canard surface are on the same level the lift decreases. This reduction is due to the mutual interference of the two wings. On figure 27 the lift of the fore portion of the body without the canard surface is given. This was made possible by the dual balance system used. Characteristics of an airplane with a “canard” type of horizontal surface ahead of the wing are also presented in Chapter XI on “longitudinal stability”.
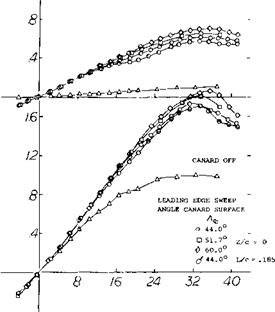
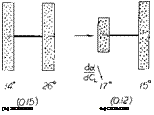
VARIOUS WING ARRANGEMENTS

VARIOUS WING ARRANGEMENTS

Canard Arrangement. Some experiments in (13,c) give more insight into the mechanism of tandem systems. A rectangular wing with A = 6 has a do( /dCL =14° when flying alone, and about 26 ,when in the rear position of a tandem system as in figure 26 (with an equal-span wing ahead). In the case of the “canard” arrangement (with the smaller wing forward) the rear wing is evidently receiving not only downwash, but also upwash (outboard the first wing’s span). As a consequence, its lift angle may possibly be as low as when flying alone. As tested, it is somewhat increased, id est to 15 , probably because of non­uniformity of the flow meeting the rear foil.

The effect of canard surfaces with variations of leading sweep angle, dihedral and vertical position (13,f) shows the mutual interference effects of the two wings. As

Подпись: 2C = 2 ІСҐ
Подпись: (b) TANDEM <c) CANARD Подпись: dc^ dqf

/4° ^0.075

Figure 26. Lift angle of tandem, and canard wing arrangements.

Figure 27. Effect of sweep and dihedral on the total lift of a canard airplane configuration.

(13) Characteristics of wings in tandem:

a) Glauert, Tandem Theory, ARC RM 949 (1923).

b) Luetgebrune, Wind-Tunnel Tests, ZWB FB 1677.

c) Eiffel, Resistance de Г Air & Aviation, 1919.

d) Cover picture, Aeron Engg Review Nov. 1955.

e) LePage, “Wing” plus “Flap”, ARC RM 804 & 886.

f) Gloss, Effect of Canard Leading-edge Sweep and Dihedral on Close Coupled Aircraft, NASA TN D-7814 d.

g) Aviation Week, Jan. 13, 1975.

LIFT OF AIRPLANE CONFIGURATIONS

Подпись:

The lift of a complete airplane is determined by the characteristics of all its components and their mutual interactions as discussed throughout the previous chapters of this book. The total lift of the complete airplane determines its performance, especially with regard to takeoff, landing, maneuver, climb, stability and safety. This lift characteristic effects the capability of the airplane with regard to maximum gross weight and range and is determined by the configuration, the flaps and gear position. Since we are interested in the overall perform­ance, the complete airplane is considered in this chapter. The methods and equations needed for determining the performance characteristics of the airplane are given in Chapter I as these concepts are used throughout the book. While we are interested in the complete airplane system we will not attempt to present detailed procedures for establishing the total design. The complete aircraft can only be designed by considering all the factors discussed in the preceding chapters as well as drag as presented in the book “Fluid Dynamic Drag” (l, a) and the type of data given in (l, b). Of course, the propulsion system and mission are also important considerations in the design of the complete airplane.

1. CONFIGURATION TYPES

To arrive at the best airplane configuration to satisfy a given requirement there are hundreds of possibilities to be considered. Of these, the actual configurations that have been used and considered are numerous and varied. These include aircraft with various wing arrangements including single wings, biplanes, triplanes (2,a), swept wing, delta wings, full flying wings, swing wings and no wings at all. The type of wing, fuselage and empennage configuration that is best depends on many factors such as the powerplant, mission speed and payload. As a result it appears that to meet certain requirements the configura­tion selected by various designers are remarkably similar. For this reason a few typical airplane configurations with examples, as given on Table 1, are presented. The characteristics of any specific airplane can usually be found in (2,b, c).

(1) Complete aircraft design:

a) Hoerner, Fluid Dynamic Drag.

b) Wood, Aerospace Vehicle Design, Vol. 1.

(2) Airplane configurations:

a) Triplanes. As reported in “Heroes and Aeroplanes” (Grosset, New York 1966) a famous triplane was the ‘ Sopwith” flown in WWI (1917) using a 120 HP rotary engine. There was also a Fokker triplane, with a maximum speed of 100 mph and the Curtiss Model S-3 “Wasp” with a speed of 160 mph (1919).

b) Janes All World Aircraft, published yearly.

c) Mil А/С Specification Sheets.

LIFT OF AIRPLANE CONFIGURATIONS

General Aviation Aircraft. The characteristics of typical general aviation aircraft types are listed in Table 1, (2,b). These are generally fairly simple one or two engine aircraft with a single forward wing attached to a central fuselage with stability provided with a horizontal and vertical tail, as illustrated on figures 1 to 4. Both high and low wing configurations are found. In most cases, tractor – propellers are used to provide thrust for overcoming drag, although both underwing and aft jet engines are also used. General aviation aircraft are generally designed for speeds under 300 MPH with stalling speeds under 70 MPH for single engine airplanes of 6000 pounds or less. Also considered under the general aviation heading are business jets which have nearly the speed capability of transport aircraft.

(3) Aircraft design considerations:

a) , Swihart, Jet Transport Design, AIAA Selected Reprints VIII.

b) Olason, Performance of 747 Airplanes, JofA/C, Vol. 6 No. 6 ’69.

c) Olason, Aerodynamic Design Boeing 737, JofA/C, Nov., Dec. 1966.

(4) Special aircraft:

a) Strong, Sky Surfing with Low-speed Wings, Scientific American. Dec. 1974. See also, Fink, Sailwing of A = 5.9 NASA TN D-5047.

b) Motorless Flight Research, NASA CR-2315, 1973.

c) Mitcovich, “Man-Powered Flight: Achievements to Date” J А/С Vol. 7, No*3.

d) Gilbert, “Grunts, Groans & Gossamer Wings”, Air Progress, Apr. 1973.

а/с type

EXAMPLE

NO.

G. W..

W. E.

b

A

S c MAX

VS

VCRUISE

VMAX

FIGURE

ENGINES

FT.

HP or T

KTS

KTS

KTS

NO.

PER ENG.

GENERAL AVIATION

LIGHT SINGLE ENGINE CESSNA 150

1

1,600

990

33.5

7

160

0 100′

34

106

1©9

1

TWIN ENGINE

PIPER AZTEC

2

5,200

2» 042

37.2

6.7

206

0 250

61* 66

181

2

MEDIUM TWIN ENGINE

PIPER NAVAJO

2

6,500

3 900

40’8"

7.3

229

0 310

63* 70

218

226

3

JET TWIN ENGINE

CESSNA

2

11,650

6,454

43.9

7.4

260

2200

347

347

4

TRANSPORT

LIGHT

DOUGLAS DC-9-40

2

114,000

55,500

93.4

14,500

124

490

5

MEDIUM

BOEING 727-200

3

191,000

96,600

108

7.2

1560

14,500

129

449

521

6

HEAVY

LOCKHEED L-1011

3

426,000

234,300

155

42,000

139

498

538

7

BOEING 747

4

710,000

355,700

195.7

6.96

5500

47,000

140

503

556

8

MILITARY

FIGHTER – F16

GD – F16

1

21,500

13,800

31.8

3.6

280

M=2+

9

BOMBER

BOEING B-52H

8

488,000

185

8.6

4000 3^17,000

577 @

10

CARGO

LOCKHEED C-130

4

155,000

70,140

132.6

10

1745

0 4591

296

20,000′ 336

11

LOCKHEED C-5A

4

728,000

327,000

222.8

8.

6200

25°

460-480

12

SAILPLANE

CALIFORNIA al4

0

954

617

66.9

25.

173

0

34

13

TABLE 1

LIFT OF AIRPLANE CONFIGURATIONS

= HP * FLAPS & GEAR DOWN

Figure 4. Twin jet airplane for general aviation-Cessna.

Transport Aircrafts Nearly all commercial transport aircraft use turbine engines and most of these use jet engines with various ratios of engine to bypass air. It is convenient to classify the aircraft in terms of low, median and long range types with typical characteristics as given on Table 1. The short range transport types may use propellers;however, increasing numbers of aircraft are now powered with turbo fan engines. Almost all the median and long range transport aircraft have a large single swept wing forward and a normal type empennage for stability and control. The jet engines are generally placed below the wing or aft on the fuselage. Some examples of transport aircraft are given on figures 5 to 8.

The details of the philosophy used in the design of transport aircraft are given in (3,a, b,c). Here, reasons are given for the selection of the engine location, horizontal tail position, high lift devices and other factors that make up a successful transport type aircraft. The selection, design and evaluation of the wing and its flap systems for aircraft in this class are covered in Chapters XV and XVI as well as throughout this book.

LIFT OF AIRPLANE CONFIGURATIONS

AREA

5500 Sq. Ft.

AILERON AREA (INBD)

71.8 Sq. Ft.

SPAN

195 Ft. 8 In.

(OUTBD)

153.4 Sq. Ft.

BASIC ROOT CHORD TIP CHORD

449.68 In. 160.00 In.

HORIZONTAL TAIL

TAPER RATIO

.356 (Basic)

AREA

1470 Sq. Ft.

DIHEDRAL SWEEPBACK c/4

.245 (Ref)

SWEEPBACK c/4

37.5°

70

37.5°

SPAN

72 Ft. 9 In.

ASPECT RATIO (REF)

6.96

VERTICAL TAIL

FLAP

AREA

830 Sq. Ft.

SWEEPBACK c/4

45°

LEADING EDGE AREA

SPAN (HEIGHT)

32 Ft. 3 In.

(RETRACTED) TRAILING EDGE AREA (RETRACTED)

448 Sq. Ft. 847 Sq. Ft.

BODY

LENGTH

228 Ft. 6 In.

Figure 8. Heavy four engine transport-BAC 747.

LIFT OF AIRPLANE CONFIGURATIONS

Figure 7. Three engine air bus type-LAC 1011.

Military Aircraft. Examples of the characteristics of various types of military aircraft are also given on Table 1. These aircraft range in size and type with their performance capability being established by the require­ments of specific missions, figures 9 to 12. These aircraft are designed for such missions as training, low level attack, reconnaissance, interception, bombing and cargo.

Lift and its characteristics are of primary importance in the design of military aircraft. For instance, the maximum lifting characteristic is of primary concern in flight because of the need for high maneuverability. The need for high lift is thus of primary importance in the design of attack interceptor type aircraft. In the case of bomber and military transport type the requirement for high lift is similar to that of conventional aircraft, as discussed in Chapters I, VII and VIII.

LIFT OF AIRPLANE CONFIGURATIONS

Figure 9. General arrangement and dimensions-F-16.

Figure 10. Heavy bomber-B-5 2.

Special Aircraft. There are many other aircraft types to be considered and these can lead to some very unusual types of configurations. Such aircraft can range from configura­tions designed to operate at extremely high altitude to vehicles designed to operate only in ground effect. These special aircraft include: gliders for sport, sky surfing (4,a), high performance sailplanes with lift drag ratio as high as 45, (4,b). Also, man powered airplanes may be considered (4,b, c).

(5) Variable geometry aircraft:

a) Baals & Polhamus, Variable Sweep Aircraft, A & A Engr., June 1963.

b) Подпись:

LIFT OF AIRPLANE CONFIGURATIONS

Jones, R. T., New Shape for SST, A&A Engr. Dec. 1972.

LIFT OF AIRPLANE CONFIGURATIONS

ТЕ1- 10.5" ~

BEST GLIDE RATIO. 49:1 ® 49 KTS

LIFT OF AIRPLANE CONFIGURATIONS

Figure 13. Sail plane – California a-14, general arrangement.

Sailplane Design. The design of high performance sail­planes such as are illustrated in figure 13 requires extreme attention to detail to achieve lift drag ratios in the 40 range with corresponding low rates of sink, since for a glider

tan 6 = D/L (1)

Where 6 is the gliding angle and must be kept as low as possible for good performance. The drag is, of course, equal to the total profile and induced value. High performance sailplanes now use very high aspect ratio wings with airfoils designed especially for low drag and high lift coefficients (4,b). The frontal area is reduced to an absolute minimum by having the pilot in nearly a prone position. With these design features and attention to design details as discussed in (l, a), very high lift drag ratios are obtained.

Hang Gliders. There is a growing sport in the use of hang type gliders such as are illustrated on figure 14. Although hang type gliders date back to the beginning of aviation, the development of the light weight Rogallo delta type wing, as discussed in Chapter XVIII, and similar wings (4,a) covered with sail cloth has made possible a new and exciting sport. In the design of hang gliders the lift drag ratio is on the order of 5 with the low aspect ratio delta wing, and up to approximately 10 with the more advanced configurations using sail type wings. The importance of aspect ratio in reducing the induced drag is well illustrated here.

LIFT OF AIRPLANE CONFIGURATIONS

Figure 15. Swing wing bomber airplane-B-1.

LIFT OF AIRPLANE CONFIGURATIONS

Подпись: Figure 14. Hang type glider.

Variable Geometry Configurations. Most of the airplane types listed in Table 1 have at least trailing edge flaps and may thus be considered to be variable geometry type aircraft. Some of the vehicles listed have extensive systems of flaps and slats, so much so that it often appears that the wing is coming apart especially during landing. Because of extensive demands for lift and drag, especially between the high speed and landing conditions, even greater differ­ences in the aircraft configuration are required. As a result, aircraft have been designed with wings that pivot in such a way that we effectively have a variable sweep wing. An example of such an aircraft is given in figure 15 and the theory and reasons for such configurations are given in (5,a). A further unusual variable geometry concept is given in figure 16. Here the entire wing swings. This concept is discussed in (5,b) and offers some solid advantages in overall performance.

CONTROL OF STREAMLINE BODIES

Any rocket-powered vehicle can be controlled by proper deflection of the jet exhausting from the base. All other streamline bodies have to be steered by means of flaps (rudders, elevators, ailerons) attached to their tail end.

Flap Theory, as presented in the “control” chapter is based upon the concept of two-dimensional circulation. In slender wing and/or body shapes, circulation is obtained through a different flow pattern, id est around the lateral edges. Therefore, an approach to the effectiveness of a trailing-edge flap is required, different from the two – dimensional type as in conventional control surfaces. In a small-aspect-ratio wing, downwash is “complete” and maximum, at and past the trailing edge. Deflection of a flap from that edge is the equivalent of placing a same-size flap behind the “wing” (at some small distance) within a field of flow having a downwash angle £ = — oC. The lift produced by the flap is thus expected to be

ACl= (S^/S)(dCL /doc )^cA (50)

where “f” indicates “flap”, and where the flap’s lift-curve slope corresponds to its aspect ratio b^/c^. If someone objects to this concept saying that a flap linked to the trailing edge of a body does not permit circulation to develop, it can be said that circulation does get around the lateral edges of the body (and of the flap).

Airplane Ski. There is very little information available regarding the effect of what we may call trailing-edge flaps used in combination with streamline or other slender bodies. The bent-up trailing edge of the airplane ski in figure 43, can be considered to be a flap, however. Inter­pretation is as follows:

a) The linear lift curve slope cannot very well be higher than indicated by equation 3. Based on plan-form area, the slope may thus be

dCL /doc = 0.2 (0.0274) = 0.0055 where 0.2 = aspect ratio.

b) On the basis of (a) the non-linear component is found to be in the order of

CN2 =3.3 sin2 oC

c) Combining the moment derivative dC^ /dCL = 0.0020 with the lift curve slope as in (a), the neutral point is found to be 0.0020/0.0055 = 0.36 of the length-/, ahead of the hinge axis.

The cross force coefficient as in (b) may seem to be very high. There is a number of similar values presented, how­ever, in Chapter VII of “Fluid-Dynamic Drag”. It appears that low-aspect-ratio sharp-edge flat plates (and similar shapes) are very effective in producing the cross-flow type of lifl. As mentioned before in this chapter, the coefficient should not be expected to be identical with the drag coefficient at oC = 90° , which is CDo ~ 2.

CONTROL OF STREAMLINE BODIES

+ FROM OTHER SOURCES

Figure 41. Statistical evaluation of the stabilizing effectiveness of fins attached to the end of streamline bodies.

Bent-Up Trailing Edge. For all practical purposes, bending up the trailing end of the ski, does not affect the non­linear lift component. The constant lift increment as seen in figure 42, can be expected to be the same as that due to a flap. Depending upon the flap’s aspect ratio b/c^, it contribution to the lift of the ski will be

A CL = (Ср Ц) (dCL /doc)/ = (h/O (dCL /do£) (55)

where Cp. = chord length of the flap, and h = c^cf = height to which the trailing edge is bent up. The lift-curve slope of the flap can be approximated by

dor/dCL =11+ 20/A ^

dCL/doc = 1/(11 +20 Cp/b) (56)

For the ski in figure 43, the equivalent flap chord is approximately Cp = 0.5 b, os that dCL /doc = 0.048. For hЦ = 0.062, a ACl = 0.062 (0.048) 180/ir =0.17, is thus obtained, while the experimental differential is be­tween 0.15 and 0.16.

(36) As expllined in the first longitudinal chapter, the horizontal tail of an airplane is cut in two (so to speak) by the fuselage wake.

A Radio-Controlled Bomb is shown is figure 44. Deflec­tion of the rudder produces differentials of lateral force and yaw moment, essentially independent of the angle of sideslip (plus/minus 20° ) and the Mach number (M = 0.2 to 0.5). For practical purposes, the variations are also linear in /5 and <f, so that the derivatives tabulated in the illustration, give a full description of the aerodynamic characteristics.

Analysis is as follows:

Подпись:a) The moment arm of the lateral force due to rudder deflection is 0.007/0.0015 = 0.47 of the body length, aft of the CG. The center of force coincides with the geo­metric center of the flaps.

Подпись:b) Assuming the effective aspect ratio of the rudder flaps (behind hinge line) to be A_p = bT/c^ = 5.3, the lift curve slope may be (dQ Idoc)^ = 0.07. Using equation 50 the effectiveness may then be

dCyJdtf = (Sp /S0 )(dCL /doC =

0.22 (0.07) = 0.015 (57)

Подпись: which is as tested.Figure 43. Longitudinal characteristics of the model of an airplane ski (34,b).
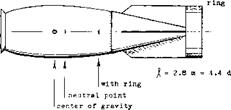
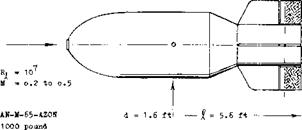
CONTROL OF STREAMLINE BODIES

= 1.5(Ю)6

model scale 1 to 4 tested in open wind tunnel

dCL /dcK = O.010

= O.013 with ring

Figure 42. Static stability (position of neutral point) of 1000 kg bomb, tested in the Junkers wind tunnel (39,b).

There are certain assumptions in (b) which have not been confirmed yet by experiment or analysis. The advantage of equation 57 over the usual method of calculating effectiveness (as presented in the “control” chapter) is the fact that the tail contribution to dCy ld/*> does not have to be known. The fins are considered to be part of the body.

(38) Lifting characteristics of rocket vehicles:

a) Kelly, “Scout” with Flare, NASA TN D-794 & 945 (1961).

b) Potter, Multiple Fins, J Aeron Sci 1955 p 511.

Airship Rudder. Directional characteristics of the experi­mental hull shape in figure 38 are discussed in the section dealing with “stability”. As far as the rudder is conserned, its deflection changes the yaw moment by a constant amount (independent of the angle of yaw); thus A(dCy/d<f ) and A (dC^dcf constant. This means

that the rudder changes the body’s basic circulation; re­garding cross flow, the rudder area is too small to show an effect. As seen in part C of the illustration, force and moment increase in proportion to sinrf, up to some 20° deflection. The center of force, corresponding to А хЦ = 0.003/0.006 = 0. 50, is as indicated in the drawing, some­what ahead of the rudder, withing the wedge-shaped tail end of the hull. Considering the body to be a low-aspect – ratio wing, the rudder is a “flap”. Deflection of this flap evidently increases the longitudinal circulation around the body. As in flapped control surfaces (such as a horizontal tail, for example) we have an effectiveness ratio based on the linear derivative (dCy ДІД):

(dCy/dcf )l(dCyld/3) = d^ldd = 0.36

This looks like a very high value for the rudder area ratio S^./(d-f) = 1.3%. However, it is shown in Chapter IX, that the effectiveness ratio increases as the aspect ratio is reduced. Considering the hull’s thickness ratio dЦ = 0.12, to be the aspect ratio, the ratio of 0.36 can be under­stood.

“Akron”. Another example for this method of analysis, is the airship “Akron”:

7

= 785 ft

length overall

V

= 7.4(10)b

ft3 displacement volume

d

= 130 ft

maximum diameter

= 7400 ft2

exposed horizontal fins

Sf

= 1100 ft2

elevator, aft of hinge line

bH

= 1.09 d

span of fins

The. lift derivatives (based on d2) as tested on a 1/40 scale model (TR 432) are:

dC {d /doc: = 0.026 due to angle of attack

dC /dS = 0.006 due to elevator deflection

For the flap-area ratio S^/d2 = 1100/1302 = 6.5%, for bw /cf = 10, and a lift-curve slope (dCL /do£)p ■= 0.085, equation 50 yields a dCLd /dcT = 0.065 (0.085) = 0.0055, which is close to that which was tested around zero angle of attack.

CONTROL OF STREAMLINE BODIES

M up to 1.0, at sea level

Turning. It is described in the section dealing with “sta­bility”, that airships are not really stable. The plot of C^CJ as in figure 38, shows that balance and stability of the airship (with control surfaces kept neutral) both in pitch and ir yaw, is obtained at CLb or Cyb = 0.18, where oc or ^ =26°. Conditions of an airship hull when turning are different, however, as explained in context with figure 28. For a difference in the angle of wind against body axis, between the center of buoyancy and the stern, say of 15°, the force in stern and fins may be doubled. This means a tremendous “resistance” against turning.

derivatives as tested (39,d)

dCnn/d(3 – о.013 acnj/d£ = о. 007

dCyVdp * o.070 dCYyd& » O.015

coefficients based on frontal area

Figure 44. Directional characteristics of a radio-controlled bomb, tested (39,d) full scale in a wind tunnel.

(39) Fin-stabilized ‘‘flying” bodies:

a) Junkers, Fin-Stablilized Tank, Dct D-6548 (1940)

b) Junkers, Bombs, Dcts D-6549 & 6573 (1940).

c) Kempf, In Towing Tank, NACA TM 1227.

d) Pearson, 1000 Pound Bomb, NACA W’Rpt L-131 (1944).

(43) Control of reentry-type vehicles:

a) Paulson, Cruciform Delat, NACA W’Rpt L-734.

b) Paulson, Trailing Edge Control, NASA Memo 4-11-59L.

(44) Comparison between equations (2) and (21) indicates that in a spheroid (or ellipsoide) the positive force in the forebody and the negative force in the afterbody, each has a moment arm equal to 1/3 of the body length.