Category Pressure and Temperature Sensitive Paints

Recipes of Typical Pressure and Temperature Sensitive Paints

Recipes of Three PSP Formulations

(1) Ru(ph2-phen) or Ru(dpp) in RTV

Ingredients: 4 mg of Bathophen Ruthenium Chloride [Ru(ph2-phen) or Ru(dpp)], 25 ml of dichloromethane, 7.5 ml of GE RTV 118, 2 g silica gel particles.

Directions: Dissolve Ru(ph2-phen) in the solvent dichloromethane, add silica gel particles and then GE RTV 118, and stir until fully dissolved.

(2) PtTFPP in RTV

Ingredients: 6 mg of platinum meso-tetra(pentafluorophenyl)porphyrin (PtTFPP), 25 ml of dichloromethane, 7.5 ml of GE RTV 118, 2 g silica gel particles.

Directions: Dissolve PtTFPP in the solvent dichloromethane, add silica gel particles and then GE RTV 118, and stir until fully dissolved.

(3) PtTFPP in FEM (NASA Langley)

Ingredients: 5.3 mg platinum meso-tetra(pentafluorophenyl)porphyrin (PtTFPP) (120 ppm), 12 g Polytrifluorethyl-co-isobutyl methacrylate (TFEM/IBM), 37.5 g Solvent DuPont 3602S, 3.6 g Solvent DuPont 3979S or 3696S.

Directions: Dissolve the TFEM/IBM in the DuPont solvents, add PtTFPP, and stir until dissolved, and adjust the viscosity of the solution to 10.5 cp with the 3602S solvent. Allow the paint to cure at the room temperature for about 20 minutes before heating to 65°C for one hour.

Recipes of Two TSP Formulations

(1) Ru(bpy) in Clear Coat

Ingredients: 6 mg of tris(2,2’-bipyridyl) ruthenium [Ru(bpy)], 20 ml of automobile Urethane Clear Coat (DuPont ChromaClear), 5 ml of activator, 10 ml dichloromethane.

Directions: Dissolve Ru(bpy) in the solvent dichloromethane, sonicate for 5 minutes, add urethane clear, shake and sonicate. Just before painting (within 5 minuets) add the activator, shake and sonicate for 1 minute. Acetone is used as a solvent to clean up the paint.

(2) EuTTA in Dope

Ingredients: 12 mg Europium (III) Thenoyltrifluoroacetonate (EuTTA), 20 ml model airplane dope, 20 ml dope thinner.

Directions: Mix EuTTA with the dope thinner, shake and then sonicate for a few minutes. Add the dope, shake and sonicate. Acetone is used as a solvent to clean up the paint.

[1] + £exp( – Enr/RTrtf)

Note:

[3] ax and ay are the standard deviations of least-squares estimation in the image registration or camera calibration.

[4] The factor for the sensitivity coefficient is defined as (p=KT/(T-Tref).

Calibration Apparatus

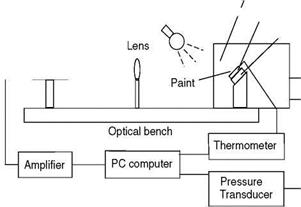
For PSP, the relationship between the luminescent intensity (or lifetime) and air pressure is determined by calibration. Figure A1 shows a simple apparatus for calibration of PSP (Burns 1995). A PSP coating is applied to an aluminum block (1.5X1.5X0.625 cm) that is thermally anchored using high thermal conductivity grease to a Peltier heater/cooler controlling the surface temperature of the block. A thermometer inserted in the aluminum block near the painted surface is used to measure the temperature of the paint sample. The PSP sample on the block is placed inside a pressure chamber with an optical access window. Pressure inside the chamber is controlled and measured using a pressure transducer. An illumination light, typically from a UV lamp, LED array or laser, passes into the chamber through the window and excites the paint sample. The luminescent emission from the paint sample is collected with a lens, filtered by a long-pass or band-pass optical filter, and projected onto a photodetector like a photodiode, photomultiplier tube (PMT) or CCD camera. The photodetector output over a range of pressures and temperatures is acquired with a PC, where the dark current is subtracted from the intensity output. Therefore, a relation between the luminescent intensity and pressure is determined over a range of temperatures; the calibration data are typically fit using the Stern-Volmer equation for different temperatures. For lifetime or phase calibrations, a pulsed or modulated excitation light should be used.

The set-up in Fig. A1 can be used for TSP calibration when the surface temperature of a TSP coating on the aluminum block is varied over a range of -15 to 150oC by controlling the Peltier heater/cooler while the chamber pressure is kept constant. Thus, a calibrated relation between the luminescence intensity and temperature is obtained, which is typically represented by the Arrhenius plot over a certain temperature range. Note that an oven for calibrating fluorescent temperature sensors was described by Crovini and Fernicola (1992). This simple apparatus can be adapted for TSP calibration down to cryogenic temperatures (Campbell et al. 1994). In this case, a TSP sample is thermally anchored to a copper bar cut at an angle of 45o at its top that rests in a container filled with liquid nitrogen. The sample temperature near the temperature of liquid nitrogen can be achieved due to heat conduction from liquid nitrogen to the sample through the copper bar. To prevent condensation of moisture from forming on the paint sample, the sample is purged with dry nitrogen gas. Using this apparatus, Campbell et al. (1994) examined the temperature dependencies of the luminescent intensity for many TSP formulations.

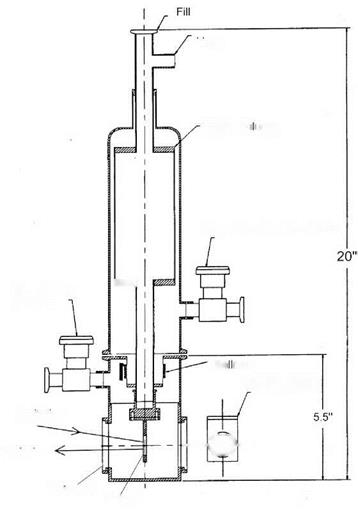
Figure A2 shows a cryostat device designed by Erausquin (1998) specially for calibrating PSP at cryogenic temperatures. Liquid nitrogen contained in the buffer volume is used to cool the device to cryogenic temperatures. A bellows is introduced between the buffer volume area of the cryostat and the test chamber area where a PSP sample is placed. Thus, the liquid nitrogen storage portion is separated from the actual test chamber into which the test gas (a mixture of oxygen and nitrogen) is introduced. Two valves are added to the lower portion to allow for filling and evacuating the test gas. There is one window on the lower portion of the test chamber allowing optical access to the PSP sample mounted on a copper sample holder. The sample holder is attached to the base of the lower tube leading from the buffer volume, allowing liquid nitrogen to directly contact with the sample holder. An aluminum sample block with a PSP coating on one surface is attached to the sample holder with an aluminum bracket and screws. The sample temperature, which is controlled by a temperature controller, is measured using a temperature sensor located above the sample holder. Absolute pressure in the test chamber is measured with an absolute pressure transducer. The luminescent emission from the paint is collected by a large lens and projected onto a PMT through a long-pass glass/interference optical filter; then, the PMT output signal is acquired with a PC. Clearly, this device can also be used for calibrating cryogenic TSP.

Vacum chamber

Подпись: Detector FilterПодпись: To vacum pump ►Подпись:Calibration ApparatusIllumination source / A|uminum block

Подпись: Y

Peltier heater

vent


Buffer Vo ume


Upper Chamber Evac Valve


mm


Calibration Apparatus

Be ows


Sample Holder


Excitation


-a-


Emission


Calibration Apparatus

Calibration Apparatus

Подпись: Window

Sample

Fig. A2. Calibration chamber for cryogenic PSP and TSP. From Erausquin (1998)

. Hot-Film Surface Temperature in Shear Flow

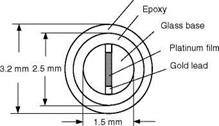
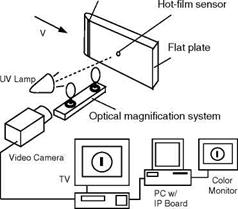
Through an optical magnification system, a very high spatial resolution can be achieved in tSp measurements on a small object. Liu et al. (1994a) used EuTTA – dope TSP to measure a surface temperature field on a commercial flush-mounted hot-film sensor (TSI 1237) in a flat-plate turbulent boundary layer. As shown in Fig. 10.32, the sensor had a 0.127-mm streamwise length and a 1-mm spanwise length. TSP was applied to the hot-film sensor by dipping. Figure 10.33 shows the experimental set-up used for this study. The sensor was mounted flush with the surface of a flat plate with a 1:6 elliptical nose (the leading edge) that was installed in a low-speed blow-down wind tunnel at Purdue University. The sensor was located
0.37 m downstream from the leading edge of the plate. The freestream velocity was 26 m/s in the experiments. A roughness band near the plate leading edge was used to produce artificial flow transition such that the boundary layer was fully turbulent downstream. The sensor was operated at a low overheat ratio of 1.07, where the cold resistance of the sensor was 5.14 Q. The luminescent intensity images were obtained using a CCD video camera through an optical magnification system. The streamwise and spanwise surface temperature distributions were computed from the luminescent intensity images using a priori calibration relation.

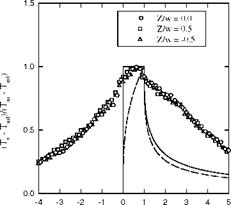
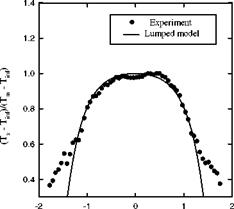
Figure 10.34 shows the non-dimensional streamwise surface temperature distributions at three spanwise locations, where Z is the spanwise coordinate, L is the streamwise length, w is the half-span width, and Tm is the maximum surface temperature. Liu et al (1994a) also derived the analytical solutions for a uniform – temperature (UT) film and uniform heat source (UHS) film on an adiabatic wall in shear flow for a comparison with TSP measurements. These solutions are also plotted in Fig. 10.34 as references. The temperature distributions on the TSI hot – film sensor appeared to be nearly symmetric and largely deviated from the theoretical distributions of the UT and UHS films on an adiabatic wall. This deviation was mainly due to the dominant effect of heat conduction to the glass substrate and the streamwise diffusion effect (the finite Peclet number effect) that were neglected in the analytical solutions. This result indicated that the TSI hot – film sensor had a large heat loss to the substrate that might limit the frequency response of the sensor. The measured spanwise temperature distribution on the TSI hot film is shown in Fig. 10.35 along with a theoretical temperature distribution given by a simple lumped model for comparison. As shown in Fig. 10.35, the theoretical distribution was in good agreement with the experimental data for the sensor in a region of |z|/w <1.2. Outside of this region, the theoretical distribution underestimated the surface temperature since the lumped model neglected heat conduction into the substrate along the spanwise direction at the tips of the sensor.

Stainless steel tube

. Hot-Film Surface Temperature in Shear Flow

Fig. 10.32. Configuration of the TSI 1237 hot-film sensor

. Hot-Film Surface Temperature in Shear Flow

Roughness band

. Hot-Film Surface Temperature in Shear Flow

VCR

Fig. 10.33. Experimental set-up for TSP mapping of a hot-film sensor in a flat-plate turbulent boundary layer. From Liu et al. (1994a)


. Hot-Film Surface Temperature in Shear Flow

(X – Xl)/L

Fig. 10.34. Streamwise distributions of the normalized surface temperature of the TSI 1237 hot-film sensor operating at an overheating ratio of 1.07 in a flat-plate turbulent boundary layer. The analytical solutions for the uniform-temperature film (solid line) and uniform heat source film (dashed line) on an adiabatic wall are also plotted for comparison. From Liu et al. (1994a)


. Hot-Film Surface Temperature in Shear Flow

Z/w

Fig. 10.35. Spanwise distribution of the normalized surface temperature of the TSI 1237 hot- film sensor operating at an overheating ratio of 1.07 in a flat-plate turbulent boundary layer. From Liu et al. (1994a)


And Heat Transfer Measurements

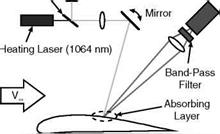
Campbell et al. (1998) developed a heat transfer measurement technique by combing TSP and a laser spot heating unit into a single non-intrusive system. After an infrared laser was used to generate a local heat flux into a surface,
convection heat transfer was determined from the surface temperature response measured using TSP. Figure 10.23 is a general layout of the laser spot heating heat transfer system with TSP (LSH-TSP) that consisted of three sub-systems, one for temperature measurement and two for surface heating. The temperature measurement system was composed of an excitation laser, TSP, a band-pass filter and a photo-detector (PMT). The role of the temperature measurement sub­system was to measure the luminescent intensity and thus the surface temperature at a target point. The heating system was composed of a heating laser, an insulating layer and an absorbing layer, which created a local heat flux to the surface that was necessary to make heat transfer measurements. Note that Mayer et al. (1997) proposed a similar technique that used laser heating and an IR camera (rather than TSP) for wall-shear stress measurements based on the relationship between local heat transfer and shear stress.

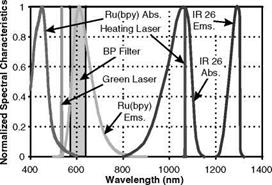
The temperature measurement sub-system was very similar to the laser scanning TSP system. A solid-state, diode pumped Nd:YLF laser with a frequency doubling crystal produced a 50-mW beam at 532 nm, which served as an excitation source for TSP. This beam was reflected off of a glass slide to reduce the power to approximately 2 mW. Excitation of TSP at this power level resulted in a significant luminescent signal while preventing excessive photodegradation of TSP by the excitation laser. The excitation beam was focused at a point of interest on the model surface. The luminescent emission from TSP was gathered by a collection lens and focused through a band-pass filter to a PMT. The PMT detected the luminescent intensity of TSP that was then converted to temperature using a priori TSP calibration relation. The heating sub­system was composed of a solid-state, diode pumped Nd:YLF laser which produced a 200-mW beam at 1064 nm (infrared) and optics to direct the beam at the surface. This wavelength was much longer than both the absorption and emission bands of a Ru(bpy)-based TSP used in their research, and any reflected IR radiation was effectively filtered by a band-pass filter. This beam was focused onto the absorbing layer on the surface that absorbed the radiation and heated up.

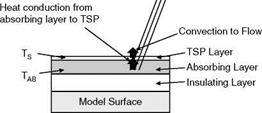
The absorbing layer was another important element of this system. Figure 10.24 shows an idealized model surface that was first coated with an insulator and then a thin absorbing layer. The material of the absorbing layer absorbed radiation from the heating laser, causing the temperature of the absorbing layer to rise. The temperature gradient between the absorber and the TSP layer on the top resulted in heat conduction from the absorber to TSP. The heat generated in the absorbing layer and conducted through TSP was released through convection heat transfer at the TSP surface. Two absorbing layers were investigated. The first was a dark surface that absorbed IR radiation simply due to its color. Several dark surfaces such as fine-grit polishing paper and magnetic tape proved to work well as an absorber. The second option was an IR dye (IR26 from Lambdachrome Laser Dyes) that absorbed strongly at 1 |jm. A small portion of the absorbed energy was re-emitted at a longer wavelength, but the majority of the energy went into heating up the absorbing layer. The laser dye can be mixed with a polymer applied as a separate layer, or mixed directly with TSP. Since adding the IR dye to TSP did not change the temperature sensitivity of TSP and it also simplified coating process, this option was chosen in their experiments.

As shown in Fig. 10.23, the excitation and heating lasers were combined into a single, co-linear beam using a glass slide. The combined beam was focused at a target location on the model surface using a single lens. Since the optical path length between the focusing lens and the model surface varied during experiments, the optical system was designed with a large depth of field. In practice, alignment of the two spots over the whole surface of interest was ensured through visual inspection of a scan grid. Figure 10.25 shows the spectral arrangement of the components of the LSH-TSP system. The emission spectra of the lasers and IR dye did not overlap with the emission spectrum of the Ru(bpy)- based TSP.

Подпись:Подпись:Подпись: GlassПодпись: PMTПодпись: ScanningПодпись: Painted ModelAnd Heat Transfer MeasurementsП

And Heat Transfer Measurements

Heating Laser

And Heat Transfer Measurements

Fig. 10.24. Idealized surface model for the LSH-TSP system. From Campbell et al. (1998)


And Heat Transfer Measurements

Fig. 10.25. Spectral arrangement for the LSH-TSP system. From Campbell et al. (1998)


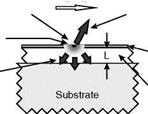
Campbell et al. (1998) calculated the convection heat transfer coefficient hc from a transient temperature history of the heated surface. Initially, temperature on the whole surface was equal to the ambient temperature. Activating the heating laser caused local temperature to rise and the luminescent intensity of TSP to decrease. The luminescent intensity of TSP continued to decrease until it reached a steady state when the input heat flux by the heating laser was balanced by the heat loss due to convection in flow and conduction into the model. A similar cycle was associated with the surface temperature response upon deactivation of the heating laser. In this case, the surface temperature decreased and the luminescent intensity increased until the surface temperature was equal to the ambient temperature. A simple lumped capacitance model of the surface indicated that the time constant of the cooling cycle was a function of the heat transfer coefficient. Since the heating laser was turned off, the solution was independent of the input heat flux, eliminating one unknown in data reduction. Figure 10.26 is a schematic of the surface used for a transient analysis of the cooling surface. The lumped capacitance analysis gives a solution for a temporal evolution of the surface temperature Ts at a heated spot

(


в

в


And Heat Transfer Measurements And Heat Transfer Measurements

(10.1)


where the time constant is defined as Th = pcL/hc, the constant C = k/pcL2 is a correction term for heat conduction to the insulating layer, Bi = hcL/k is the Biot number, Ti is the initial surface temperature (the ambient temperature), and Г is the freestream temperature. In Eq. (10.1), p, c, and L are the density, specific heat, and thickness of the insulating layer, respectively.


And Heat Transfer Measurements

V, T


Heat Loss (Convection) – h(ts – T.)


Heated Spot


Measurement

Location

Heat Loss (Conduction)

dT – k dn


TSP and Absorber

Insulating

Layer


Fig. 10.26. Schematic of transient heat transfer analysis. From Campbell et al. (1998)


And Heat Transfer Measurements

In order to determine the convection heat transfer coefficient hc, the surface was first heated to a steady state and then the surface temperature response was recorded after the heating laser was turned off. The natural log of the non­dimensional temperature was plotted versus time and the slope of the resulting curve was evaluated using the following relation

(10.2)

The slope was a sum of two terms: the time constant Th that was a function of the heat transfer coefficient hc and the heat conduction term C. The conduction term C was experimentally determined for a given test configuration by making flow – off measurements. In such a case, the convection heat transfer due to natural convection was several orders of magnitude lower than the heat conduction into the model surface. Hence, the surface temperature response gave the conduction term at a location, and the heat conduction term was equal to the log-slope of the non-dimensional temperature response for a flow-off scan. This value was used to adjust the log-slope of flow-on scan data to account for the heat conduction effect.

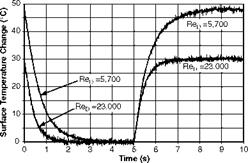
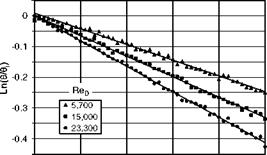
According to the transient model, higher heat transfer would be expected to produce a small time constant Th. Figure 10.27 shows typical responses of the surface temperature to a pulsed laser heating at two different Reynolds numbers in an impinging jet. The steady-state temperature was higher at lower Reynolds numbers due to lower convection heat transfer. At higher Reynolds numbers, the steady state was reached much sooner and the time constant was smaller due to higher convention heat transfer. Figure 10.28 shows the natural log of the non­dimensional temperature response в/ ві for the first 0.5 seconds of the cooling cycle. The log-plots exhibited a linear behavior and the increased slope (the absolute value) with the Reynolds number, and demonstrated the sensitivity of the slope to the heat transfer rate. In preliminary tests, using the LSH-TSP system, Campbell et al. (1998) measured the Nusselt number distributions in an impinging jet at different Reynolds numbers and gave reasonable results.

And Heat Transfer Measurements

Fig. 10.27. Surface temperature response to pulsed laser heating in an impinging jet. From Campbell et al. (1998)

And Heat Transfer Measurements

0 0.1 0.2 0.3 0.4 0.5

Time (s)

Fig. 10.28. Natural log-plot of the non-dimensional surface temperature response at three Reynolds numbers in an impinging jet. From Campbell et al. (1998)

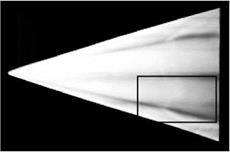
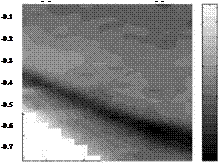
Campbell et al. (1998) presented application of the LSH-TSP system to more complex flows. Quantitative measurements were made on a 75o swept delta wing model using the LSH-TSP system in a region that was also visualized by TSP with a CCD camera at the same conditions, as shown in Fig. 10.29a. Figure 10.29b shows a map of the heat transfer coefficient hc in this region at the angle of attack of 25o. Another experiment was performed for quantitative heat transfer

measurements in an intersection of a strut and a wall that often occurred in air vehicles (e. g. the wing/body and stator/wall junction). Figure 10.30 shows schematically the primary horseshoe vortex developed around the base of a strut that influences the heat transfer distribution on the wall. A strut with a NACA 0015 airfoil cross-section and a 48-in chord was positioned vertically in the Boeing subsonic wind tunnel at Purdue University and it spanned the 48-in height of the test section. The flow velocity was about 90 ft/s and the Reynolds number

was about 2.5 millions based on the chord. Another relevant length scale for this flow was the strut thickness of 7.2 in, and the Reynolds number based on it was about 350,000. The LSH-TSP system was used to measure the heat transfer rate on the large model in a large wind tunnel since heating the entire wall would be impractical. Figure 10.31 shows a map of the Stanton number on the surface around the strut. The heat transfer results were computed using the transient heat transfer model with heat conduction correction. The location on the surface was normalized by the approaching boundary layer displacement thickness S* = 0.5 in. The largest variation in heat transfer appeared near the leading edge of the strut. There was a region of decreased heat transfer due to decelerating flow and local flow separation caused by the presence of the strut. Near the strut, heat transfer was enhanced by the primary horseshoe vortex that transported fluid outside the boundary layer to the wall.

Подпись:Подпись: 0And Heat Transfer Measurements

Подпись: (b) And Heat Transfer Measurements Подпись: Fig. 10.29. (a) TSP visualization with a CCD camera, and (b) quantitative heat transfer measurements using the LSH-TSP system on a 75-degree swept delta wing at the angle of attack of 25o in low-speed flow. From Campbell et al. (1998)

(a)

Shock/Boundary-Layer Interaction

Liu et al. (1995a) used EuTTA-dope TSP to measure the heat transfer rate in several typical shock/turbulent-boundary-layer interacting flows: swept-

shock/boundary-layer interaction, flows over rearward – and forward-facing steps, and incident shock/boundary-layer interaction. TSP allowed quantitative measurements of heat transfer in complex 3D separated flows induced by shock/boundary-layer interaction. The experiments were carried out in a blow­down supersonic wind tunnel with a test cross-section of 44×56 mm at Purdue University. The test models were mounted on the floor of the test section that was about 33 cm downstream of the nozzle throat. The tests were performed at Mach 2.5, the total pressure of 2.9 atm. and the total temperature of 295 K. The incoming boundary layer on the floor of the test section was fully turbulent. The incoming turbulent boundary-layer thickness (S) in the test section was about 4.6 mm and the Reynolds number ReS based on it was 1.3×10⁵. A thin insulating layer covered the aluminum test section floor and surface of aluminum models that were thermally attached to the floor using high thermal conductivity grease. The insulating layer was composed of a 0.07-mm thick Scotch brand packing tape and 0.05-mm thick white Mylar film. TSP was applied on the surface of the white insulating layer. The purpose of using the insulating layer was two-fold. First, light scattering from the white layer significantly enhanced the luminescent intensity viewed by a camera. Secondly, the thin insulating layer produced a sufficient temperature difference across it such that a simple data reduction model could be used to calculate the heat transfer rate. Two UV lamps were used to excite the paint. A steady-state heat transfer model was used to calculate the heat flux qs from the measure surface temperature, and then the Stanton number St = qs/p„u„cp(Taw – Ts) was

evaluated, where p«, and u^ are the freestream density and velocity of air flow, respectively, cp is the specific heat of air at a constant pressure, and Taw is the adiabatic wall temperature.

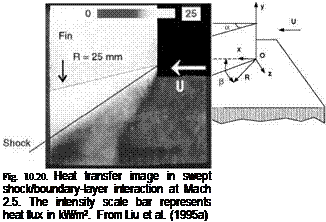
An example was swept-shock/turbulent-boundary-layer interaction. As shown in Fig. 10.19, an attached planar shock generated by a sharp fin interacted with the incoming turbulent boundary layer on the floor, which produced complicated 3D flow separation. Previously, Settles and Lu (1985) suggested that except in the inception region near the leading edge of the fin, local physical quantities such as pressure and heat transfer rate on the floor approached a quasi-conical symmetrical state in which these quantities remained invariant along a ray from a virtual conical origin. Several heat transfer measurements were made in the quasi­conical symmetry region using conventional heat transfer sensors distributed discretely along a fixed arc (Lee and Settles 1992; Rodi and Dolling 1992). Here, TSP was used to obtain a global heat transfer map in the inception region where the flow lacked the presumed quasi-conical symmetry and the heat transfer rate significantly changed along the radial direction. Figure 10.20 shows a typical heat transfer image in the inception region of the 10o fin at M= 2.5 and Res = 1.3×10⁵. In the image, bright and dark regions correspond to high and low heat transfer, respectively, and the intensity scale bar represents the heat transfer flux in kW/m2. The viewing polar angle of the camera was about 60o. The arrow indicates the

incoming flow direction and the length of the arrow in the image corresponds to 10 mm in the actual length scale in the streamwise direction.

Подпись: Sharp fin A
Подпись: Fig. 10.19. Fin geometry and coordinate system in swept shock/boundary-layer interaction. From Liu et al. (1995 a)
Shock/Boundary-Layer Interaction

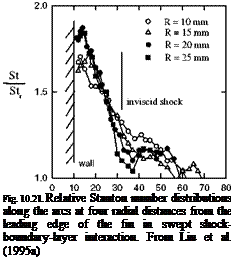
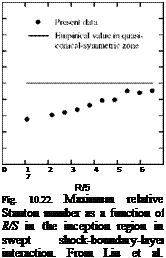
The primary separation line was identified, and the highest heat transfer region was located in the neighborhood of the fin. Figure 10.21 presents the distributions of the relative Stanton number St/Str along four circular arcs with different radial distance R from the leading edge of the fin, where Str is the reference Stanton number in the undisturbed boundary layer upstream of the leading edge. As R increased, the distributions of the heat transfer rate tended to approach an asymptotic profile near the fin while the asymptotic tendency was not quite evident near the inviscid shock location. When the maximum relative Stanton number StmJStr was taken as a characteristic quantity, as shown in Fig. 10.22, it was found that StnaJSt r increased with the non-dimensional radial distance R/S and approached the value measured previously using thin-film sensors by Lee and Settles (1992) in the quasi-conical symmetry region. Therefore, the asymptotic behavior of the heat transfer rate measured by TSP in the inception region supported the concept of the quasi-conical symmetry. Heat transfer measurements were also made using TSP for other shock/boundary-layer interactions such as rearward and forward facing steps and incident shock/boundary-layer interaction; comparisons of TSP measurements with previous results obtained by conventional techniques for these flows were discussed by Liu et al. (1995a).

Подпись: Fig. 10.21. Relative Stanton number distributions along the arcs at four radial distances from the leading edge of the fin in swept shock-boundary-layer interaction. From Liu et al. (1995a)
Подпись:Подпись:

Подпись: 3.0 2.8 2.6 2.4 2.2 2.0 1.8 1.6 1.4 1.2 1.0
Подпись: St
Подпись: Str

P (degree)

Impinging Jet Heat Transfer

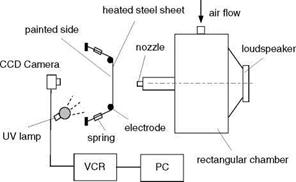
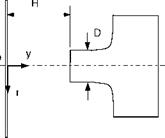
Using TSP complemented with hot-wire sensors and smoke visualization technique, Liu and Sullivan (1996) studied the relationship between heat transfer and flow structures in an acoustically excited impinging jet. Figure 10.14 is a schematic of a variable-speed air jet facility and the coordinate system. The facility consisted of two settling chambers. Air from a motor-driven centrifugal blower entered the first rectangular settling chamber (254x533x483 mm) and then passed through the second chamber that actually was a 178-mm long cylinder tube of a 48 mm diameter. A 25-mm long contoured nozzle was mounted at the end of the tube. The nozzle exit diameter D was 12.7 mm and the contraction ratio was

5.2. A loudspeaker attached to the opposite side of the first chamber to the nozzle induced organ-pipe resonance in the chamber, producing axisymmetric and plane – wave excitation at the jet exit. To measure the local convection heat transfer coefficient, air jet impinged on a 0.0254-mm thick, 115-mm wide and 130-mm long stainless steel sheet that was heated by passing an electric current of 25

Amperes. The sheet was stretched tautly by springs over two 12.5-mm diameter aluminum rods that also served as electrodes, and deformation of the sheet due to jet impingement was negligibly small. Given the uniform heat flux Qs from the heated sheet surface and the measured surface temperature Ts of the heated sheet, the convection heat transfer coefficient h = Qs/(Ts – T^ ) and the Nusselt number Nu = hD/k were calculated, where T^ was the ambient temperature and к was the thermal conductivity of air.

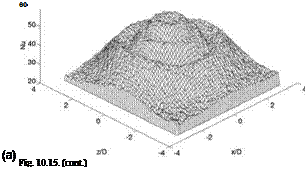
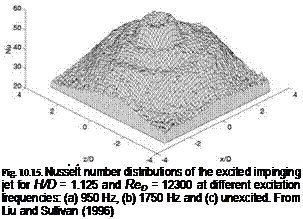
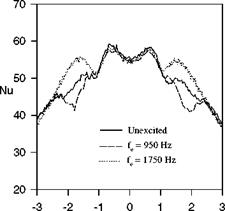
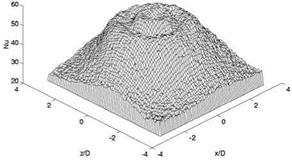
To measure the surface temperature Ts, EuTTA-dope TSP (about 10 |jm thick) was coated on a 0.05-mm thick white Mylar film attached on the backside (relative to the jet impingement side) of the stainless steel sheet. A UV lamp was used to illuminate TSP. The luminescent intensity images were taken by a CCD viedo camera and digitized using a frame grabber with a spatial resolution of 512×512 pixels. The monochromatic excitation affected flow structures and therefore changed the heat transfer rate on the impingement surface. Figure 10.15 shows the 2D Nusselt number (Nu) distributions of the impinging jet at the excitation frequencies 950 Hz and 1750 Hz and without excitation for H/D = 1.125 and ReD = 12300. The natural frequency of the jet was 1750 Hz and the subharmonic frequency was 950 Hz. Clearly, the 2D heat transfer distribution was sensitive to the excitation frequency particularly in the wall-jet region. The transverse heat transfer distributions in the excited impinging jet for H/D = 1.125 are shown in Fig. 10.16, compared to the unexcited impinging jet. At the natural frequency of 1750 Hz, the local heat transfer coefficient in the wall-jet region (1< r/D <2) was considerably enhanced by excitation compared to the unexcited impinging jet. In contrast, at the subharmonic frequency of 950 Hz, the local heat transfer coefficient was reduced in the wall-jet region. Near the stagnation-point flow region (-1< r/D <1), the monochromatic excitation did not significantly affect the time-averaged heat transfer coefficient. In the wall-jet region, the heat transfer enhancement or reduction by excitation was related to the development of the large-scale vortical structures that were studied using smoke flow visualization coupled with hot-wire and hot-film measurements. When the excitation frequency was close to the natural frequency of the impinging jet, intermittent vortex pairing occurred, producing chaotic ‘lump eddies’ that contained a great deal of small – scale random turbulence. The random vortical structures enhanced the local heat transfer. When the forcing was near the subharmonic of the natural frequency, stable vortex pairing was promoted; resulting strong large-scale well-organized vortices induced unsteady separation of the boundary layer in the wall-jet region and caused a reduction in the local heat transfer coefficient. This experimental study demonstrated that TSP, complemented with other experimental techniques, provided an effective tool for study of basic fluid mechanics and heat transfer problems.

Impinging Jet Heat Transfer

(a)


c


(b)


Fig. 10.14. Experimental set-up: (a) Jet facility and TSP system, (b) Coordinate system. From Liu and Sullivan (1996)


Impinging Jet Heat Transfer

Impinging Jet Heat TransferImpinging Jet Heat Transfer

Impinging Jet Heat Transfer

(b)


Impinging Jet Heat Transfer

Impinging Jet Heat Transfer

Fig. 10.16. Transverse Nusselt number distributions of the excited impinging jet for H/D = 1.125 and ReD = 12300 at different excitation frequencies. From Liu and Sullivan (1996)


Impinging Jet Heat Transfer

r/D

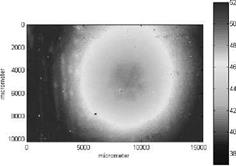
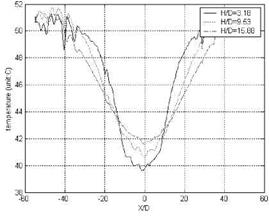
Using EuTTA-dope TSP, through an optical microscope and a close-up lens attached with a cCd camera, Huang et al. (2002) measured the surface temperature distributions in impinging micro-jets. The tested micro-jets were a single jet of a 200-pm diameter, a multi-jet with 19 holes of a 200-pm diameter, and a multi-jet with 19 tubes of a 100-pm inner diameter. The experimental setup arrangement of micro-jet impingement was similar to that used by Liu and Sullivan (1996). Figure 10.17 shows a typical temperature map in the impinging multi-jet with 19 holes of a 200-pm diameter for H/D = 19.05, where the Reynolds number based on the diameter was about 300. Figure 10.18 shows the temperature distributions along the centerline of the multi-jet for three impingement distances from the surface.

Impinging Jet Heat Transfer

Fig. 10.17. Surface temperature distribution of the impinging multiple-micro-jet at H/D = 19.05. From Huang et al. (2002)

Impinging Jet Heat Transfer

Fig. 10.18. Surface temperature distributions along the centerline of the multiple-micro-jet at three impingement distances. From Huang et al. (2002)

Boundary-Layer Transition Detection

TSP was utilized as a technique for visualizing flow transition (Campbell et al. 1992; Campbell 1993; McLachlan et al. 1993b; Cattafesta et al. 1995; Asai et al. 1997b, 1997c). Since convection heat transfer is much higher in turbulent flow than in laminar flow, TSP can visualize a surface temperature difference between the laminar and turbulent flow regions. Typically, at low speeds, model (or flow) needs to be heated or cooled to generate a temperature change across the transition line. However, at higher Mach numbers, artificial heating is not necessary because friction heating is able to produce a significant temperature difference between the laminar and turbulent flow regions. Using EuTTA-dope TSP,

Campbell et al. (1992, 1993) visualized transition patterns on a Boeing symmetric airfoil and a symmetric NACA 654-021 airfoil in a low-speed wind tunnel and determined the dependency of the transition location on the angle of attack. In their experiments, the airfoil models were pre-heated to about 50oC with a spot lamp prior to a run to produce a sufficient temperature difference between the turbulent and laminar flow regions by subsequent convection cooling. McLachlan et al. (1993b) reported a similar transition detection experiment for a NACA – 64A010 airfoil using a proprietary TSP. Asai et al. (1997b) used a EuTTA-based TSP to visualize transition on a 10-degree cone model at the Mach numbers 1.6­2.5 in a quiet supersonic wind tunnel.

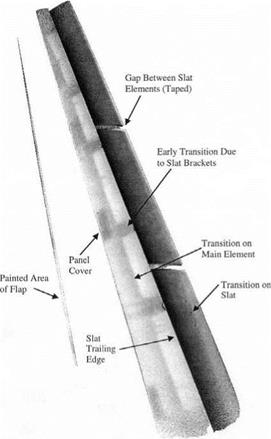
Transition detection was made using EuTTA-dope TSP for a trapezoidal wing (Trap Wing) semispan model at the Mach numbers 0.15-0.25 and Reynolds numbers 3.5×10⁶-15x106over a range of the angles of attack from -4° to 36° in the NASA Ames 12-Ft Pressure Wind Tunnel (Burner et al. 1999). The transition detection system consisted of three scientific-grade cooled CCD cameras, several flash UV lights for illumination, and a computer for data processing. EuTTA – dope TSP was coated on white paint stripes along the main wing, slat, and trailing edge flap of the upper wing surface. The white basecoat was used to enhance surface scattering and increase the luminescence emission from TSP. TSP was applied only on the slat and the first 20% of chord on the main wing and flap since previous testing of this model in the Langley 14×22 Ft tunnel had shown that transition would always occur upstream of these locations. TSP data were obtained with the three cameras viewing the slat, flap, and wingtip of the model. The following data acquisition procedure was used. The tunnel was first run for an extended period, without cooling, to raise the temperatures of the flow and the model. Reference images of the ‘hot’ model were taken at several different angles of attack (AoA). The cooling system was then activated, and ‘run’ images were taken over the same AoA sequence while the flow cooled. The cooling sequence generally required 2-3 minutes during which the flow temperature dropped at about 5 °R/minute. Internal model temperatures, measured with thermocouples, lagged the flow by from 2°R (slat) to 10°R in the main wing. Figure 10.8 shows a typical transition image of the slat and main wing of the Trap Wing in the landing configuration at the angle of attack of 24°, Mach 0.15, and the total pressure of 1 atm. Bright regions in the image were hot relative to dark regions. The slat was dark relative to the main wing because its smaller mass allowed it to follow more rapidly the drop in the flow temperature. Since the flow cooled the model, boundary layer transition was indicated by a sharp decrease in brightness in the image. This effect was seen clearly on the main wing where transition occurred at 10-15% chord except in the turbulent wakes behind the slat brackets.

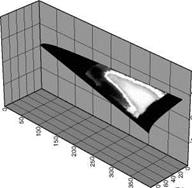
Using a Ruthenium-based TSP, Cattafesta et al. (1995b, 1996) conducted transition detection on several 3D models over a wide speed range in the NASA Langley Supersonic Low-Disturbance Tunnel. Figure 10.9 shows a heat transfer image mapped onto the half of the CFD model surface grid of a swept-wing model, visualizing transition on the model at Mach 3.5. The bright region corresponded to the turbulent boundary layer where the heat transfer rate was higher than that in the laminar boundary layer. The onset of transition was demarcated in the image as a bright parabolic band on the wing where the cross­flow instability mechanism dominated the transition process. No transition was observed near the centerline of the model because near the symmetric plane of the model the stability was mainly controlled by the Tollmien-Schlichting instability mechanism that was weaker than the cross-flow instability mechanism.

Boundary-Layer Transition Detection

Fig. 10.8. Transition image of the upper surface of the Trap Wing model at the angle of attack of 24° and Mach 0.15. From Burner et al. (1999)

Boundary-Layer Transition DetectionX

Y (mm)

X (mm)

Fig. 10.9. Heat transfer image of transition on a half of a CFD grid of a swept-wing model at Mach 3.5. From Cattafesta et al. (1996)

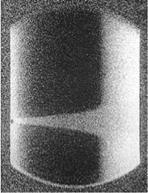
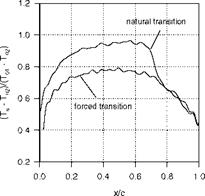
Cryogenic TSP formulations, originally developed at Purdue University, were used to detect transition on airfoils in the 0.1-m transonic cryogenic wind tunnel at the National Aerospace Laboratory (NAL) in Japan and the 0.3-m cryogenic wind tunnel at NASA Langley. In the NAL tests, two TSP formulations, Ru(trpy)- GP197 and Ru(VH127)-GP197, were used by Asai et al. (1996, 1997c) in a temperature range of 90-150 K for two NACA 64A012 airfoil models made of white glass ceramic (MACOR®) and stainless steel. The stainless steel model was covered with a thin white Mylar insulating layer to achieve a larger surface temperature variation. In these tests, the total temperature varied from 90 to 150 K, the Mach number from 0.4 to 0.7, and the Reynolds number based on the chord from 2.2 to 8.5 millions. In order to enhance a temperature difference across the transition line, Asai et al. (1996, 1997c) employed both a transient method of rapidly changing the freestream temperature and a steady internal heating method. A rapid change of the freestream temperature was achieved by injecting liquid nitrogen into the tunnel; the maximum temperature drop was about 7.5 K in 10 seconds. The CCD camera system used for cryogenic TSP transition detection was the same as that for cryogenic PSP measurements at NAL described in Chapter 9. Figure 10.10 shows a typical luminescent intensity ratio image of Ru(VH127)-GP197 TSP on the stainless steel NACA 64A012 airfoil model covered with a Mylar film at Mach 0.4 and the total temperature of 150 K, where flow was from left to right. Bright and dark regions represented high and low heat transfer, respectively. A turbulent wedge generated by a small roughness element placed near the leading edge was clearly visible as well as the natural transition line near 70% chord. Quantitatively, the surface temperature was calculated from the luminescent intensity using a priori calibration relation. Figure 10.11 shows the normalized chordwise surface temperature distributions at the natural and forced transition locations on the stainless steel model, where the total temperature was rapidly changed from 150 to 142.5 K by injecting liquid nitrogen to the tunnel. Natural transition was shown as a sudden decrease in the chordwise

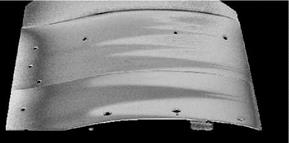
temperature distribution. Figure 10.12 shows transition images on the stainless steel airfoil model for different Reynolds numbers based on the chord at Mach 0.4. Using several cryogenic TSPs, Popernack et al. (1997) also detected boundary- layer transition on a laminar-flow airfoil model in the NASA Langley 0.3-m cryogenic wind tunnel. A typical transition image on this airfoil is shown in Fig.

10.13, clearly visualizing a number of turbulent wedges tripped by surface roughness and the natural transition location. Transition detection on a swept wing was recently made using cryogenic TSP in the European Transonic Wind Tunnel (ETW) (Fey et al. 2003).

Boundary-Layer Transition Detection

Fig. 10.10. Relative luminescent intensity image indicating transition on a NACA 64A012 airfoil at Mach 0.4 in the NAL 0.1 m transonic cryogenic wind tunnel, responding to a decrease in the total temperature from T01 = 150 K to T02 = 142.5 K. From Asai et al. (1996)

Boundary-Layer Transition Detection

Fig. 10.11. Normalized chordwise surface temperature distributions in natural and forced transition regions on a NACA 64A012 airfoil at Mach 0.4 obtained from Figure 10.10. From Asai et al. (1996)

Boundary-Layer Transition Detection

Re=1.60xl06 Re=1.82xl06 Re=2,09xl06

Fig. 10.12. Transition images of a NACA 64A012 airfoil in the NAL 0.1 m transonic cryogenic wind tunnel for different Reynolds numbers at Mach 0.4. From Asai et al. (1996)

Boundary-Layer Transition Detection

Fig. 10.13. Transition image on a laminar-flow airfoil model in the NASA Langley 0.3 m cryogenic wind tunnel (flow from right to left). From Popernack et al. (1997)

Applications of Temperature Sensitive Paint

10.1. Hypersonic Flows

The global surface heat transfer distributions on a waverider model at Mach 10 were measured by Liu et al. (1994b, 1995b) using EuTTA-dope TSP. The experiments were conducted in the Hypervelocity Wind Tunnel No. 9 at the Naval Surface Warfare Center (NSWC), a blow-down facility operating at the Mach Numbers of 8, 10, 14 and 16.5 with the corresponding maximum Reynolds numbers per foot of approximately 50×106 , 20×106, 3.8×10⁶ and 3.2×10⁶, respectively. The test cell diameter was 5 feet and the length was over 12 feet, which allowed for testing of large model configurations. Tunnel 9 used nitrogen as the working gas. The waverider model had an overall length of 39 inches, a span of 16.2 inches and a base height of 6.8 inches. The model was fabricated in eight parts. The body consisted of four sections manufactured from 6061-T6 aluminum. The nose, both leading edges, and the main cavity cover plate were manufactured from 17-4 PH stainless steel. Surface static pressures were measured at 32 locations on the model with Kulite pressure transducers (Model XCW-062-5A). Measurements of surface temperature rise were made using Medtherm model TCS-E-10370 coaxial thermocouples. A 0.1-mm-thick white Mylar layer covered the lower half of the windward side of the model from the centerline to the outboard edge. EuTTA-dope TSP (about 10 |am thick) was brushed on the Mylar layer. Ultraviolet illumination to excite the paint was provided by four 40-watt fluorescent black lights. Two CCD video cameras, viewing the front and back of the model separately, were used to image the TSP – coated surface. The analytical and numerical analyses of heat transfer on a thin insulating layer on a semi-infinite metallic body gave an estimate of required thickness of the insulating layer (about 0.1 mm). It was also proven that the discrete Fourier law was reasonably accurate as a simple heat transfer model for calculating heat flux from time-dependent TSP measurements in this case.

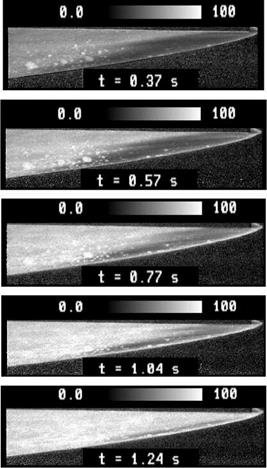
The experiment was run at the freestream Mach number of 10, average total pressure of 1300 psia and average total temperature of 1840oR. The wind tunnel run time was 2.3 seconds. The angle of attack was set at 10 degrees. Figure 10.1 shows windward side heat transfer maps of the lower half of the waverider (58% of the total length is shown in the images) at 0.37, 0.57, 0.77, 1.04 and 1.24 seconds after the wind tunnel started to run. The gray intensity bar in Fig. 10.1 denotes heat flux in kW/m2. The bright regions represent high heat transfer and

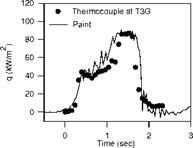
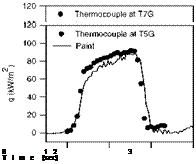
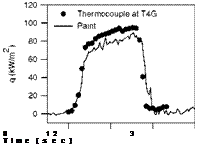
dark regions low heat transfer. In these maps, the low heat transfer region (dark region) downstream of the leading edge corresponds to laminar flow. Transition from laminar to turbulent flow can be easily identified as an abrupt change from low to high heat transfer. Also observed was a movement of the transition line toward the leading edge as the laminar region diminished when the surface temperature increased with time. Figure 10.2 shows typical temporal evolutions of heat transfer obtained by TSP at the locations near the thermocouples. The heat transfer history obtained by TSP was in agreement with that given by the thermocouples at these locations.

Applications of Temperature Sensitive Paint

Fig. 10.1. Sequential heat transfer maps of the windward side of the waverider model at Mach 10. From Liu et al. (1995b)

Applications of Temperature Sensitive Paint
Подпись: 0 12 3 Time (sec)

Fig. 10.2. History of heat transfer at four locations on the windward surface of the waverider model at Mach 10. From Liu et al. (1995b)

Hubner et al. (2002) applied TSP with a high-speed imaging system to measure full-field surface heat transfer rates on a 25°/55° indented cone model in short – duration hypersonic flows. Tests were performed in the 48-inch hypersonic shock tunnel (HST) and the LENS I tunnel facilities at the Calspan-University of Buffalo Research Center (CUBRC). Nominal test conditions ranged between the Mach numbers 9.5 and 11.1 and the Reynolds numbers 140,000 and 300,000 per meter with run times less than 10 ms. The indented cone model had the back diameter of 0.262 m. The model was fitted with a sharp-nose cap (0.194 m long) or a blunt-nose cap (6.4 mm radius). Over sixty platinum thin-film heat transfer gauges were aligned along a ray on the model. Additional gauges were installed azimuthally along the flare (aft) cone near the region of shock/boundary-layer interaction. TSP and an insulating layer were applied to 50% of the model for the HST tests and 25% of the model for the LENS I tests.

TSP used Ru-phen as an active sensing molecule. While Ru-phen itself exhibited oxygen quenching and hence pressure sensitivity, the luminophor was dissolved into an oxygen-impermeable polyurethane binder. TSP was applied over a white polyurethane insulating layer, and both were sprayed using conventional aerosol/airbrush equipment. The nominal TSP thickness and insulator thickness were 5-10 |im and 100-150 |im, respectively (+/-5 |im). Both

TSP and the insulating binders were polyurethane, thus exhibiting similar thermal characteristics. The average thermal conductivity and diffusivity of the insulator were 0.48 W/(K-m) and 2.7×10⁻⁷ m2/s, respectively, in a temperature range of 293­323 K. The required insulating layer thickness was estimated to be the order of 100 microns for a run time of 10 ms based on a 1D transient heat transfer analysis assuming a step change in the heat transfer rate on a semi-infinite body. By minimizing the TSP thickness relative to the insulator thickness (while still achieving viable intensity measurements), the shortest time constant of TSP was achieved.

TSP was excited using a photographic xenon flash unit. Ultraviolet to blue excitation filters and orange-red emission filters were required to separate the luminescent emission from the excitation light. A combination of two Schott glass filters was utilized to filter the xenon flash excitation. For emission filtering, a 650 nm interference filter (80 nm bandpass) was used in conjunction with a high-pass Schott glass filter. A fast-framing CCD camera system was used, allowing on-chip framing rates from 15 to 1,000,000 frames per second (fps) with a frame capacity of 17 frames. The practical framing rates for the measurement system used at the CUBRC facilities were 100 to 5000 fps, depending on the duration of a test run, the desired sampling rate, and the ability to effectively detect the emission from TSP in short exposures. The advantage of the flexible framing rate was the ability to choose from a single long-exposure image or several short-exposure images during a single tunnel test. The frames were stored on the chip until all 17 frames were acquired, then data were transferred to a PC – installed frame grabber card. The CCD camera had a full-well capacity of

220,0 electrons and a readout noise of 70 electrons. The effective spatial resolution per frame was 248 by 248 pixels.

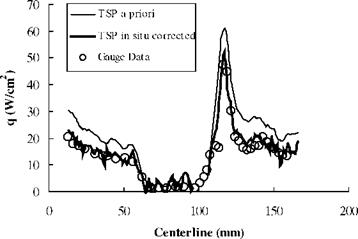
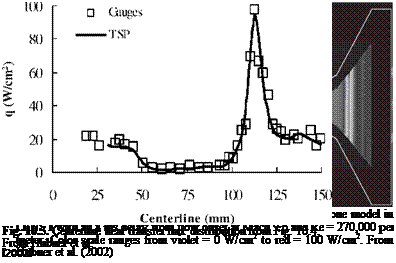
Figure 10.3 shows a typical Schlieren image of the flow field around the indented cone model. Visible was the intersection of the forebody shock and the aftbody (flare) shock. There was a separation region induced by the shock/boundary-layer and shock/shock interactions. The flow separation existed over the leading cone, and the flow reattached over the flare cone. Figure 10.4 is an in-situ calibrated heat transfer image for the model with the sharp-nose cap at Mach 9.6 and Re = 270,000 per meter in the LENS I tsets. The image shows a stabilized axisymmetric pattern although the asymmetric flow appeared in the transient stage of the onset of flow. Clearly present were the separated (violet) and shock/boundary layer interaction (yellow-red) regions. Where flow separation was present, the corresponding surface heat transfer rate was low (violet). Figure 10.5 shows the centerline heat transfer distributions obtained from TSP and gauge measurements. The relative rms calibration error of TSP measurements with the gauge measurements was 15%, which was mainly due to the high-frequency unsteadiness in the flow.

Fig. 10.3. Schlieren image of flow over the indented cone model. From Hubner et al.

Applications of Temperature Sensitive Paint

(2002)

Figure 10.6 shows time-dependent intensity-ratio images captured with a high­speed camera for the model with the sharp-nose cap at Mach 11 and Re = 140,000 per meter in the 48-inch HST tsets. The framing rate was 2000 fps (0.5 ms exposure). The image sequence from left to right shows the development of

surface heating. The first image taken just prior to the onset of flow indicates uniform temperature. The following two images, acquired while the tunnel conditions rose to the desired freestream conditions, show the flare shock impingement just aft of the intersection of the leading and flare cones. Afterwards, the separation region grew upstream and the shock impingement moved downstream. As time increased, the separated region and shock

impingement boundary appeared to become stable and axisymmetric. Figure 10.7 shows the corresponding heat transfer results calculated from the time-dependent intensity ratio data along the centerline of the model. First, the intensity-ratio data was converted to temperature using a priori TSP calibration, and the heat transfer rate was calculated using a transient heat transfer model when the thermal properties of the coating were given. The heat transfer model was based on a solution of the 1D heat conduction equation for a semi-infinite layer. Note that some useful solutions of the heat conduction equation were given by Schultz and Jones (1973) for the determination of the heat transfer rate in short-duration tunnel testing. As shown by the thin line in Fig. 10.7, although the trend matched that of the gauge measurements, the values of the heat transfer rate obtained by this approach were over-predicted by 20 to 50%. This bias error might be due to the differences between a priori TSP calibration experiments and actual experiments (such as test set-up differences that led to spectral leakage, background illumination, etc.), and uncertainties associated with the thermal properties of the TSP and insulator. In-situ calibration with gauge measurements can account for this bias error. When the intensity ratio data was calibrated with the gauge data (thick line), excellent agreement was achieved. Besides the indented cone model, Hubner et al. (2001) also measured the temperature distributions on an elliptic cone lifting body in short-duration hypersonic flows. Recently, Matsumura et al. (2002) and Schneider et al. (2002) used TSP to detect heat transfer signatures induced by streamwise vortices shed from roughness elements on hypersonic models in the Ludwieg tubes.

Applications of Temperature Sensitive Paint

Fig. 10.6. Time-dependent intensity-ratio measurements on the sharp-nose indented cone in the 48-in HST at Mach 11.0 and Re = 140,000 per meter. Images are shown at successive 1 ms intervals (actual acquisition rate was 2000 fps). From Hubner et al. (2002)

Applications of Temperature Sensitive Paint

Fig. 10.7. Centerline heat transfer flux distribution from Fig. 10.6. From Hubner et al. (2002)

The experiments by Liu et al. (1994b, 1995b) and Hubner et al. (2002) indicate that the determination of the suitable thickness of an insulating layer (including TSP layer) applied to a metallic model is a key for successful quantitative heat transfer measurements using TSP in short-duration hypersonic tunnels. On one hand, when an insulating layer is too thick, the surface temperature may locally exceed the upper bound of the workable measurement range of TSP (typically 100°C for EuTTA-dope TSP and Ruthenium-based TSP) and even the melting temperature of a polymer layer. On the other hand, if an insulating layer is too thin (for example when TSP is directly applied to a metallic model), a change in the surface temperature is so small in a short duration that accurate recovery of the heat transfer rate is difficult. The appropriate thickness of an insulating layer can be estimated prior to tests based on a ID transient heat transfer analysis for a thin insulating layer on a semi-infinite body.

Thermographic phosphors have also been used for global heat transfer measurements in hypersonic wind tunnels at NASA Langley (Buck 1991; Merski 1999). Instead of metallic models, silica ceramic models fabricated using a special casting method were used. To coat models with phosphors in the form of powders, phosphors were suspended in a silica ceramic binder, and then the resulting mixture was applied to the model surface with an airbrush. The coating thickness was about 25 pm. The phosphor used at NASA Langley had a usable temperature range of 22-170°C, which was higher than the temperature range from -20 to 100°C for a polymer-based TSP like EuTTA in dope. Phosphors usually had several distinct emission spikes, typically two green spikes and a red spike in the emission spectrum under UV excitation. Therefore, a weighted two-color relative-intensity ratio could be used to determine temperature based on a priori calibration relation without using a wind-off reference image. In fact, this kind of thermographic phosphor was a two-color TSP. A three-color CCD camera was used to acquire red, green and blue images even though only red and green images were used for phosphor thermography. An estimated error in phosphor thermography was about 3oC over a temperature range of 22-170oC, and the total uncertainty in heat transfer measurements in typical hypersonic tunnels was less than 10%.

Liquid crystal (LC) thermography has been applied to heat transfer measurements in hypersonic flows (Jones and Hippensteele 1988; Babinsky and Edwards 1996). Compared to polymer-based TSPs and thermographic phosphors, thermochromic liquid crystals have a relatively narrow bandwidth of temperature sensitivity (typically 32-42oC). Currently, there are two implementation methods of LC for extracting quantitative heat transfer information. The first approach is to use LC with a very narrow bandwidth of about half a degree C. When a transient change in temperature occurs on a model surface during a run in a short-duration tunnel, temperature at which a single color of LC appears (usually yellow) is visualized most likely in a narrow strip or contour moving on the surface. The temporal evolution of the strip or contour with the specific temperature on the surface is recorded in a series of images, and then the heat transfer rate on the surface can be estimated based on certain transient heat transfer model. The instrumentation for the narrow-band approach is simple with a CCD video camera attached with a band-pass filter. The spatial resolution of measurement is limited by the frame rate of the camera. An alternative is the wide-band approach that utilizes the full range of colors (or hue) displayed by LC over a wider range of temperature, which allows global heat transfer mapping using a single image frame if the temperature-sensitive range of LC covers a temperature change experienced on the whole surface. Using this approach, Babinsky and Edwards (1996) obtained reasonable results of the heat transfer flux with the total uncertainty of 7% on a cylinder/15o-flare model in hypersonic flows. Note that the wide-band of LC (about 10oC) is, in fact, not wide compared to the usable temperature ranges of polymer-based TSPs and thermographic phosphors.

Micronozzle

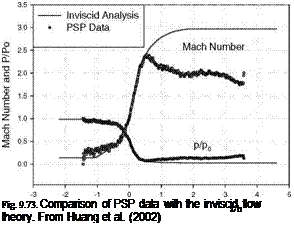
PSP is a molecular sensor that can be used for global pressure measurements in MEMS devices. Huang et al. (2002) used PSP to measure the pressure distribution in a Mach 3 micronozzle fabricated with a high-accuracy CNC machine. Generally, an imaging system for PSP (or TSP) applied to MEMS devices must use an optical microscope and a close-up lens with a CCD camera to achieve a sufficiently high spatial resolution. In experiments, Ru(dpp) was used as a probe luminphore mixed with RTV as the binder dissolved in dichloromethane. Using a CCD camera with a close-up lens, a spatial resolution of 12 |jm was achieved. Figure 9.71 is a schematic of the experimental setup for PSP measurements in a micronozzle. The micronozzle was connected to a vacuum pump, and one valve was used to control pressure at the micronozzle exit and another valve to change the inlet pressure from the atmosphere. Two pressure transducers were used to monitor the pressure signals at the micronozzle inlet and exit. Figure 9.72 shows a schematic of the micronozzle and a typical pressure image in the supersonic regime in the micronozzle where the total pressures at the nozzle inlet was 11.45 psi and the estimated Reynolds number based on the nozzle diameter was about 8000. Figure 9.73 shows a comparison of the PSP data with an inviscid flow solution for local pressure and Mach number. The PSP data are in agreement with the inviscid flow solution in the convergent and throat regions of the nozzle. However, the Mach number obtained by PSP in the downstream region after the nozzle was significantly lower than that predicted by the inviscid flow solution after the Mach number reached 2.5. This discrepancy may be due to the significant boundary-layer growth that was not taken into account in the inviscid flow solution.

Fig. 9.72. (a) Schematic of a micronozzle, and (b) pressure distribution in a micronozzle at the total pressure of 11.45 psi. From Huang et al. (2002)

Micronozzle

Micronozzle

Flight Tests

Using PtOEP in silicone resin, McLachlan et al. (1992) measured the surface pressure distributions on a fin attached to the underside of an F-104 fighter jet in flight. A self-contained data acquisition system was installed inside the fin, which consisted of an 8-bit digital video camera and an UV lamp triggered remotely to excite PSP. PSP was applied to a Plexiglas panel mounted flush with the fin. The luminescent emission from PSP was transmitted through the Plexiglas into the fin where it was subsequently recorded by the video camera. Two tests were flown at night at the Mach numbers 1.0-1.6 at altitudes between 30,000 and 33,000 ft. Pressure taps mounted on the fin were used to calibrate PSP in-situ. Results showed a favorable comparison to the pressure tap data at the Mach numbers greater than 1.3, and the accuracy of about ±0.24 psi was reported. Houck et al

(1996) performed flight tests using PSP on a Navy A-6 Intruder where PSP was painted on an Mk76 practice bomb. The data acquisition system consisted of a battery-operated strobe light for excitation that was synchronized with a Nikon 50­mm film camera used to measure the luminescent emission. This system was self – contained and mounted onto a bomb rack adjacent to the practice bomb. Three night flights were flown at altitudes between 5,000 and 10,000 ft at the Mach numbers 0.4-0.82. After flight, the negative films were developed and digitized by projecting them onto a 14-bit CCD camera. No in-situ calibration was done such that only qualitative results were presented and the temperature effect was unable to be accounted for. Using a similar film camera system, Fuentes and Abitt

(1996) measured the pressure distributions on a Clark-Y airfoil mounted underneath the wing of a Cessna 152 aircraft. In general, issues associated with film developing and processing make film-based systems more difficult for quantitative measurements.

Using a portable 2D phase-based laser-scanning lifetime system, Lachendro et al. (1998, 2000) conducted in-flight PSP measurements on a wing of a Raytheon Beechjet 400A aircraft. Flight conditions were chosen to produce such a wing pressure distribution that could be easily detected by the laser scanning system. Thus, two flight conditions were considered: (1) 31,000 ft and Mach 0.75, and (2)

21,0 ft and Mach 0.69. These Mach numbers represented the maximum cruise Mach number obtainable at the respective altitudes. Also, pressure data in the above flight conditions were available from a flight test previously conducted by Mitsubishi Heavy Industries (MHI). Since this aircraft was a derivative of the Mitsubishi-designed Diamond II, it had been extensively studied in flight and wind tunnel testing (Shimbo et al. 1999). The previous data were used to validate the feasibility and accuracy of in-flight PSP measurements. The minimum and maximum pressures and temperatures from both numerical calculations and MHI flight tests were used as the design boundaries for selecting proper PSP and TSP formulations for in-flight tests. A total of six in-flight tests were made. Three tests were conducted at Purdue University on a university-owned and – operated Beechjet 400A aircraft; three other tests were performed at Raytheon Aircraft Company in Wichita, Kansas on a Beechjet 400A aircraft designated solely for in­flight testing. In order to make in-flight PSP measurements, a lifetime-based or phase-based technique is more suitable because this technique does not require reference signal (or image) used in conventional intensity-based systems and therefore it is not affected by wing and fuselage deformation. The lifetime-based technique is also insensitive to the ambient light from the Moon and stars. Additionally, the system must be able to collect data over a large distance. In the tests conducted by Lachendro et al. (1998, 2000), PSP and TSP measurements were made at distances greater than 16 feet away from the photodetector. To improve the SNR, a coherent light source such as a laser should be used. A compact laser scanning system was specially designed for phase-based PSP and TSP measurements at large distances.

The laser scanning system was designed to be as small as possible so as to easily fit inside the aircraft. In addition, it was built to be robust and allow easy modification to optical arrangement. The laser scanning system consisted of scanning/positioning and data acquisition parts. Two 5-in diameter Velmex programmable rotary tables were mounted orthogonally to each other via an aluminum angle bracket. Mounted onto the vertical stage was an 8×5 in aluminum backing plate that served as the mounting surface for the laser scanning system plate. This allowed the scanner to position the laser spot on a wing. The rotary stages were controlled through the serial port of a PC using a Velmex’s NFS-90 stepper motor controller. A Lab VIEW interface program allowed for generation of a series of points distributed across a wing surface, and then a surface grid formed by these points could be scanned repeatedly by the system with a minimal deviation of the points from one scan to another. The angular positioning resolution was ±0.0125° and the corresponding position resolution was ±1 mm at a distance of 16 feet.

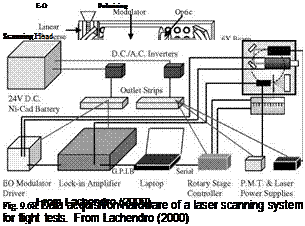
Figure 9.67 shows the laser scanning system plate mainly comprised of a UniPhase solid-state Nd:YAG laser (532 nm and 50 mW), a PMT, and an electro­optic (E-O) modulator with a driver. Data acquisition hardware is shown in Fig. 9.68. For phase-based measurements, a laser beam was passed through the E-O modulator (Lasermetrics model 3079FW) for modulation. The input beam to the E-O modulator was polarized using two Glan-Thompson polarizers. The first polarizer was placed at the output of the laser to control the intensity, whereas the second polarizer mounted at the end of the E-O modulator controlled the depth of modulation. The beam was then passed through a Melles Griot 6X beam expander/focuser, allowing for tightly focusing the scanning spot at a distance greater than 1 m. The luminescent emission from PSP was collected through a 3­in convex lens (f-number 1.86) and then was focused through a spatial aperture located in the front of a long-pass filter (> 570 nm). The filtered emission was passed into a PMT (Hamamatsu Model HC-120), and the PMT output was sampled by a 16-bit A/D converter in a lock-in amplifier (EG&G model 5302). The two-channel lock-in amplifier was capable of simultaneously measuring the magnitude and phase of the luminescent signal. Data from the lock-in amplifier was acquired through the GPIB interface into a PC using a LabVIEW program that coordinated positioning of the scanning system with data acquisition. The luminescent intensity and phase were recorded at each specified location of the laser spot on the wing surface and saved for subsequent data analysis.

Flight Tests
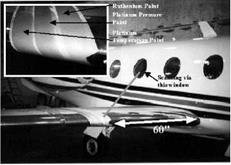
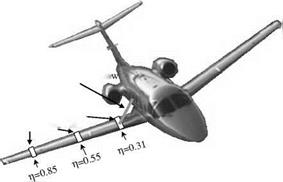
Four PSP formulations, Ru(dpp) PSP and three PtTFPP PSPs in different binders, were developed for in-flight tests. These paints were chosen based on their overall performance in a pressure range of 1-7 psi and a temperature range of -50 to 0°C. PtTFPP in the FEM co-polymer binder was much less temperature – sensitive than other paints. Due to photosensitivity of the paints, they were applied to the wing only just before a flight after the wing was cleaned with an ethanol-based solvent. For the first flight test, two PSPs and one TSP were used and sprayed separately onto 75-in long and 3-in wide strips on an adhesive-backed monocoat film. As illustrated in Fig. 9.69, the strips wrapped around the leading edge and positioned streamwise to the trailing edge. For the other three flight tests, as shown in Fig. 9.69, the painted strips were placed at 31%, 55% and 85% spans that corresponded to the locations in the MHI flight test. At each location, PSP and TSP strips were placed side by side.

Flight Tests

Flight Tests

532nm Nd: Yag laser scanning from cabin windo

Mylar strips coated, with PSP and TSP

Fig. 9.69. PSP and TSP installation for flight tests. From Lachendro (2000)

Somewhat unexpectedly, Lachendro et al. (1998, 2000) found a considerable temperature variation across the wing chord that was caused by wing fuel tanks warmed by moving fuel and relatively cooled stringers. Due to poor temperature sensitivity of TSP over the testing temperature range, the temperature effect of PSP could not be corrected based on TSP data. Instead, they had to use a simple heat transfer model to estimate the mean temperature on the wing in the flight conditions. The chordwise pressure distributions were obtained at 31%, 55% and 85% span. Figure 9.70 shows the pressure coefficient Cp given by PSP at 21,000 ft and Mach 0.69 compared to the existing MHI fight test data. The distribution of Cp was calculated from a priori calibration relation of PSP using the mean wing temperature of -5°C estimated based on a heat transfer model. It was noted that the first data point near the leading edge in the MHI flight test data was likely erroneous and it could be disregarded. Near the trailing edge after x/c = 0.75, the PSP data were significantly lower than the MHI flight test data. This was because the mean temperature of -5°C used for PSP data reduction over the whole wing section led to an underestimated value of Cp at the thin trailing edge that was actually colder than the middle portion of the wing. Since the temperature variation caused by moving fuel was not large at 21,000 ft, the PSP data in this case did not exhibit a significant pattern produced by the temperature variation across the wing section.

Flight Tests

-1.4