Category BASIC AERODYNAMICS

Extension to High-Speed Flight

Although the material covered in this book is a necessary prerequisite for under­standing basic aerodynamics, it is important to realize that the principles set forth may not be directly applicable to problems involving high-subsonic, supersonic, and hypersonic flight. Nevertheless, the analyses and concepts introduced are an impor­tant foundation on which to build high-speed aerodynamics. In particular, we find that more attention to the thermodynamic aspects of fluid mechanics is required. The density now becomes an important variable and considerably more use of the energy equation is demanded. That is, compressibility effects play a major role in the aerodynamics and performance of flight vehicles at high subsonic, supersonic, and hypersonic speeds.

[1] This may not be a correct picture of the motion in the case of free molecular flow at extremely high altitudes, where the mean free path can be very long.

[2] Standard SI and English-system symbols and units are used throughout this book. For example, N represents force in newtons, lbf is force in pounds, and kg is mass in kilograms; a slug is the basic unit of mass in the traditional English engineering system. Length in English units is in ft (feet) or in (inches); m is the metric unit of length in meters. Time in seconds is s or sec.

[3] Develop a theory for the flow and resulting pressure distributions on aerody­namic surfaces. Use integrated pressure forces to determine the force coefficients.

[4] Carry out a numerical simulation of the flow field over the wing.

[5] Build a model of the wing and measure the forces in a wind tunnel.

The projected wing area is S = 15.0 x 0.8 = 12.0 m2. Therefore, the full-scale drag at 135 km/hr is:

[7] In some cases, it may be necessary to include additional dynamic variables such as angular momentum in rotating fluids and, in other cases, additional thermodynamic properties such as the entropy, which is used to account for the reversibility of flow processes.

[8] Survey the control surface and note the magnitude and coordinate direction of any pressure (or shear) force acting on the control surface. If the force is not

[9] Using the vector identity:

V(u-v) = Vv+v-Vu + u x (Vxv) + v x (V xu) and setting u = v,

V(V-V) = 2V • VV + 2V x(Vx V).

Thus,

V• VV = v(v^ V)-V x(Vx V) = v(v2)-V x(Vx V).

[10] (фА) = A • Vф + фV• A

[11] analytical methods based on assumptions regarding the flow regime or the pres­ence of small parameters in the problem

• experimental methods that seek to illuminate the problem by measurements and flow visualization in a laboratory environment or by instrumenting actual flight vehicles

• numerical methods that solve the appropriate sets of equations and boundary conditions by high-speed computation.

[12] Named after Daniel Bernoulli, a famous mathematician and physicist in the 1700s who made many important contributions to the study of hydrodynamics.

[13] Solve the Laplace’s Equation for the dependent variable ф(х, у) or у(х, у).

[14] Suitably differentiate this expression to determine the velocity components at any point.

[15] The constant coefficients that appear in these elementary solutions (often referred to as strengths) are assigned convenient arbitrary values when illustrating superposition in this chapter. However, in Chapter 5, in which it is required that superposition correspond to a specified body shape, the coefficients must be adjusted so that the composite solution matches the required boundary conditions.

[16] The radius of the cylinder and the resulting flow field may be changed by varying the freestream velocity and the strength of the doublet.

[17] The flow field is symmetrical with respect to both the x – and y-axes. This indi­cates that there is no net force on the cylinder in either the lift (i. e., vertical)

[18] On r = R, ur = 0. If ue = 0 as well, then:

Г

4nRV, ‘

[20] Named for M. Kutta, a German mathematician, and E. Joukouski, a Russian physicist, who

independently established the theorem during the early 1900s.

[21] Named after a British physicist who established the theorem in the late 1800s.

4.1 Find the equation of the streamline passing through the point (x = 2, y = 3) in a two-dimensional flow field where the velocity components are given by u = 3y2 and v = -2x.

4.2 A two-dimensional, steady flow field is described by:

(a) the equation of the streamlines, xy2/2 = constant

[22] Be careful not to confuse this term with wing loading, which is an important parameter in calculating the performance of a flight vehicle. Wing loading is defined as the weight of the flight vehicle divided by the wing-planform area.

[23] Geometric twist. Here, the wing has the same section shape from root to tip (e. g., NACA 0012 at every spanwise station), but the wing is physically deformed by twisting the tip relative to the root (Fig. 6.12a). This has the effect of changing the geometric angle of attack along the span so that a = a(y0). If the wing is twisted so that the geometric angle of attack of the tip is less than that of the root, this is termed wash-out. If the angle of attack at the tip is made greater than that at the tip, this is termed wash-in.

[24] Aerodynamic twist. Here, the geometric angle of attack for each wing section is the same across the span, but the wing sections change. For example, the section could be a symmetrical NACA 0012 at the root, a NACA 1410 at mid-semi-span, and a cambered NACA 2408 at the tip (Fig. 6.12b). Of course, the spanwise

[25] Named after Navier (France) and Stokes (England), who independently developed the equations in the early 1800s.

Maximum Range of a Subsonic Airplane

We complete this brief set of applications of basic aerodynamics by estimating the range of a propeller-driven aircraft. The key here is to introduce the rate at which fuel is used by the propulsion system and to use it in determining the rate at which
the weight of an airplane changes with distance. We define the specific fuel consump­tion, c, as:

dwf

Подпись: (9.24)

Подпись: 0 0.00045 0.0009 0.00135 0.0018 0.00225 atmospheric density, p (slug/ft3) Figure 9.7. Determination of service ceiling for Bf-109G.

dt _ weight of fuel consumed per unit time Prated rated engine power output

where the power, Prated, represents the brake-horsepower rating of the engine. From this, we see that the weight of an airplane changes at the same rate as fuel is con­sumed so that the weight change per unit time is:

d – = – c P„„d, (9-25)

Maximum Range of a Subsonic Airplane Подпись: (9.26)

where W(t) represents the aircraft weight. The negative sign is inserted to emphasize that W decreases as fuel is consumed. Working with the differential form of Eq. 9.25, we see that the length of time required for a weight change, dW, is:

and, assuming constant flight speed, the corresponding distance traveled is:

Подпись: (9.27)ds = Vdt _- VdW

cPrated

To find the range, we integrate this expression over the weight change from the ini­tial (full tanks) to the final (empty tanks) condition. Thus, the range, K, is found from:

R Wf

K_[ds = – [ (9.28)

J J cP

0 Wi cPrated

Maximum Range of a Subsonic Airplane Подпись: (9.29)

To simplify the problem, we neglect changes in speed and rate of fuel consumption in initial takeoff and climb to cruising altitude, the effects of wind and atmospheric dis­turbances, and changes in power settings at the end of the flight. We note that in level, unaccelerated flight the power required and power available are equal and that:

Подпись: Wi Wi r TVdW _ r ndW [ cDV _ [ cD Wf Wf Maximum Range of a Subsonic Airplane Подпись: (9.30)

Then, the range equation becomes:

The last series of changes involves multiplying the top and bottom of the integrand by the weight and then replacing the weight in the numerator by the lift because they are equal in level, unaccelerated flight. If it is reasonably assumed that the param­eters c, n, and L/D remain constant during flight, then Eq. 9.30 can be integrated to give the final formula for range:

Подпись: WL W (9.31)

the famous Breguet range equation mentioned in Chapter 1. This was introduced previously to demonstrate the importance of the aerodynamic efficiency in the oper­ation of an airplane. To achieve great range, it is necessary to start with a large mass ratio, as represented by the logarithmic term. This ratio depends on how much fuel can be carried and how efficiently the airplane structure was designed so that its weight is as low as possible. The need for an efficient propeller is illustrated by the direct dependence on p. Finally, there is no question that the L/D ratio must be as large as possible. These ideas were used by Charles Lindbergh in his 1927 flight from New York to Paris in the Ryan Spirit of St. Louis, using the best technology of the time. Material limitations precluded his use of high AR wings, as used in the more recent Voyager around-the-world flight to obtain the best possible L/D ratio. The necessary range for the Spirit was achieved mainly by accommodating the necessary amount of fuel in a relatively light airframe.

To illustrate the use of the Breguet equation, we use it to estimate the range of the Ryan Spirit of St. Louis. This aircraft took off from New York in the spring of 1927 carrying 450 gallons of fuel (weighing 2,750 lbf). The initial gross weight was 5,250 lbf. The best L/D ratio was about L/D = 9.8 (considerably less than the more modern Bf-109G design). The specific fuel consumption of the 220-hp Wright Whirlwind (J-5C) engine at 200 hp was:

c = 0.53 lbf/hr/hp,

Подпись: W Wf Maximum Range of a Subsonic Airplane Maximum Range of a Subsonic Airplane

so that assuming a propeller efficiency of n = 0.82 and a cruising flight at a throttle setting producing 200 hp, the range is given by:

= 2.23.107ft = 4,220 miles,

which is comparable to published values for this aircraft. Examine this calcula­tion to see how the units are adjusted in the specific fuel consumption to give the range in feet. The result is divided by 5,280 ft/mile to determine the range in statute miles.

Maximum Flight Altitude, Absolute and Service Ceilings

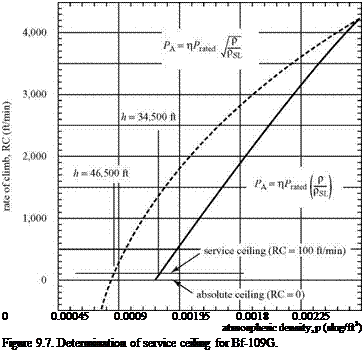
The RC information can be used to estimate the flight altitude that can be reached by an airplane. Again, we use the Messerschmitt fighter as an example. Clearly, the RC decreases with altitude so that the maximum achievable altitude or absolute ceiling, corresponds to the condition at which no further RC is available—that is, the altitude for which there remains no excess power. Such a flight condition is of little use because there is no margin left for maneuvering. For example, if an aircraft is required to execute a simple turn under this flight condition, it would descend because of insufficient thrust for level flight. It would stall if the stall speed happens to be at or near the speed for maximum RC at this altitude. Part of the lift then would be required to produce the turn, and no power would be available to adjust the speed to increase the vertical component of lift needed to balance the weight. Thus, we define the service ceiling, which represents a practical maximum altitude with some excess power remaining for minimal maneuvering capability. The service ceiling is usually defined as that altitude at which the maximum RC drops to 100 ft/min.

If we again neglect the effect of altitude on power available, we can estimate this altitude for an aircraft like the Bf-109G. First, we solve for the power required for the stated RC by using Eq. 9.20:

RC = 100 = TV – DV = 550(0.88 • 1,200 – PR)

W 6,700 ‘

This indicates that for this flight condition, the power required is:

PR = 162.2 horsepower.

Notice the handling of the units in this calculation; it is necessary to convert from horsepower to ft-lbf/sec. The simplest procedure is to vary the density until the required condition is met. Directly solving equations for the density is difficult algebraically. To make a realistic calculation, it is necessary to account for the degradation of power available as the altitude increases. Because we do not have the Daimler-Benz power-available curves, we can only make educated guesses. The simplest possibility is that the power available drops off in direct proportion to the ratio of the density to the sea-level density. A more common assumption is that it drops off as the square root of this ratio, as does the power required. Both cases are displayed in Fig. 9.7, which is a plot of maximum RC versus den­sity. The service ceilings for the cases are 34,500 ft. for the linear dependence on density and 46,500 for the square-root density dependence of the power avail­able. The published service ceiling for the Bf-109G is 37,900 ft., so a reasonable estimate was achieved without knowledge of the exact power-available curves for this aircraft.

Calculation of the Rate of Climb

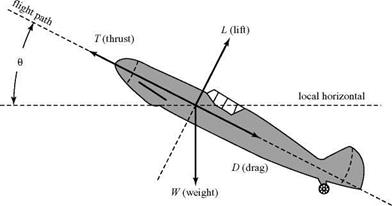
An important performance parameter is the rate at which an aircraft can increase altitude and the time needed to achieve a particular altitude. Estimates for these quantities are determined readily by using tools that we already assembled. We con­sider Fig. 9.6, which show an airplane in climbing configuration. The angle 9 between the velocity vector and the horizontal is the climb angle, which obviously has an important role in the calculation. The force balance in steady-climbing attitude indi­cates that we must have:

jT = D + W sin 9 (9.17)

l = W cos 9, (918)

where lift and drag still are given by the usual formulas. Notice that the thrust force now must carry part of the weight as well as balance the drag.

What is required is the vertical speed, or rate of climb, (RC). This is clearly given as the component of flight speed in the vertical direction:

RC = Esin 9. (9.19)

Equation 9.17 can be used to determine RC by solving for and then multiplying through by the flight speed. The result is:

RC = TV – DV. (9.20)

W

Recalling that force times speed is the power (i. e., rate of doing work), a useful phys­ical interpretation of Eq. 9.20 as well as a practical method for calculating the RC, is obtained. The products of thrust and drag with velocity are the power available and the power required, respectively. Their difference often is called excess power—that
is, the power available to climb or to execute other maneuvers. If the excess power is zero, then an airplane is flying at maximum speed in unaccelerated, level attitude. Therefore, we see that the RC can be written as follows:

RC = excess^power. (9.21)

A pilot controls RC by changing excess power by means of the engine throttle.

Подпись: dPR dV Calculation of the Rate of Climb Calculation of the Rate of Climb Подпись: (9.22)

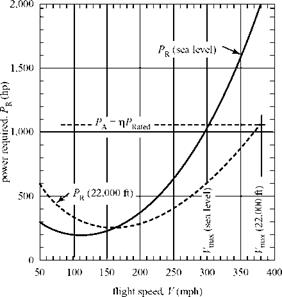
The maximum available RC can be estimated easily if either numerical data or a mathematical expression for the power available is known. In Fig. 9.5, a simple model for PA is illustrated. It assumes that the power available is not affected significantly by flight speed or altitude. In fact, there are usually rather important sensitivities to the speed and air density. In actual practice, we would have the detailed infor­mation available. However, we can use the simple model to illustrate the procedure. Referring to Fig. 9.5, we see that the maximum excess power corresponds to the minimum point in the power-required curve because the power available is assumed to be insensitive to speed. Therefore, it is necessary to estimate this low point and to determine the corresponding flight speed. Comparison of Figs. 9.4 and 9.5 shows that the minima in the thrust required and power-required curves do not occur at the same flight speed. The necessary information is found by setting the derivative of the power required with respect to speed equal to zero to locate the extremum. The value of speed corresponding to minimum power required is found by solving:

Calculation of the Rate of Climb Calculation of the Rate of Climb Calculation of the Rate of Climb Подпись: (9.23)

for this special value of V. The result is:

which shows that the speed to fly for maximum RC is about 24 percent less than the speed to fly for minimum power required (i. e., maximum L/D). Thus, for the Bf – 109G, the best climbing speed at sea level is approximately 163 ft/sec (111 mph). The speed for best RC increases with altitude approximately as the inverse square root of the ratio of density to the sea-level density, as indicated in Eq. 9.23 and verified in Fig. 9.5. Because the power available decreases similarly with altitude, it clear that the RC diminishes with altitude.

Inserting the best climb speed into Eq. 9.15 yields all of the necessary informa­tion for determining RC and climb angle, as summarized in Table 9.5. The results shown agree closely with published data for this aircraft.

Table 9.5. Climb performance of the Bf-109G

Altitude

(ft)

Speed, V (mph)

Excess Power* (horsepower)

Climb Rate, RC (ft/min)

Climb Angle, 0 (degrees)

sea level

111

863.8

4,255

23.5

22,000

154

791.8

3,900

16.1

* Assumes that constant power available = PA = 0.88 • 1,200 = 1,056 horsepower.

Maximum Flight Speed for a Propeller-Driven Aircraft

To find the maximum speed for the propeller-driven Messerschmitt fighter, we follow a procedure similar to that described previously for jet-propelled vehicles. To do this, it is necessary to determine the actual power available for producing thrust. This power can be estimated by reducing the rated power (sometimes called the shaft brake horsepower) by a factor that considers the aerodynamic losses of the propeller. The power available can be written as:

PA = power available = nPRated, (9.16)

where n is the propeller efficiency. A typical value for a good propeller design is on the order of n = 0.88, which was used in the estimated power available shown in Fig. 9.5. There usually is a correction to account for the effects of altitude on engine performance, but this is not indicated in the Figure. The usually significant PA vari­ation with speed also is not represented properly. To graphically find the maximum speed, we locate the point where the power available is equal to the power required. For the case shown, the maximum speed at altitude is about 379 mph (610 km/hr), which is in good agreement with the values shown in Table 9.1. Due to the higher power required at the lower altitude, the maximum speed is reduced, so that at sea level, the Bf-109G is limited to a top speed of about 300 mph (482 km/hr). These

Maximum Flight Speed for a Propeller-Driven Aircraft

Figure 9.6. Airplane in steady climb.

numbers are in good agreement with published data for this airplane. In working with the power equations, recall that:

1 horsepower = 550 f lbf = 746 watts.

sec

Maximum Flight Speed for a Jet Aircraft

In rating the performance of propulsion systems, it is the usual practice to indicate the power available for reciprocating engines and the thrust available for jet engines. Thus, for a jet-propelled aircraft, the maximum flight speed is estimated easily by superposing a plot of thrust available on the thrust-required curve, as calculated in Eq. 9.9. The intersection of the two curves indicates graphically the point at which the available thrust is exactly equal to that required for level flight. The corresponding speed represents the maximum flight speed.

Equivalently, we equate the expression for the thrust available (usually a func­tion of speed) to the thrust available and then solve for the corresponding speed. In carrying out this calculation, it is necessary to use a model of the propulsion-system performance as a function of flight speed. A manufacturer of a system usually pro­vides these data to an airframe designer.

To estimate the maximum flight speed for a reciprocating-engine propulsion system, it is most useful to work with power instead of thrust. We accomplish this in the next subsection and illustrate results for the Bf-109G.

Power Required for Level Flight

Recalling that power is the rate at which work is done and that the work done by an engine is the thrust force times the distance traveled, then the power required for unaccelerated, level flight is:

Подпись:Maximum Flight Speed for a Jet Aircraft(9.14)

Maximum Flight Speed for a Jet Aircraft Подпись: 2 ^

where V is flight speed. Using Eq. 9.9, we find:

Подпись: 2Maximum Flight Speed for a Jet Aircraft(9.15)

This expression is plotted in Fig. 9.5 for the example airplane at two altitudes (i. e., sea level and 22,000 ft) to illustrate the effect of atmospheric density on the results.

Figure 9.5. Power required for Bf-109G.

Maximum Flight Speed for a Jet AircraftNotice that at low speed, the power required is higher for the high-altitude case, whereas for high speeds, the opposite is true. This is due to of the parasite-drag penalty that dominates in the high-speed range. The effect of the induced drag becomes much smaller at high speeds, as indicated by Eq., 9.15. Therefore, the higher density for the low-altitude case results in more power required at a given flight speed.
Stalling Speed

Подпись: VStall _ Подпись: pSC Stalling Speed

The curves shown in Fig. 9.4 are extended into a low speed-range that is not actu­ally accessible to the clean Bf-109G. The airplane probably would not fly in its clean configuration at a speed of less than about 90 mph. This stalling speed can be esti­mated by using the largest possible lift coefficient that reasonably could be expected without deflected flaps or slats. When we solve Eq. 9.5 for the flight speed for a given maximum lift coefficient, the result is:

If a value of CL max = 1.4 is used in this result, the minimum (i. e., stalling) flight speed at sea level in the clean aerodynamic condition is about 104 mph. The need for flaps and other high-lift devices is clear because this is an uncomfortably high speed at which to land an airplane.

Speed for Minimum Thrust Required

Подпись: dTR dq Подпись: Do Stalling Speed Stalling Speed Подпись: (9.11)

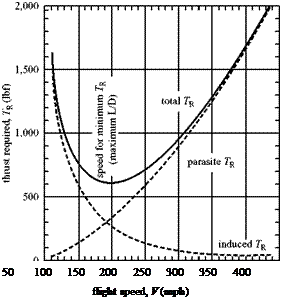
Notice that there is a special speed at which the thrust required is a minimum. It is clear (see Eq. 9.6) that this condition corresponds to the speed at which the L/D ratio is maximum. It is curious that this occurs at the point where the induced and parasite drags are exactly equal. The reason for this becomes clear if we determine the condition for a minimum value by taking the derivative of the thrust required with respect to the speed (or corresponding dynamic pressure) and setting it equal to zero. We find:

which shows that for minimum thrust required we must have:

CDo = CDi,

Подпись: ^minT™ Подпись: W / S

as shown graphically in Fig. 9.4. What is important from a performance standpoint is that the speed we must fly to reduce the thrust (and drag) to a minimum corresponds to the condition of Eq. 9.11. Solving for the value of dynamic pressure, q, that cor­responds to the minimum, we find:

Do

Подпись: VminTR = V (L / D)n Stalling Speed Подпись: (9.12)

and the associated flight velocity is:

This flight-speed information is important in the effective operation of an air­plane because flying at maximum L/D ratio (i. e., minimum drag or thrust required) is required to achieve the maximum range or minimum fuel consumption, as demonstrated in a subsequent subsection. For the Bf-109G at sea level, Eq. 9.12 yields a value of about 210 ft/sec (143 mph), as indicated in Fig. 9.4. Notice that this speed changes with altitude, as indicated by the appearance of density in Eq. 9.12.

We now can determine the maximum L/D ratio for the Messerschmitt Bf-109G. This is easy because it is clear that the drag coefficient is equal to twice the parasite – drag coefficient at the best L/D speed. We take the ratio of the lift and drag coefficients and insert the value for the best speed from Eq. 9.12; the result is:

Подпись: (9.13)(L) = 1 jne AR

‘D ‘ max 2 у Cd0

which yields a value of about 12 for the Bf-109G:

= 12.1 for Bf – 109G.

max

If a pilot suffers an engine failure, he or she should glide at 143 mph to achieve the best chance to find a suitable field for a successful off-field landing. Flying slower may increase the time in the air but results in less distance covered in search of a good landing field.

Thrust Required for Level Flight

If Eq. 9.4 is divided by Eq. 9.5, we find that the ratio of thrust required to total air­plane weight is equal to the ratio of the drag coefficient to the lift coefficient, or:

Подпись: (9.6)T = TR = thrust required = – jjD ’

which illustrates again the importance of the L/D ratio in performance character­istics. That is, to minimize the amount of thrust that must be used in level flight, the L/D ratio must be as large as possible. It is useful to determine how the thrust required varies with flight speed; Eq. 9.3 provides the needed information. First, we calculate the required lift coefficient to provide the lift to balance the weight as a function of flight speed:

Подпись: (9.7)C = _W = 2W

Cl qS pv2s •

Figure 9.4. Thrust required for Bf-109G.

Подпись:

Thrust Required for Level Flight Thrust Required for Level Flight

Substituting this result into Eq. 9.3 gives the drag coefficient as a function of flight speed; namely:

Подпись: TR _ qSCDo + Thrust Required for Level Flight

Notice that the induced-drag coefficient decreases rapidly (as the inverse fourth power of the speed) as V increases. This indicates that induced drag is most impor­tant at lower speeds, whereas the parasite drag dominates at high speed. The thrust required as a function of velocity is found readily by means of Eq. 9.4. We find:

This is plotted in Fig. 9.4 for the Messerschmitt Bf-109G. All values shown are for standard sea-level atmospheric conditions. (The changes that result from higher alti­tudes are checked in an exercise at the end of the chapter.) Both the induced-and parasite-drag contributions are plotted separately and compared to the total thrust required.

Extension to Other Flight Conditions: Drag Polar

Because the detailed analysis refers to only one flight condition—namely, high­speed level flight—it is useful to find a way to extend the collected data to estimate the airplane performance at other speeds. For the moment, we assume the following:

1. The parasite-drag coefficient stays effectively constant over a wide range of speeds.

2. The compressibility effect can be neglected.

3. The flaps, slats, cowl flaps, and landing gear remain undeployed.

4. There is no wind or atmospheric turbulence.

Clearly, these assumptions result in an approximate analysis because compressibility was shown to account for a substantial drag rise at the top-speed condition. Also, para­site drag is likely to depend on the angle of attack of the airplane, which must increase

Подпись: CDo = overall parasite-drag coefficient Подпись: 5.227 172 Подпись: 0.0307.

as the speed decreases so that the necessary lift is produced. However, a reasonable estimate of the Bf-109G performance over its operational speed range can be made in the manner suggested. Using the wing area and other information already assem­bled, we can summarize the aero-dynamic behavior of this example airplane in the following manner, recalling that we separated the total drag into two categories: drag due to lift (induced drag) and parasite drag. Then, if we assume minor influence of speed and aircraft attitude on the parasite drag, the value for the Bf-109G is:

The induced-drag coefficient:

C. = CL Dl neAR

depends on flight speed because the lift coefficient must be adjusted to provide the necessary lift as dynamic pressure changes. The total drag is expressed by:

Подпись: (9.3)c2

C =C + C = C + Cl

CD CDo + CDi CDo + neAR,

which often is referred to as the drag polar for the airplane. If it is assumed that the airplane is in level, equilibrium (i. e., unaccelerated) flight with the drag exactly bal­anced by the thrust produced by the propulsion system and the weight balanced by the lift, then we can write:

T = D = qSCL (9.4)

[W = L = qSC} (9.5)

where q = 1pV2 and S is the projected wing area, including the part enclosed by the fuselage. Equations 9.3-9.5 now can be evaluated using the Bf-109G data to deter­mine useful information about its performance.

Aircraft-Performance Calculations

In previous chapters, we introduce other ways to describe the aerodynamic efficiency. One that is useful is the “lift-to-drag ratio,” or L/D. For the Bf-109G, the L/D ratio for the high-speed cruise condition we analyze is:

Подпись: 5.83,CL 0.21

CD 0.036

which is based on the lift coefficient for cruise and the total drag coefficient (i. e., the total drag area divided by the wing area). This is a fairly good value, indicating that the Bf-109 is a relatively clean aircraft; however, it would not make a good glider (at least, not at 610 km/hr) because from a 1-km altitude, it would be on the ground in less than 6 km with the engine off. Why is this so? Is this L/D ratio a good indication of the overall aerodynamic performance of the aircraft? Is there a speed at which the L/D ratio is higher? These questions deserve careful consideration, and we do this in the remainder of this chapter. We seek the means to represent the overall performance over the entire speed range, along with useful information such as the maximum rate of climb, ceiling (i. e., maximum altitude), stalling speed, power required as a function of flight speed, maximum range, maximum endur­ance, speeds to fly for maximum climb rate, best range maximum endurance, and so on. These matters usually are considered as part of the subject of airplane per­formance. However, it is useful to complete this book with a short introduction, because it summarizes what has been accomplished to this point and emphasizes key results.