Category Introduction to Structural Dynamics and Aeroelasticity

Lagrange’s Equations

A.1 Introduction

When we wish to use Newton’s laws to write the equations of motion of a particle or a system of particles, we must be careful to include all the forces of the system. The Lagrangean form of the equations of motion that we derive herein has the advantage that we can ignore all forces that do no work (e. g., forces at frictionless pins, forces at a point of rolling contact, forces at frictionless guides, and forces in inextensible connections). In the case of conservative systems (i. e., systems for which the total energy remains constant), the Lagrangean method gives us an automatic procedure for obtaining the equations of motion provided only that we can write the kinetic and potential energies of the system.

A.2 Degrees of Freedom

Before proceeding to develop the Lagrange equations, we must characterize our dynamical systems in a systematic way. The most important property of this sort for our present purpose is the number of independent coordinates that we must know to completely specify the position or configuration of our system. We say that a system has n degrees of freedom if exactly n coordinates serve to completely define its configuration.

example 1 A free particle in space has three degrees of freedom because we must know three coordinates—x, y, z, for example – to locate it.

example 2 A wheel that rolls without slipping on a straight track has one degree of freedom because either the distance from some base point or the total angle of rotation will enable us to locate it completely.

A.3 Generalized Coordinates

We usually think of coordinates as lengths or angles. However, any set of parameters that enables us to uniquely specify the configuration of the system can serve as coordinates. When we generalize the meaning of the term in this manner, we call these new quantities “generalized coordinates.”

example 3 Consider a bar rotating in a plane about a point O. The angle of rotation with respect to some base line is suggested as an obvious coordinate for specifying the position of the bar. However, the area swept over by the bar would do equally well and therefore could be used as a generalized co­ordinate.

If a system has n degrees of freedom, then n generalized coordinates are neces­sary and sufficient to determine the configuration.

A.4 Lagrange’s Equations

In deriving these equations, we consider systems having two degrees of freedom and hence are completely defined by two generalized coordinates q1 and q2. However, the results are easily extended to systems with any number of degrees of freedom.

Suppose our system consists of n particles. For each particle, we can write by Newton’s second law

MiXi = Xi

Miji = Yi (A.1)

MiZi = Zi

where xi, yi, and Zi are the rectangular Cartesian coordinates of the ith particle; Mi is the mass; and Xi, Yi, and Z are the resultants of all forces acting on it in the x, y, and Z directions, respectively.

If we multiply both sides of Eqs. (A.1) by Sxi, Syi, and Szi, respectively, and add the equations, we have

Mi (Xi SXi + yi Syi + Zi Szi) = Xi SXi + Yi Syi + Zi Szi (A.2)

The right-hand side of this equation represents the work done by all of the forces acting on the ith particle during the virtual displacements Sxi, Syi, and Szi. Hence, forces that do no work do not contribute to the right-hand side of Eq. (A.2) and may be omitted from the equation. To obtain the corresponding equation for the entire system, we sum both sides of Eq. (A.2) for all particles. Thus

n n

Mi (xi Sxi + yi Syi + zi Szi) = (Xi Sxi + Yi Syi + Zi Szi) (A.3)

i=1 i=1

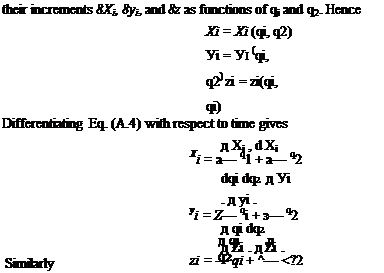
Now, because our system is completely located in space if we know the two generalized coordinates q1 and q2, we must be able to write xi, yi, and zi as well as

Lagrange’s Equations

(A.4)


(A.5)


д Xi д Xi

д qi 4 д q2 42

д yi д yi

8yi =— 8qi + — 8q2 д qi дq2

д Zi д Zi

8 Zi =— 8qi + — 8q2

д qi д q2

If we substitute these into Eq. (A.3) and rearrange the terms, we obtain


(A.6)


Lagrange’s Equations

(A.7)


Lagrange’s Equations

[1] Presently, Dr. Patil is Associate Professor in the Department of Aerospace and Ocean Engineering at Virginia Polytechnic and State University.

[2] Portions of section 2.5 including figures 2.8 and 2.9 are excerpted from Simitses and Hodges (2006) and (2010), used with permission.

[3] Each function must satisfy at least all boundary conditions on displacement and rotation (often called the “geometric” boundary conditions). It is not necessary that they satisfy the force and moment boundary conditions, but satisfaction of them may improve accuracy. However, it is not easy, in general, to find functions that satisfy all boundary conditions.

[4] Each function must be continuous and p times differentiable, where p is the order of the highest spatial derivative in the Lagrangean. The pth derivative of at least one function must be nonzero. Here, from Eq. (3.297), p = 2.

[5] If more than one function is used, they must be chosen from a set of functions that is complete. This means that any function on the interval 0 < x < I with the same boundary conditions as the problem under consideration can be expressed to any degree of accuracy as a linear combination of the functions in the set.

a computer code based on a panel method for design and analysis of subsonic isolated airfoils (see Drela, 1992).

[7] Specify an altitude, which fixes the parameter p.

[8] Specify an initial guess for MTO of, say, zero.

[9] If one does not have ready access to a root-finding application, this step may be replaced by the

[10] Rusak (2011), private comm.

Flutter Flight Tests

In this chapter, we consider the general problem of lifting-surface flutter. Several types of flutter analysis were presented, including the p method, classical flutter analysis, к method, and p-к method. The application of classical flutter analysis to discrete one – and two-degree-of-freedom wind-tunnel models was presented. Stu­dents were exposed to Theodorsen’s unsteady thin-airfoil theory along with the more modern finite-state thin-airfoil theory of Peters et al. Application of the assumed- modes method to construct a flutter analysis of a flexible wing was demonstrated as well. The important parameters of the flutter problem were discussed, along with current design practice, flight testing, and certification. With a good understanding of the material presented herein, students should be sufficiently equipped to apply these fundamentals to the design of flight vehicles.

Moreover, with appropriate graduate-level studies well beyond the scope of material presented herein, students will be able to conduct research in the exciting field of aeroelasticity. Current research topics are quite diverse. With the increased sophistication of controls technology, it has become more common to attack flutter problems by active control of flaps or other flight-control surfaces. These so-called flutter-suppression systems provide alternatives to costly design changes. One type of system for which flutter-suppression systems are an excellent choice is a military aircraft that must carry weapons as stores. These aircraft must be free of flutter within their flight envelope for different configurations, sometimes many different configurations. At times, avoidance of flutter by design changes is simply beyond the capability of designers for such complex systems. There is also a body of research to determine in flight when a flutter boundary is being approached. This could be of great value for situations in which damage had altered the properties of the aircraft structure—perhaps unknown to the pilot—thus shifting the flutter (or divergence) boundary and making the aircraft unsafe to operate within its original flight envelope. Other current problems of interest to aeroelasticians include improved analysis methodology for prediction of flutter, gust response, and limit-cycle oscillations; design of control systems to improve gust response and limit-cycle oscillations; and incorporation of aeroelastic analyses at an earlier stage of aircraft design.

In this step, we take off and fly at the lowest speed at low altitude and in level flight. We then measure the response due to air turbulence and conduct FFT and PSD analyses. We determine whether these results match our analytical predictions. If they do not, we must again correct and/or adjust the model until we obtain agree­ment. When they eventually agree, we then may proceed to activate the actuators for an impulse command. Next, we determine whether there is sufficient damping. If there is, we conduct a sweep of frequencies and conduct FFT and PSD analyses of frequencies and damping. If these results match the analyses, then we may (cau­tiously!) activate actuators at the calculated flutter frequency and conduct FFT and PSD analyses of the response. When the damping measurements match the theo­retical predictions, we activate actuators for a step command. Next, we determine whether the response matches the analyses. When it does, we collect and store data in the form of U – g – g’ diagrams. Only if and when there is reasonable agreement with analyses may we proceed to perform a 2g maneuver at the same speed and altitude. At this level of gs, we activate the actuators for an impulse command to see whether there is sufficient damping. If there is, we move on to 3g, then 4g, and so on, all at the same airspeed and altitude, until we have tested the complete set of specified load factors within the flight envelope.

If our model is still in agreement with the results obtained at any stage, only then is it safe to go to a higher speed (e. g., 25 knots faster) at the same altitude. At this point, we repeat all of the steps and collect data in the form of U – g – g’ diagrams. We systematically and cautiously increase the speed up to its maximum, checking at every increment to ensure that our analysis is valid. Similarly, we systematically increase altitude to its maximum and repeat the regimen. We stop (i. e., reduce speed to the previous safe speed) immediately whenever any one of the following happens:

1. There is even the slightest indication that the damping coefficient g decreases below 2% (5% in a civil aircraft).

2. Oscillations in at least one of the measurements diverge and tend to grow beyond preapproved limits.

3. The dominant frequency deviates from the predicted mode frequency.

Thus, it is observed that the analysis of flutter is strongly based on theoretical studies. The theory is the work tool for analysis and decisions about critical config­urations and flight conditions. Ground-vibration experiments are used to tune the analysis to yield accurate structural-dynamics modes and wind-tunnel experiments to tune the unsteady-aerodynamics code.

Flutter flight tests are extremely dangerous. Real-time measurements and vari­ous actuation techniques are used to estimate the damping of the airplane at various flight altitudes, speeds, and load factors, moving from one point to another with caution. Analysis, ground experiments, and flight tests always go together to provide full clearance for flight without any flutter problems.

Ground Roll (Taxi) and Flight Tests

A special experimental aircraft is equipped with the capability of making realtime measurements of the amount of fuel, airspeed, Mach number, altitude, load factors, and control surface deflections. The aircraft is also instrumented as in the ground – vibration tests with strain gages and accelerometers. Special actuators are included to operate the ailerons and elevators over a range of frequencies. A sweep of actuation frequencies is first conducted to identify important modes. In addition, at certain frequencies, responses to step and impulse commands are measured.

Ground Roll (Taxi) Measurements. Aircraft ground roll (taxi) provides the first insight into an airplane’s aeroelastic response. The relatively rough runway excites the airplane’s structural modes. In addition, here we conduct a sweep of frequencies and FFT-PSD analyses of measurements and determine whether results match with analysis predictions of aeroelastic behavior at near zero speeds. If they do not, we must stop the test to correct and/or adjust the computational model until agreement is found, and then flutter predictions are reevaluated. Only when results do agree, may we then proceed to take off.

Flight Tests. In this step, we take off and fly at the lowest speed at low altitude and in level flight. We measure the airplane’s response to air turbulence and conduct FFT and PSD analyses. We determine whether these results match our analytical predictions for the tested speed. If they do not, we must again stop the test to correct and/or adjust the computational model until we find agreement. When they do agree, we then may proceed to activate the actuators for an impulse command. Next, we determine whether there is sufficient damping. If there is, we conduct a sweep of frequencies and conduct FFT and PSD analyses of frequencies and damping. If these results match the analysis, then we may (cautiously!) activate actuators at the calculated flutter frequency and conduct FFT and PSD analyses of the response. When the damping measurements match theoretical predictions, then we activate actuators for a step command. Next, we determine whether the response matches the analysis. When it does, we then collect and store data in the form of U-g-g’ diagrams. Only if and when there is reasonable agreement with analyses we proceed cautiously to perform maneuvers at various load factors at the same speed and altitude. During each maneuver, we activate the actuators for an impulse command to see whether there is sufficient damping. If there is, we move on to increase the load factor until the complete set of specified load factors within the flight envelope is tested.

If our computed predictions are in agreement with the results obtained at any stage, only then is it safe to go to a higher speed (e. g., 25 knots faster) at the same altitude. At this point we repeat all of the steps, collecting and storing data in the form of U-g-g’ diagrams. We systematically and cautiously increase the speed up to its maximum, checking at every increment to ensure that our analysis is valid. Similarly, we systematically increase altitude to its maximum and repeat the regimen. We stop (i. e., reduce speed to the previous safe speed) immediately whenever any one of the following happens:

1. A modal damping coefficient g decreases below the level of damping required by regulations (5% in a civil aircraft).

2. Oscillations in at least one measurement diverge and grow beyond preapproved limits.

3. The dominant frequency deviates from its predicted value.

Thus, it is observed that the analysis of airplane flutter is strongly based on theoretical studies. The theory is the work tool for analysis and decisions about critical configurations and flight conditions. Ground vibration experiments are used to tune the structural dynamics analysis to yield accurate structural modes, and wind tunnel experiments to tune the unsteady aerodynamics code. Flutter flight tests are extremely dangerous. Real-time measurements and various actuation techniques are used to estimate the damping of the airplane at various flight altitudes, speeds, and load factors and move from one point to another with much caution. Analysis, ground experiments and flight tests always go together to provide full clearance for flight without flutter problems.

Wind Tunnel Flutter Experiments

The design of wind tunnel models that accurately represent the flutter situations of a real airplane is a complex task—quite possibly an art! The main challenge is to compose a small-scale version of the aircraft with tuned structural dynamics and a sufficiently detailed geometry that correctly reflects the aircraft’s static and unsteady aerodynamic behavior. For these tests, the model is supported by soft cables and equipped with strain gages and accelerometers at the roots and tips of wings, at the tips of horizontal and vertical tails, and on the nose. Flow turbulence is used to excite the model aeroelastic modes. FFT and PSD analysis of the various measured model deformations are used to estimate the flutter speed, frequency and severity.

The wind tunnel tests provide essential insight into the possible modes of flutter of an airplane. The tests help verify computed results as well as identify unknown aeroelastic phenomena related to the airplane configuration. However, it should be recognized that unsteady flow phenomena are strongly governed by scale, so that reduced frequency, flow Reynolds number, separation between vortices, and interac­tions between shockwaves and boundary layers may not be correctly represented by small-scale models. In such experiments, results may lead to an inaccurate prediction of flutter occurrence in the full-scale airplane. In addition, testing of small-scale mod­els in the wind tunnel provides benchmark cases for improving the computational models and tuning the unsteady aerodynamics analysis codes.

Ground-Vibration Tests

The purpose of structural dynamics experiments on the ground is to validate the fre­quencies and mode shapes of a clean airplane or important airplane configurations. To accomplish this, the airplane is equipped with strain gages and accelerometers at the roots and tips of the wings, of the horizontal and vertical tails, and of the air­plane nose. The airplane is placed on soft supports to mimic the airplanes free-free structural dynamics. Vertical actuators (i. e., shakers) are used at the tips of the wing and horizontal tail; both vertical and side shakers may be used at the tips of the nose and vertical tail. There is a variety of signal analysis methods to identify natural fre­quencies, mode shapes, and structural damping from the measurements. Generally, the actuators have a bandwidth up to 30 Hz, and a sweep of actuation frequencies is first conducted from 0.1 to 30 Hz to identify the symmetric and antisymmetric modes in this range. Classical techniques, such as Fast Fourier Transformation (FFT) and Power Spectral Density (PSD), are used for spectral analysis of unsteady elastic deformation signals to identify the natural frequencies. At this point, we must con­tinue to study details of the dynamic response at the natural bending and torsional frequencies of interest for flutter or other aeroelastic phenomena. For each mode, this entails the following:

1. Induce oscillatory motion of the mode at a certain natural frequency, measure the response, and perform an FFT analysis to identify the resonance frequency and structural damping of that mode.

2. Induce a step-function command from oscillatory motion to zero, measure the decay rate, and infer the structural damping of that mode.

3. Induce an impulsive function, measure the decay rate, and infer structural damp­ing of the mode.

Now we are ready to compare experimentally measured frequencies and mode shapes with detailed finite-element predictions. Using well-established techniques, we tune our finite element model to yield frequencies and mode shapes that fit the ground-vibration test data.

Structural Dynamics, Aeroelasticity, and Certification[10]

So, with all of this background on theoretical methods, what are some of the ways aeroelasticity and structural dynamics analyses are actually used? We must recall that for every aircraft, there may be dozens to several hundred combinations of fuel and payloads that must be verified as stable within the aircraft’s flight envelope before clearance for flight is given. The use of computational results is crucial because we cannot possibly test every combination of fuel and hardware mounted on the fuselage and wings (e. g., stores, armaments, fuel tanks). Computational results then become our main work tool for every go/no-go decision made in flight-testing and ultimate airplane certification for flight.

To proceed with this monumental set of tasks, we first need to identify the most critical combinations (i. e., those with the lowest flutter speeds). If possible, these should be compared with previous experience in terms of computation and flight­testing. Once the most critical configurations are identified, we set them aside for special wind-tunnel and flight tests. In particular, we need to ascertain the flutter mode’s shape, frequency mF, speed UF, and severity g’ = dg/dU, all evaluated at the flutter speed (i. e., where g vanishes). Identification of all four items allows us to distinguish between various cases with comparable flutter speeds and, together with previous experience, to decide about further needed ground and flight tests to verify computations and flight clearance.

Flutter Boundary Characteristics

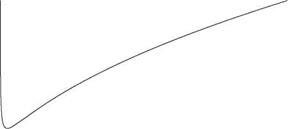
The preceding sections describe procedures for the determination of the flutter boundary in terms of altitude, speed, and Mach number. For a standard atmosphere, any two of these conditions are sufficient to describe the flight condition. The final flutter boundary is presented frequently in terms of a dimensionless flutter speed as UF/(brne). The parameter U/(bme) sometimes is referred to as the reduced velocity, although the reciprocal of the reduced frequency U/(ba>) is also sometimes so des­ignated. A useful presentation of this reduced flutter speed as a function of the mass ratio, д = m/(npmb2), is illustrated in Fig. 5.14. It is immediately apparent that the flutter speed increases in a nearly linear manner with increasing mass ratio. This re­sult can be interpreted in either of two ways. For a given configuration, variations in д would correspond to changes in atmospheric density and, therefore, altitude. In such a case, the mass ratio increases with increasing altitude. This implies that any flight vehicle is more susceptible to aeroelastic flutter at low rather than higher altitudes.

A second interpretation of the mass ratio is related to its numerical value for any fixed altitude. The value of д depends on the type of flight vehicle, as re­flected by the mass per unit span of the lifting surface, m. Table 5.2 lists vehicle configurations and typical mass-ratio values for atmospheric densities between sea level and 10,000 feet.

Table 5.2. Variation of mass ratio for typical vehicle types

Vehicle type

n — m

n Прю b2

Gliders and Ultralights

5-15

General Aviation

10-20

Commercial Transports

15-30

Attack Aircraft

25-55

Helicopter Blades

65-110

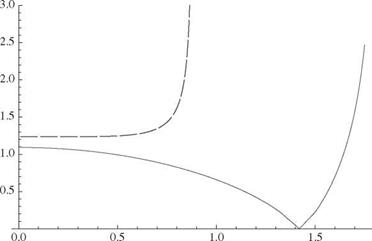
The flutter boundary is sensitive to the dimensionless parameters. In Fig. 5.15, for example, we see a dramatic change in the flutter speed versus the frequency ratio a = mh /шв for a case with very small mass ratio. Even so, the significant drop in the flutter speed for xe = 0.2 around a = 1.4 is of utmost practical importance. There are certain frequency ratios at which the flutter speed becomes very small, depending on the values of the other parameters. This dip is observed in the plot of flutter speed versus frequency ratio for the wings of most high-performance aircraft, which have relatively large mass ratios and positive static unbalances. The chordwise offsets also have a strong influence on the flutter speed, as shown in Fig. 5.16. Indeed, a small change in the mass-center location can lead to a large increase in the flut­ter speed. The mass-center location, e, cannot be changed without simultaneously changing the dimensionless radius of gyration, r ; however, the relative change in the flutter speed for a small percentage change in the former is more than for a similar percentage change in the latter. These facts led to a concept of mass-balancing wings to alleviate flutter, similar to the way that control surfaces are mass-balanced. If the center of mass is moved forward of the reference point, the flutter speed is generally

uf b IPg

Flutter Boundary Characteristics

Figure 5.15. Plot of dimensionless flutter speed versus frequency ratio for the case n = 3, r = 1/2, and a = —1/5, where the solid line is for xe = 0.2 and the dashed line is for xe = 0.1

Подпись: btOg 7 г
Подпись:
Flutter Boundary Characteristics

e

relatively high. Unfortunately, this is not easily accomplished; however, a large change is not usually needed to ensure safety. Note that care must be exercised in examining changes in other parameters caused by such changes in the mass distribu­tion. For example, the torsional frequency may be altered significantly in the process of changing the radius of gyration. Finally, we note that the flutter frequency for bending-torsion flutter is somewhere between and шв, where normally a < 1; however, situations arise in which the flutter frequency may exceed шв.

It is important to note that there are some combinations of the chordwise offset parameters e and a for which the current simplified theories indicate that flutter is not possible. The classic textbook by Bisplinghoff, Ashley, and Halfman (1955) clas­sified the effects of the chordwise offsets e and a in terms of small and large a. For small a, they noted that flutter can happen only when the mass center is behind the quarter-chord (i. e., when e > -1/2); thus, it cannot happen when e < -1/2. For large a, flutter can happen only when the elastic axis is in front of the quarter-chord (i. e., when a < -1/2); thus, it cannot happen when a > -1/2. Moreover, for the typical – section model in combination with the aerodynamic models presented herein, flutter does not appear to happen for any combination of a and r when the mass centroid, elastic axis, and aerodynamic center all coincide (i. e., when e = a = -1/2). Even if this prediction of the analysis is correct, practically speaking, it is difficult to achieve coincidence of these points in wing design. Remember, however, that all of these statements are made with respect to simplified models. We need to analyze real wings in a design setting using powerful tools, such as NASTRAN™ or ASTROS™. In­deed, bending-torsion flutter is a complicated phenomenon and it seems to defy all of our attempts at generalization. Additional discussion of these phenomena, along with a large body of solution plots, is found in Bisplinghoff, Ashley, and Halfman (1955).

The final flutter boundary can be presented in numerous ways for any given flight vehicle. The manner in which it is illustrated depends on the engineering purpose that it is intended to serve. One possible presentation of the flutter boundary is to

Flutter Boundary Characteristics

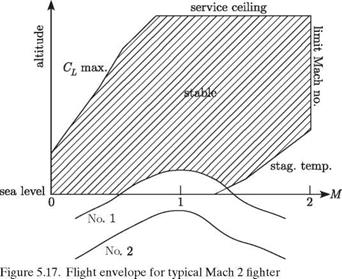
superpose it on the vehicle’s flight envelope. A typical flight envelope for a Mach 2 attack aircraft is illustrated in Fig. 5.17 with two flutter boundaries indicated by the curves marked No. 1 and No. 2. The shaded region above the flutter boundaries, being at higher altitudes, corresponds to stable flight conditions; below the boundaries, flutter will be experienced. Flutter boundary No. 1 indicates that for a portion of the intended flight envelope, the vehicle will experience flutter. Note that these conditions of instability correspond to a flight Mach number near unity (i. e., transonic flow) and high dynamic pressure. This observation can be generalized by stating that a flight vehicle is more susceptible to aeroelastic flutter for conditions of (1) lower altitude, (2) transonic flow, and (3) higher dynamic pressure.

If it is determined that the vehicle will experience flutter in any portion of its intended flight envelope, it is necessary to make appropriate design changes to elim­inate the instability for such conditions. These changes may involve alteration of the inertial, elastic, or aerodynamic properties of the configuration; often, small varia­tions in all three provide the best compromise. Flutter boundary No. 2 is indicative of a flutter-safe vehicle. Note that at the minimum altitude-transonic condition, there appears to be a safety margin with respect to flutter instability. All flight-vehicle spec­ifications require such a safety factor, which is generally called the “flutter margin.” Most specifications require that the margin be 15% over the limit-equivalent air­speed. In other words, the minimum flutter speed at sea level should not be less that 1.15 times the airspeed for the maximum expected dynamic pressure as evaluated at sea level.

Finite-State Unsteady Thin-Airfoil Theory of Peters et al

Although Theodorsen’s theory is an excellent choice for classical flutter analysis, there are situations in which an alternative approach is needed. First, we frequently need to calculate the modal damping in subcritical flight conditions. Second, there is a growing interest in the active control of flutter, and design of controllers requires that the system be represented in state-space form. To meet these requirements, we need to represent the actual aerodynamic loads (which are in the frequency
domain in Theodorsen’s theory) in terms of time-domain differential equations. Finite-state theories approximate the actual infinite-state aerodynamic model to within engineering accuracy. One such approach is the finite-state, induced-flow theory for inviscid, incompressible flow of Peters et al. (1995).

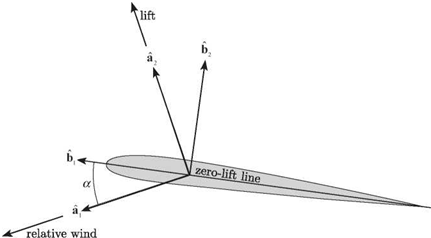
Consider a typical section of a rigid, symmetric wing (see Fig. 5.2) and the additional vectorial directions defined in Fig. 5.11. To begin the presentation of this theory, we first relate the three sets of unit vectors, as follows:

1. A set fixed in the inertial frame, i1 and i2, such that the air is flowing at velocity – Ui1

2. A set fixed in the wing, b1 and b2, with b1 directed along the zero-lift line toward the leading edge and b2 perpendicular to b1

3. A set a1 and a2 associated with the local relative wind vector at the three-quarter chord, such that a1 is along the relative wind vector and a2 is perpendicular to it, in the assumed direction of the lift

The relationships among these unit vectors can be stated simply as
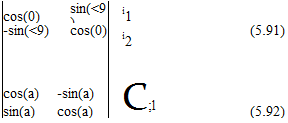
Подпись: cos(0) sin(<9) i1 (5.91) -sin(<9) cos(0) i2 cos(a) sin(a) -sin(a) cos(a) C;l (5.92)

Finite-State Unsteady Thin-Airfoil Theory of Peters et al Подпись: Figure 5.11. Schematic showing geometry of the zero-lift line, relative wind, and lift directions

and

and i3 = a3 = b3 = b1 x b2.

Induced-flow theories approximate the effects of shed vortices based on changes they cause in the flow field near the airfoil. Thus, the velocity field near the airfoil consists of the freestream velocity plus an additional component to account for the
induced flow. Although the induced flow varies throughout the flow field, we ap­proximate its value near the airfoil as an average value along the chordline. Thus, the local inertial velocity of the air is written approximately as – Ui1 – X0b2, where X0 is the average induced flow (perpendicular to the airfoil zero-lift line). Accord­ing to classical thin-airfoil theory, we should calculate the angle of attack using the instantaneous relative wind-velocity vector as calculated at T. To represent the relative wind-velocity vector at T, we can write the relative wind vector (i. e., the velocity of the wing with respect to the air) as Wa1 and set it equal to the inertial velocity of T minus the inertial air velocity; that is

Подпись: (5.93)Подпись:Wa1 = vT – (—Ui1 – X0b2)
= VT + U ii + Xq1&2

where vt is the inertial velocity of the three-quarter chord, given by

Vt = Vp + 063 x rpt

Finite-State Unsteady Thin-Airfoil Theory of Peters et al
and rPT is the position vector from P to T. Fig. 5.2 shows that

Alternatively, we may write the relative wind in terms of its components along lb1 and bi 2; that is

Подпись: (5.100)Wa1 = Wcos(a)lb1 – W sin(a)b2

Подпись: tan(a) Подпись: a1 • lb2 ^1 • 61 Подпись: (5.101)

where a is given by (see Fig. 5.11)

Using Eq. (5.99), we find that

■ b1 = Ucos(0) – hsin(e)

Подпись:Wai ■ b2 = —Usin(0) – hcos(6) + b(a — 2 j в + k0

Подпись: h b a =в + U + U Finite-State Unsteady Thin-Airfoil Theory of Peters et al Подпись: (5.103)

Assuming small angles, we now may show that

W = U + higher-order terms

According to this derivation, a is an effective angle of attack based on the relative wind vector at the three-quarter chord, which, in turn, is based on the average value of the induced flow k0 over the wing chordline. Note that a is not equal to the pitch angle в. Because of the motion of the wing and the induced flow field, the relative wind direction is not fixed in inertial space. Therefore, the effective angle of attack depends on the pitch rate, the plunge velocity, and the induced flow. Moreover, the lift is assumed to be perpendicular to the relative wind vector. This assumption is adequate for the calculation of lift and pitching moment, which are both first-order in the motion variables. However, sufficiently rapid plunge motion (e. g., as in the flapping wings of an insect) can result in a value of a that is not small, and we would need to make “small but finite” angle assumptions to calculate the drag (or propulsive force equal to negative drag) that could be encountered in such situations.

Подпись: L = npTOb2 (h + US — ba0) + 2np(XlUb Mi = —np^b3 Подпись: h + Uв + b( 2 — a � — Л0 Подпись: (5.104)

The total lift and moment expressions including the noncirculatory forces are

Note the similarity between Eqs. (5.104) and (5.82). In particular, by studying the circulatory lift in both lift equations, we then can see the basis for identifying a, calculated as in the first of Eqs. (5.103) with the expression in Eq. (5.85).

The lift and pitching moment then are used to form the generalized forces from Eqs. (5.24) and, in turn, are used in the structural equations in Eqs. (5.26). Even so, these two equations are incomplete, having more than two unknowns. The induced – flow velocity k0 must be expressed in terms of the airfoil motion. The induced-flow theory of Peters et al. does that, representing the average induced-flow velocity k0 in terms of N induced-flow states k1, k2,…,kN as

1 N

k0 « 2E bnkn (5.105)

n=1

where the bn are found by the least-squares method. The induced-flow dynamics then are derived from the assumption that the shed vortices stay in the plane of the airfoil and travel downstream with the same velocity as the flow. Introducing a

Подпись: [A] {X} + b {X} = {c} Подпись: h + UQ + b ( 2 - a I*5 Подпись: (5.106)

column matrix {X} containing the values of Xn, we can write the set of N first-order ordinary differential equations governing {X} as

where the matrices [ A] and {c} can be derived for a user-defined number of induced – flow states. The expressions of the matrices used here are given for N finite states as

1

[ A] = [ D] + {d}{b}T + {c}{d}T + 2 {c}{b}T (5.107)

where

Dnm = 1 n = m + 1

= – n = m – 1 (5.108)

Подпись: bn Finite-State Unsteady Thin-Airfoil Theory of Peters et al Подпись: n = N n = N Подпись: (5.109)

= 0 n = m ± 1

Подпись: (5.110)dn = 2 n = 1 = 0 n = 1

Finite-State Unsteady Thin-Airfoil Theory of Peters et al Подпись: (5.111)

and

The resulting aeroelastic model is in the time domain, in contrast to classical flutter analysis, which is in the frequency domain (see Section 5.3). Thus, it can be used for flutter analysis by the p method, as well as in the design of control systems to alleviate flutter.

Results using the finite-state, induced-flow model (i. e., Eqs. 5.106 and 5.26 with generalized forces given by Eqs. 5.24 with lift and pitching moment given by Eqs. 5.104) for the problem analyzed previously in Section 5.2 (recall that a = -1/5, e = -1/10, /л = 20, r2 = 6/25, and a = 2/5) are given here. These results are based on use of N = 6 induced-flow states.2 The frequency and damping results are shown in Figs. 5.12 and 5.13, respectively. As before, a frequency coalescence is observed near the instability, but the flutter condition is marked by the crossing of the real part of one of the roots into positive territory. The flutter speed obtained is VF = UF/(bme) = 2.165, and the flutter frequency is &F/шв = 0.6545. Although this value of the flutter speed is close to that observed previously using the simpler theory, the unsteady-aerodynamics theory produces complex roots for all V = 0 so that there is modal damping in all of the modes below the flutter speed. The equations contain damping terms proportional to the velocity that account for the initial increase in

Подпись: 2It should be noted that a larger number of induced-flow states is not necessary. The use of too many may degrade the accuracy of the model because of ill-conditioning.

damping. At higher velocities, however, the destabilizing circulatory term (i. e., the nonsymmetric term in the stiffness matrix that also is present in the steady-flow theory) overcomes the damping caused by the unsteady terms, resulting in flutter.

It is left to readers as an exercise to show the equivalence of the theories of Peters et al. and Theodorsen (see Problem 16).

5.5 Flutter Prediction via Assumed Modes

As previously noted, in industry it is now typical to use the finite element method as a means to realistically represent aircraft structural dynamics. Although it is certainly

possible to conduct full finite-element flutter analyses, flutter analysis based on a truncated set of the modes of the stucture is still helpful and relatively simple; for those reasons alone, it often is done. In this section, we show how such an analysis can be performed within the framework of the Ritz method, an explanation of which is in Section 3.5.

Consider an unswept wing mounted to a wind-tunnel wall that is modeled as a uniform cantilevered beam of length l. For the structural model, we adopt the same notation used in Chapter 4. Thus, for a beam with bending rigidity EI and torsional rigidity GJ, the strain energy becomes

Подпись: 1Подпись: 2Finite-State Unsteady Thin-Airfoil Theory of Peters et al(5.112)

Подпись: (5.113) Подпись: v = Подпись: дв. z Tt1 +
Подпись: д w дв'.,. x— It д t dt

To obtain the kinetic energy, we first consider the airfoil section shown in Fig. 4.12. Denoting the mass per unit volume of the material by p and noting that the velocity of a typical point within the cross-sectional plane is

Подпись: дв2. 2( дв2'
Finite-State Unsteady Thin-Airfoil Theory of Peters et al Подпись: dx dz dy Подпись: (5.114)

where і and k are unit vectors in the x and z directions, respectively, we can write the kinetic energy as

Подпись: 1 Гl - = її Подпись: . дW2 „ дW дв l2 2 /дв2’ m  — + 2md + mb r — 1 дt ) дt дt дt J Подпись: dy Подпись: (5.115)

Straightforward evaluation of the cross-sectional integrals yields

where m is the mass per unit length, d is the offset of the mass centroid from the elastic axis (i. e., positive when the mass centroid is toward the leading edge), b is the semi-chord, and br is the cross-sectional mass radius of gyration about the elastic axis.

Finally, we need the virtual work of the aerodynamic forces, which can be written as

SW = [ [L&w + (Mac + eL) 8в] dy (5.116)

Jo

where, as before, L and M^c are the distributed lift and pitching moment per unit length of the wing.

Due to long-standing conventions in the literature of unsteady aerodynamics, this notation is not compatible with what has been used so far in this chapter. Thus, we rewrite these three expressions (i. e., strain energy, kinetic energy, and virtual work) in terms of the notation of this chapter. In particular, we can show that the

following replacements can be made for the notation used in Fig. 4.12:

d ^ – bxe

e -(2+^b

L ^ L Mac ^

4

Подпись: -=21' Подпись: /dw2 „ , dw дв l2 2 /дв2’ m — - 2mbxe + mb2r — V дt) дt дt д t ) Подпись: dy Подпись: (5.117)

Thus, the strain energy is unchanged from before. The kinetic energy becomes

Подпись: SW = j I LSw + Подпись: Mi + 1 2 + a ) bL Подпись: 5в J dy Подпись: (5.118)

and the virtual work becomes

A reasonable choice for the assumed modes is the set of uncoupled cantilevered – beam, free-vibration modes for bending and torsion, such that

Nw

Подпись: w(y>t) = J2 ni(t )ф* (y)

Подпись:i=1

Ne

в (yt) = J2 фі(t )&i(y)
i=1

Подпись: where Finite-State Unsteady Thin-Airfoil Theory of Peters et al Finite-State Unsteady Thin-Airfoil Theory of Peters et al

where Nw and Ne are the numbers of modes used to represent bending and torsion, respectively; ni and фі are the generalized coordinates associated with bending and torsion, respectively; and ^ and &i are the bending and torsion mode shapes, respectively. Here, &i is given by

and, according to Eq. (3.258), is given as

Подпись:Фi = cosh(a*y) – cos(aiy) – в [sinh(aiy) – sin(aiy)]

with ai and в as given in Table 3.1.

Finite-State Unsteady Thin-Airfoil Theory of Peters et al Finite-State Unsteady Thin-Airfoil Theory of Peters et al Подпись: (5.123)

The next step in the application of the Ritz method is to discretize spatially the expressions for strain energy, kinetic energy, and virtual work. Because of the ortho­gonality of both the bending and torsion modes, the strain energy simplifies to

Finite-State Unsteady Thin-Airfoil Theory of Peters et al Подпись: (5.124)

Similarly, the kinetic energy is simplified considerably because of the ortho­gonality of both the bending and torsion modes and can be written as

Finite-State Unsteady Thin-Airfoil Theory of Peters et al Finite-State Unsteady Thin-Airfoil Theory of Peters et al Подпись: (5.125)

where

Inertial coupling between bending and torsion motion is reflected by the term in­volving Aj, which is a fully populated matrix because the bending and torsion modes are not orthogonal to one another.

The virtual-work expression

Подпись: NwN

Finite-State Unsteady Thin-Airfoil Theory of Peters et al Подпись: dy Подпись: (5.127)

(5.126)

where expressions for L and M) can be found by taking expressions for L and M

4 4

Finite-State Unsteady Thin-Airfoil Theory of Peters et al

in Eqs. (5.82) or (5.104) and replacing h with – w and dots with partial derivatives with respect to time. This we carry out for illustrative purposes using Theodorsen’s theory, for which

Finite-State Unsteady Thin-Airfoil Theory of Peters et al Finite-State Unsteady Thin-Airfoil Theory of Peters et al

Substituting Eqs. (5.119) into Eqs. (5.128), we obtain expressions for the generalized forces that can be put easily into matrix form:

where [A] denotes an identity matrix and [0] denotes a matrix of zeros. Because of limitations inherent in the derivation of Theodorsen’s theory, this expression for the generalized forces is valid only for simple harmonic motion. Note that the rect­angular submatrices in this equation are also referred to as aerodynamic-influence coefficients (AlCs).

Подпись: [A] -bx9 [ A]T I;I+ ' E ['B'] [0] " -bx9 [ A] b2r 2[A] [0] G ['T']_ Подпись: Ф Finite-State Unsteady Thin-Airfoil Theory of Peters et al Подпись: (5.130)

All that now remains in the application of the Ritz method is to invoke La­grange’s equations to obtain the generalized equations of motion, which can be written in matrix form as

where elements of the diagonal matrices [‘ B’] and [‘T’] are given by

Подпись:Bit = (a l)4 Tu = (Yt l)2

The appearance of diagonal matrices [‘ B-] and [‘T’] in the stiffness matrix and the appearances of A in the mass matrix and generalized forces are caused by the orthogonality of the chosen basis functions &t and tyt. Such a choice is not necessary but it simplifies the discretized equations.

Following the methodology of classical flutter analysis in Section 5.3, we set

Подпись:n(t) = n exp(iat) ф(ї) = ф exp(iat)

where a is the frequency of the simple harmonic motion. This leads to a flutter determinant that can be solved by following steps similar to those outlined in Sec­tion 5.3, the only difference being that there are now more degrees of freedom if either Nw or N9 exceeds unity.

Finite-State Unsteady Thin-Airfoil Theory of Peters et al Подпись: (5.133)

Let us consider the case in which Nw = N9 = 1. If we introduce dimensionless constants similar to those in Section 5.3, the equations of motion can be put in the form of Eqs. (5.62); that is

Here, lw, le, mw, and me are defined in a manner similar to the quantities on the right-hand side of Eqs. (5.39) with the loads from Theodorsen’s theory

Подпись: lw = 1-2iC(k)

Finite-State Unsteady Thin-Airfoil Theory of Peters et al Finite-State Unsteady Thin-Airfoil Theory of Peters et al Подпись: (5.134)

k

m a2.i a -9 [1 -2<i+-aw] 1. 2 a+-aw

me =a + 8 k + k2

Подпись: rnw Подпись: (ail)2 Подпись: El ml4 Подпись: (5.135)

and the fundamental bending and torsion frequencies are

ж GJ

2 V mb2r2l2

Finally, the constant A11 = 0.958641. It is clear that these equations are in the same form as those solved previously for the typical section and that the influence of wing flexibility for this simplest two-mode case enters only in a minor way—namely, to adjust the coupling terms by a factor of less than 5%.

The main purpose of this example is to demonstrate how the tools already presented can be used to conduct a flutter analysis of a flexible wing. Addition of higher modes certainly can affect the results, as can such things as spanwise variations in the mass and stiffness properties and concentrated masses and inertias along the wing. Incorporation of these additional features into the analysis would make the analysis more suitable for realistic flutter calculations.

However, to fully capture the realism afforded by these and other important considerations—such as aircraft with delta-wing configurations or very-low-aspect – ratio-wings—a full finite-element analysis is necessary. Even in such cases, it is typical that flutter analyses based on assumed modes give analysts a reasonably good idea of the mechanisms of instability. Moreover, the full finite element method can be used to obtain a realistic set of modes that, in turn, could be used in a Ritz-method analysis instead of those used herein. This way, considerable realism can be incorporated into the model without necessitating the model to be of large order. Present-day industry practice uses both full finite-element models as well as assumed modes derived from a full finite-element model.

As for the unsteady aerodynamics, in industry, the AIC matrices usually are com­puted using panel codes based on unsteady potential flow, such as the doublet-lattice method. The geometry of the panels, in general, is quite different from that of the structural-finite elements. This gives rise to the need for transferring both motion and loads between these two models. One approach for transferal uses a spline matrix that

Uf
Finite-State Unsteady Thin-Airfoil Theory of Peters et albWg 7

6

5

4

3

2

1

Подпись: И20 40 60 80 100

Figure 5.14. Plot of dimensionless flutter speed versus mass ratio for the case a = 1Д/Ї0, r = 1/2, xe = 0, and a = -3/10 interpolates the displacements at structural-finite-element grid points to those at the panels of the aerodynamics code and transfers loads on the panels to the nodes of the finite elements. Methodology has been developed that fosters straightforward cou­pling of structural and aerodynamic codes despite disparities in their meshes (Smith, Cesnik, and Hodges, 1995). Similar procedures also can be used to couple finite – element codes with more sophisticated computational fluid dynamics (CFD) codes.
Theodorsen’s Unsteady Thin-Airfoil Theory

Theodorsen’s Unsteady Thin-Airfoil Theory Подпись: (5.82)

Theodorsen (1934) derived a theory of unsteady aerodynamics for a thin (meaning a flat-plate) airfoil undergoing small, simple harmonic oscillations in incompressible flow. The derivation is based on linear potential-flow theory and is presented in detail along with mathematical subtleties in the textbook by Bisplinghoff, Ashley, and Halfman (1955). The lift contains both circulatory and noncirculatory terms, whereas the pitching moment about the quarter-chord is entirely noncirculatory. According to Theodorsen’s theory, the lift and pitching moment are given by

Theodorsen’s Unsteady Thin-Airfoil Theory Подпись: (5.83)

where the generalized forces are given in Eqs. (5.24). The function C(k) is a complex­valued function of the reduced frequency k, given by

where H, P(k) are Hankel functions of the second kind, which can be expressed in terms of Bessel functions of the first and second kind, respectively, as

Подпись: (5.84)tff>(k) = Jn(k) – iYn(k)

Theodorsen’s Unsteady Thin-Airfoil Theory Подпись: 1/k

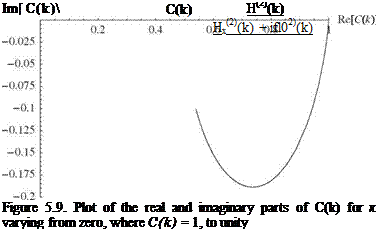
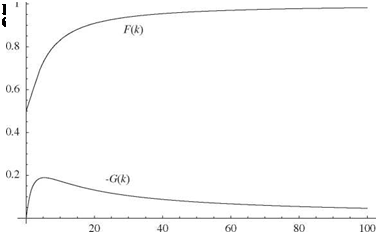
The function C(k) = F(k) + iG(k) is called Theodorsen’s function and is plotted in Figs. 5.9 and 5.10. Note that C(k) is real and equal to unity for the steady case

(i. e., к = 0). As к increases, we find that the imaginary part increases in magnitude whereas the real part decreases. As к tends to infinity, C(k) approaches 1/2. However, for practical situations, к rarely exceeds unity. Hence, the plot in Fig. 5.9 only extends to к = 1. The large к behavior is shown in Fig. 5.10. When any harmonic function is multiplied by С(к), its magnitude is reduced and a phase lag is introduced. An example of this phenomenon is given herein.

A few things are noteworthy concerning Eqs. (5.82). First, in Theodorsen’s theory, the lift-curve slope is equal to 2n. Thus, the first of the two terms in the lift is the circulatory lift without the effect of shed vortices multiplied by С(к). The multiplication by С(к) is a consequence of the theory having considered the effect of shed vorticity. The noncirculatory terms (i. e., the second term in the lift as well as the entire pitching-moment expression) depend on the acceleration and angular acceleration of the airfoil and are mostly apparent-mass/apparent-inertia terms. The circulatory lift is the more significant of the two terms in the lift. Note that the coefficient of h in the lift is the mass per unit length of the air contained in an infinitely long circular cylinder of radius b. This quantity reflects how much air is imparted an acceleration by motion of the airfoil.

Подпись: a = С(к) Подпись: ' h b (1 +U+U2-й Подпись: (5.85)

For steady flow, the circulatory lift is linear in the angle of attack; however, for unsteady flow, there is no single angle of attack because the flow direction varies along the chordline as the result of the induced flow varying along the chord. However, just so we can discuss the concept for unsteady flow, it is helpful to introduce an effective angle of attack. For simple harmonic motion, it can be inferred from Theodorsen’s theory that an effective angle of attack is

As shown in Section 5.5.2 by comparison with the finite-state aerodynamic model introduced therein, a is the angle of attack measured at the three-quarter chord based on an averaged value of the induced flow over the chord. Recall that in the case of steady-flow aerodynamics of two-dimensional wings, the angle of attack is the pitch angle в. Here, however, a depends on в as well as on h, в, and к. Because of these additional terms and because of the behavior of С(к), we expect changes in magnitude and phase between в and a. These carry over into changes in the magnitude and phase of the lift relative to that of в. Indeed, the function С(к) is sometimes called the lift-deficiency function because it reduces the magnitude of the unsteady lift relative to the steady lift. It also introduces an important phase shift between the peak values of pitching oscillations and corresponding oscillations in lift.

When we see the dots over h and в in the lift and pitching-moment expressions, it is tempting to think of them as time-domain equations. However, the presence of С(к) is nonsensical in a time-domain equation. Therefore, Theodorsen’s theory with the С(к) present must be recognized as valid only for simple harmonic motion.

Note that an approximation of Theodorsen’s theory in which С(к) is set equal to unity is called a “quasi-steady” thin-airfoil theory. Such an approximation has value only for cases in which к is restricted to be very small. For slow harmonic oscillations
or slowly varying motion that is not harmonic, the quasi-steady theory may be used in the time domain.

As an example to show the decrease in magnitude and change of phase, consider that the dominant term in the lift is proportional to a. In the time domain, lift is real and so are a and в. However, when we regard в as harmonic; viz.

в = в exp(iot) (5.86)

then we must realize that to recover the time-domain behavior, we need

в = Щв exp(irnt)] (5.87)

Similarly, we must recover the time-domain behavior of a using the relationship

a = Щ[Є(к)в exp(irnt)] (5.88)

Now, assuming в = 1 so that in the time domain в = cos(ot), we find that
a =Щ[С(к)в exp(iot)]

= Щ[С(к) exp(i ot)]

= F(к) cos(ot) – G(k) sin(ot) (5.89)

= [F2(k) + G2(k)]2 cos(ot – ф)

= |C(k)| cos(ot – ф)

where

tan(<^ = – Gk (5.90)

Because |C(k)| < 1 and ф(к) > 0, having the amplitude of в equal to unity implies that a has an amplitude less than unity; having the peak of в at t = 0 implies a has its peak shifted to t = ф/o. For example, when k = 1/3, C(k) = 0.649739 – 0.174712 i so that |C(k)| = 0.672819, implying a magnitude reduction of nearly 33%, and ф = 15.0506 degrees.

Theodorsen’s theory may be used in classical flutter analysis. There, the reduced frequency of flutter is not known a priori. We can find k at the flutter condition using the method described in Section 5.3. Theodorsen’s theory also may be used in the k and p-k methods, as described in Sections 5.4.1 and 5.4.2, respectively.

Unsteady Aerodynamics

In Section 5.2, flutter analysis was conducted using an aerodynamic theory for steady flow. The lift and pitching moment used were functions only of the instantaneous
pitch angle, в. On deeper investigation, however, it is easy to see that the angle of attack is not simply equal to в. For example, recalling that the airfoil reference point is plunging with velocity h, at least for small angles, we can justify modifying the angle of attack to include the effect of plunge; viz.

a = в + U (5.81)

where this follows from an argument similar to the one used in Section 4.2.5 regarding the influence of aircraft roll on the wing’s angle of attack. However, we must be cautious about such ad hoc reasoning because there may be other effects of the same order that we are overlooking.

Indeed, there are other effects of equal importance that must be included. Fung (1955) suggested an easy experiment to demonstrate that things are not so simple as indicated by Eq. (5.81): Attempt to rapidly move a stick in a straight line through water and notice the results. In the wake of the stick, there is a vortex pattern, with vortices being shed alternately from each side of the stick. This shedding of vortices induces a periodic force perpendicular to the stick’s line of motion, causing the stick to tend to wobble back and forth in your hand. A similar phenomenon happens with the motion of a lifting surface through a fluid and must be accounted for in unsteady-aerodynamic theories.

We can observe that lift and pitching moment consist of two parts from two physically different phenomena: noncirculatory and circulatory effects. Circulatory effects are generally more important for aircraft wings. Indeed, in steady flight, it is the circulatory lift that keeps the aircraft aloft. Vortices are an integral part of the process of generation of circulatory lift. Basically, there is a difference in the velocities on the upper and lower surfaces of an airfoil. Such a velocity profile can be represented as a constant velocity flow plus a vortex. In a dynamic situation, the strength of the vortex (i. e., the circulation) is changing with time, as are both the magnitude and direction of the relative wind vector because of airfoil motion. However, the circulatory forces of steady-flow theories do not include the effects of the vortices shed into the wake. Restricting our discussion to two dimensions and potential flow, we recall an implication of the Helmholtz theorem: The total vorticity will always vanish within any closed curve surrounding a particular set of fluid particles. Thus, if a clockwise vorticity develops about the airfoil, a counterclockwise vortex of the same strength must be shed into the flow. As it moves along, this shed vortex changes the flow field by inducing an unsteady flow back onto the airfoil. This behavior is a function of the strength of the shed vortex and its distance away from the airfoil. Thus, accounting for the effect of shed vorticity is, in general, a complex undertaking and would necessitate knowledge of each vortex shed in the flow. However, if we assume that the vortices shed in the flow move with the flow, then we can estimate the effect of these vortices.

Noncirculatory effects, also called apparent mass and inertia effects, are sec­ondary in importance. They are generated when the wing has nonzero acceleration
so that it must carry with it some of the surrounding air. That air has finite mass, which leads to inertial forces opposing its acceleration.

In summary, then, unsteady-aerodynamic theories need to account for at least three separate physical phenomena, as follows:

1. Because of the airfoil’s unsteady motion relative to the air, the relative wind vector is not fixed in space. This is only partly addressed by corrections such as in Eq. (5.81). The changing direction of the relative wind changes the effective angle of attack and thus changes the lift.

2. As Fung’s experiment shows, the airfoil motion disturbs the flow and causes a vortex to be shed at the trailing edge. The downwash from this vortex, in turn, changes the flow that impinges on the airfoil. This unsteady downwash changes the effective angle of attack and thus changes the lift.

3. The motion of the airfoil accelerates air particles near the airfoil surface, thus creating the need to account for the resulting inertial forces (although this “apparent-inertia” effect is less significant than that of the shed vorticity). The apparent-inertia effect does not change the angle of attack but it does, in general, affect both lift and pitching moment.

Additional phenomena that may affect flutter but which are beyond the scope of this text include three-dimensional effects, compressibility, airfoil thickness, flow separation, and stall.

In this section, we present two types of unsteady-aerodynamic theories, both of which are based on potential-flow theory and take into account the effects of shed vorticity, the motion of the airfoil relative to the air, and the apparent-mass effects. The simpler theory is appropriate for classical flutter analysis as well as for the к and p-к methods. The other is a finite-state theory cast in the time domain, appropriate for the eigenvalue analysis involved in the p method as well as for the time-domain analysis required in control design.