Our heavyweight helicopter equal in the world does not have
In Rostov started production of the most load-lifting rotary-wing car The Russian holding «Helicopt[...]

Everything about aircrafts and helicopters. News and events in aviation worldwide. Civil, transportation, military helicopters and airplanes.

Everything about aircrafts and helicopters. News and events in aviation worldwide. Civil, transportation, military helicopters and airplanes.

Everything about aircrafts and helicopters. News and events in aviation worldwide. Civil, transportation, military helicopters and airplanes.

Everything about aircrafts and helicopters. News and events in aviation worldwide. Civil, transportation, military helicopters and airplanes.


The flight dynamics models are an important part of a flight simulator and ultimately define the fidelity level of the simulation. Of equal importance is the environment into which a pilot is immersed. HELIFLIGHT uses six-axis motion cueing together with
![]()
 |
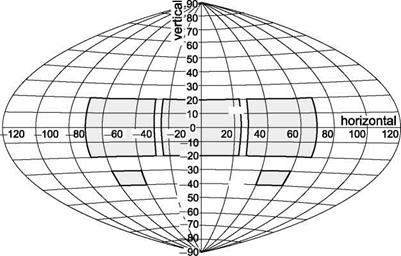
Horizontal field of view 48° maximum Vertical field of view 36° maximum
Three collimated displays giving 135°
field of view (approximately)
collimated displays and pilot control loaders to create a virtual flying experience. A pilot will derive information about the vehicle behaviour from a number of sources. The basic mechanisms are visual perception, perception through the vestibular system of the inner ears and perception through the proprioceptors distributed throughout the body. Each of these mechanisms provides important information or ‘cues’ to the pilot.
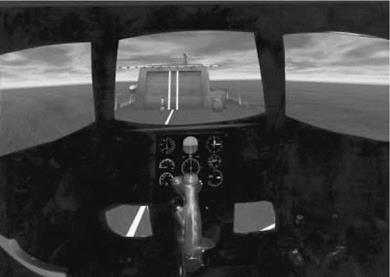
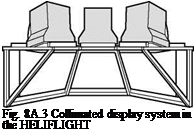
Three collimated visual displays (Fig. 8A.3) are used to provide infinity optics for enhanced depth perception, which is particularly important for hovering and low – speed flying tasks. The displays provide 135° horizontal by 40° vertical field of view, extended to 60° vertical field of view using two flat-screen displays in the foot-well chin windows (Fig. 8A.4). The displays have a 1024 x 768 pixel resolution, refreshing at 60 Hz giving good visual cues when displaying a texture-rich visual database (Fig. 8A.5).
The capsule has a main instrument panel that can be reconfigured to represent displays from different aircraft presented on a flat screen monitor. The ‘standard’ HUD is displayed in OTW centre and contains an attitude indicator, vertical speed indicator, airspeed and altitude indicator and has a ‘hover box’ to aid helicopter control at low speed.
The sensation of motion is generated using the six-axis motion platform, with movement envelope as given in Table 8A.1.
The electrically actuated motion platform has a position resolution of 0.6 дш. The human visual system is relatively slow to detect changes in speed, compared with the vestibular system, which is much quicker to react to accelerations. As a result, certain tasks may be difficult to perform without motion cues, in particular helicopter hovering. To ensure that the pilot does not receive ‘false’ cues, the motion cueing algorithms can be tuned to correspond with the desired vehicle performance and MTE requirements. The parameters are accessible in a configuration file, which can be made aircraft specific. A major limitation with motion platforms is the stroke available.
|
|
Fig. 8A.4 Outside world field of view in HELIFLIGHT simulator
|
Fig. 8A.5 Typical pilot’s eye view in HELIFLIGHT capsule |
To maximize the usable motion envelope, the drive algorithms features conventional washout filters that return the simulator to its neutral position after a period of simulator motion at low enough acceleration rates to minimize false cues.
Pilots can gain information about the behaviour of the aircraft by the feel and position of the controls. HELIFLIGHT uses electric control loaders for the three primary pilot inceptors: cyclic, collective and pedals. The collective lever and cyclic stick host several switches for various functions that can be reprogrammed or are directly
|
Table 8A.1 HELIFLIGHT motion envelope
a All motions are stated from mid heave with all other axes neutral. By coupling one or more motions, a larger range may be obtained. ^Measured over whole motion envelope. Heave accelerations of +1 g, —2 g may be produced near the centre of the motion envelope. |
associated with PilotStation (e. g., run/pause, trim release). The HELIFLIGHT capsule also contains two secondary controls – a joystick and a throttle lever. All the controls, buttons and switches are configurable, e. g., the hat button on the cyclic controls nacelle tilt in the FLIGHTLABXV-15 and the collective button configured as a brake for the undercarriage wheels on fixed-wing aircraft models. Digital control of the stick gradient and control position is carried out with a resolution of 2.5 дш. Such accuracy allows a pilot to utilize the force trim release feature to zero the control forces at the trim position. The force feel characteristics are also reconfigurable through software to represent an aircraft-specific control system.
Vibration and audio cues contribute to the realism of the simulation. Aircraft – specific noise is played through two loudspeakers in the HELIFLIGHT cockpit to provide audio cues to the pilot. Vibration can be detected directly through the motion platform driven by variables in the model. A ‘low’ frequency audio actuator is mounted under the floor of the capsule, directly beneath the pilot. This can transmit sounds of frequency 20-100 Hz into the floor of the capsule to provide vibration or impact cues.
An important aspect of the overall fidelity of the system is the amount of latency present. The latency is produced by the transport delays in the transfer of information between the various components of the simulator, from the control inputs to the flight model outputs through the motion base and the visual system to the pilot and back through to the flight model via the pilot’s controls. If the degree of latency is high, the pilot is likely to notice a lag between an input control command and perceived response of the system. This can seriously affect handling, particularly for precisiontracking tasks. In HELIFLIGHT, the flight dynamics model, running typically at 200 Hz, produces a 5-ms delay. A delay of less than 16 ms occurs as the output from the flight model is converted to produce a corresponding change in the simulator motion system. The graphics cards receive a signal broadcast across the HELIFLIGHT network near the start of each time frame. However, variable latency in the visuals occurs due to the terrain texture density being displayed, which also varies with the specification of the graphics card. Currently, this causes delays of between 16 and 30 ms in the redrawing of the terrain. In addition to this, the monitors are refreshing at 60 Hz. Finally, the Loadcue feel system introduces a potential 5-ms delay into the system. With all these contributions, the overall transport delay between pilot stick and motion base and visual response is estimated to be below 50 ms.
The scope of activity undertaken on HELIFLIGHT over the first 5 years of operation is documented in the wide range of journal and conference papers (Refs 8A.1- 8A.28). These publications give something of the flavour of what can be achieved with a research quality flight simulator in the continuing development of flight handling qualities.
[1] The blade flap response is dominated by the centrifugal stiffness, so that the natural frequency is always close to one-per-rev; even on hingeless rotors like the Lynx and Bo105, the flap frequency ratio, Xp, is only about 10% higher than for a teetering rotor.
[2] The flap response to cyclic pitch is close to phase resonance, and hence is about 90°
out of phase with the pitch control input; the stiffer the rotor, the smaller the phase
[4] First, we address the primary objective of the trial – to establish the Level 1/2
boundary for rate response types on the AFS. The result depends on which level of aggression is taken, and we will return to this particular issue later. On the basis that pilots can be expected to fly with moderate levels of aggression on a regular basis to accomplish tasks with some urgency, we would argue that Level 1 qualities are achievable with configuration T306 (^2.5 rad/s) and higher bandwidths. This is a little higher than the ADS-33 value at 2 rad/s but actually agrees with the NRC mean
The software at the centre of operation of the facility is FLIGHTLAB, a multi-body modelling environment, providing a modular approach to the creation of flight dynamics models, including enabling the user to produce a complete vehicle system from a library of pre-defined components. In particular, FLIGHTLAB provides a range of tools to assist in the rapid generation of nonlinear, multi-body models, significantly reducing the effort required for computer coding. Although FLIGHTLAB was originally developed for rotorcraft using blade element models, it can readily be used as a simulation tool for fixed-wing aircraft. For example, within the FLIGHTLAB library at Liverpool are models of the Wright Flyers, Grob 115, X-29, Boeing 707/747, Jetstream and Space Shuttle Orbiter.
To aid the generation and analysis of flight models, three graphical user interfaces (GUIs) are available: GSCOPE, FLIGHTLAB Model Editor (FLME) and Xanalysis. A schematic representation of the desired model can be generated using a component – level editor called GSCOPE. Components are selected from a menu of icons, which are then interconnected to produce the desired architecture and data are assigned to the component fields. When the representation is complete, the user selects the script generation option and a simulation script in FLIGHTLAB’s Scope language is automatically generated from the schematic. Scope is an interpretive language that uses MATLAB syntax, together with new language constructs, for building and solving nonlinear dynamic models.
FLME is a subsystem model editor allowing a user to create models from higher level primitives such as rotors and airframes. Typically, a user will select and configure the subsystem of interest by inputting data values and selecting options that determine the required level of sophistication. This approach provides a selective-fidelity modelling capability while maximizing computational efficiency. Models are created hierarchically, with a complete vehicle model consisting of lower level subsystem models, which in turn are collections of primitive components. This is the Model Editor Tree, which puts all the pre-defined aircraft subsystems into a logical ‘tree’ structure. This tool facilitates configuration management by keeping all models in a pre-defined structure, while at the same time allowing the user flexibility in defining the individual aircraft structure and subsystems.
Prior to running a real-time simulation, the model generated using the above tools can be analysed using Xanalysis. This GUI has a number of tools allowing a user to change model parameters and examine the dynamic response, static stability, performance and handling qualities of design alternatives. Additional tools are available to generate linear models with prescribed perturbation sizes, perform eigen-analyses, time and frequency response analyses and control system design. The nonlinear model may also be directly evaluated through utilities that support trim and time and frequency response.
The real-time simulation is coordinated using PilotStation, which controls and interfaces image generation for the OTW displays, instruments and the HUD with the control loaders, motion base and flight dynamics models generated using FLIGHT – LAB, in real time. Typically, a helicopter simulation, with a four-bladed rotor and five elements per blade, runs at 200 Hz. The frame time can be increased or decreased to ensure optimized performance, taking account of model complexity (number of operations per second) and the highest frequency modes (numerical stability). During a simulation, a circular buffer is continuously updated containing pre-defined output variables. Selecting the History option makes the buffer accessible to the operator, which can be plotted or saved for off-line analysis. The operator console can be used to modify the vehicle configuration and flight condition and initiate faults or inputs on-line, e. g., SCAS on/off, tail rotor failure, gusts.
In the production of this second edition, research results derived from the University of Liverpool’s motion simulator, HELIFLIGHT, and its simulation environment, FLIGHTLAB, have been used extensively. This appendix provides an overview of the facility; the material is derived largely from Ref. 8A.1.
The HELIFLIGHT facility can be described as a reconfigurable flight simulator, with six key components that are combined to produce a relatively high-fidelity system, including
(a) interchangeable flight dynamics modelling software (FLIGHTLAB), featuring ‘selective fidelity’, e. g., different types of rotor wake model, with a real-time interface, PilotStation;
(b) 6-DoF motion platform;
(c) four-axis dynamic control loading;
(d) three-channel collimated visual display system (135 x 40°) plus two flat panel chin windows (60°), each channel running its own visual database;
(e) reconfigurable, computer-generated instrument display panel and heads-up-display (HUD)
(f) data record and time history capture facility.
A schematic of the HELIFLIGHT configuration is shown in Fig. 8A.1.
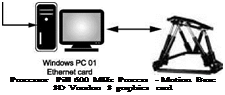
The main host computer is a dual processor PC running Linux. One processor runs FLIGHTLAB and PilotStation, whilst the second processor drives the control loaders. In addition, this machine acts as both a file server and a server for other hosts. The use of two Ethernet cards (one to access the Internet and the other to access the HELIFLIGHT network via a hub) enables isolation of the local area network from the
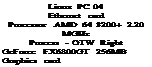
Linux PC 05 Ethernet card
 |
 |
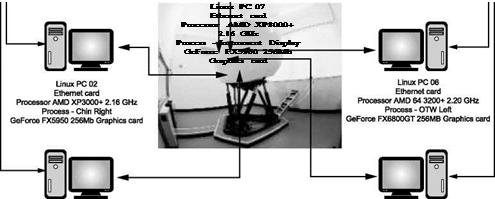 |
Processor AMD 64 3200+ 2.20 GHz Process – OTW Centre GeForce FX6800GT 256MB Graphics card
Fig. 8A.1 Schematic of the HELIFLIGHT configuration
Internet, maximizing throughput and security. There are seven other Windows-based host computers running the motion base, the two chin windows, the three forward Out the Window (OTW) displays and the instrument display. The HUD on the OTW centre can be toggled on/off. All the Windows computers are equipped with graphics cards that send signals to the cockpit displays, asynchronously. The keyboard and mouse of each computer are also multiplexed, allowing each Windows computer to be controlled from a single station.
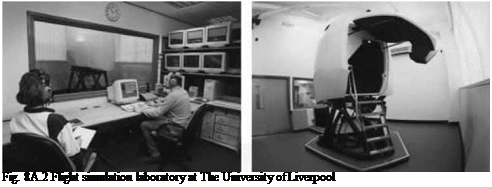
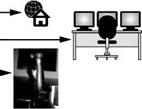
The simulation laboratory has two main areas: the simulator control room and the cockpit pod room. An authorized simulator operator controls the real-time operation of the simulator from the main host running PilotStation in the control room and interacts with the pilot in the cockpit room using a two-way communication system. From this viewpoint, the operator can observe both the motion of the cockpit and also the displays which are replicas of those present in the cockpit pod (Fig. 8A.2).
During a real-time session or ‘sortie’, the operator is responsible for ensuring the safe operation of the motion base and can override a pilot’s inputs in the event of loss of pilot control. A lap belt is worn by the pilot during a sortie and is part of the safety interlock system that incorporates electromagnetic door releases on the gull wing capsule door and a cockpit room door interlock. Emergency stop buttons are available to both the pilot and the operator. In the case of an emergency or power failure, the simulator parks, returning the capsule safely to its down position and the cockpit pod door opens.
Throughout a sortie, a video/DVD record is taken of OTW centre, generating both a visual and audio log of the mission for use in post-trial analysis. PilotStation also has a data-logging function, allowing a range of aircraft performance parameters, flight model outputs and pilot control inputs to be captured for subsequent processing. Using a computer image of the aircraft being flown, flights can later be reconstructed from any viewing point.
In this chapter some of the ways in which handling qualities can degrade have been discussed, and methodologies for taking them into account are outlined. What should be clear to the reader from the ideas and results presented is that the pilot’s task can become very difficult if the visual cues degrade, if flight systems fail or when strong atmospheric disturbances are encountered; the risk to safety and the likelihood of an accident increase in such situations. If such degradations happen quickly and are unforeseen, taking the pilot by surprise, then the risk further increases. With a good understanding of the degrading mechanisms, appropriate design criteria, more stringent operational procedures and the availability of safety-related technologies, for both new and old aircraft, there seems to be no good reason, apart from cost, why all existing and new helicopters cannot be made more ‘accident proof’. At the time of writing, this goal is being pursued in an international initiative, stimulated partly by the revelations of a comprehensive analysis of US civil helicopter accidents over a 40-year period by Harris et al. (Ref. 8.65), summarized in the 2006 AHS Nikolsky Lecture (Ref. 8.66) – No Accidents – That’s the Objective. In the 40-year period from 1964, the US civil helicopter accident rate per 100 000 flying hours decreased from 65 in 1966 to 11 in 2004; these data relate to a total number of accidents i. e., 10 410 in the period, where nearly 2700 people lost their lives. The accident rate per 1000 aircraft has also decreased substantially over this period – 120 in 1964 to 12 in 2005. However, the helicopter accident rate is still about an order of magnitude greater than the fixed – wing aircraft accident rate. Challenging the oft-made point that safety improvements are uneconomical, Harris presents data showing that the cost of one accident is about 1 million US dollars, so that the total cost to the Industry over the 40-year period has been about 11 billion US dollars. More than three quarters of this relates to insurance claims.
Figure 8.63 summarizes the distribution of US civil rotorcraft accidents presented by Harris (Ref. 8.66). The data show that loss of control is a growing problem; with 1114 in total, less than 10% were in this category in 1964 but greater than 20% in 2005,
End of year
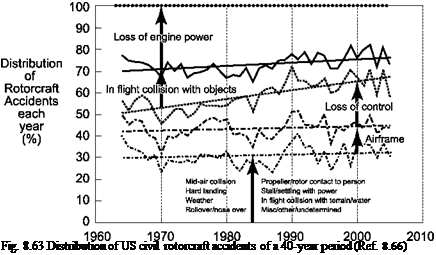 |
making loss of control equal the number one contributor to accidents, alongside loss of engine power. In-flight collision with objects (including wires, poles, trees, but not the surface) has reduced as a cause, but a total of 1322 accidents in this category over the period highlights the problem that pilots too often bump into things and the helicopter is very unforgiving to such. The surface collision accidents are contained in the lower 30% ‘mixed-bag’ in Fig. 8.63, so details are unclear, but it is likely, based on more dedicated studies (e. g., Ref. 8.4, 8.67), that the proportion in this category, where loss of visual cues is a major factor, will be significant.
The safety initiative referred to above, led by the International Helicopter Safety Team (IHST), was launched at the AHS Safety Symposium in Montreal in September 2005 (Ref. 8.68), where a commitment was made to reduce the helicopter accident rate by 80%, from 8.09 to 1.62 per 100 000 flying hours, within 10 years. The activity is being modelled on the US Commercial Aircraft Safety Team (CAST) programme, which had set a similar goal for fixed-wing aircraft accidents in the mid-1990s. While it might seem unusual to describe such contemporary initiatives in a textbook, it is considered by the author that this activity is vitally important to the helicopter industry and to the theme of this chapter. IHST has defined a three-stage process summarized as follows: conduct data analysis, set safety priorities and integrate safety enhancements. A substantial number of operators, regulators and manufacturers worldwide have signed up to the master plan summarized in three components (Ref. 8.69):
‘IHSTMission: To provide government, industry and operator leadership to develop and focus implementation of an integrated, data-driven strategy to improve helicopter aviation safety worldwide, both military and civil IHST Vision: To achieve the highest levels of safety in the international helicopter communities by focusing on appropriate initiatives prioritized to result in the greatest improvement in helicopter aviation safety IHST Goal: To reduce the helicopter aviation accident rate by 80 percent by 2016’
The IHST was consolidated at the 62nd Annual Forum of the AHS in May 2006 (Ref. 8.69), where a number of participants reported on analysis conducted to date. Cross, in Ref. 8.70, examined the potential impact on safety of various mitigating technologies, noting that the airline industry had made significant improvements in its safety record through the introduction of, for example, damage-tolerant/fail-safe designs, extensive use of simulators in flight training, safety management systems and quality assurance to reduce human errors, flight data monitoring programs, disciplined take-off and landing profiles (e. g., stabilized approach), digital flight management systems to reduce pilot workload, improved situational awareness, help to cope with emergencies, improved one-engine-inoperative performance and various terrain/collision avoidance systems. Specifically, Cross drew the conclusion that more than 50% of accidents were preventable with a combination of enhanced handling, conferred by meeting modern FAR standards, and improved pilot training.
Referring back to Table 8.7, showing the limits on attitudes and accelerations following a failure, the questions asked are – can this approach also apply to the response caused by external disturbances and are the same standards applicable? Table 8.11 shows the approximate pitch attitude transients at 3 s following the maximum pitch-up attitude. The values represent the changes in attitude from the maximum pitch-up rather than the initial pitch. This method leads to significantly greater transients in some cases but is justified because although the pilot would not be expected to allow the aircraft to pitch, he/she would have to apply forward cyclic to maintain the hover, which would exacerbate the pitch-down as the vortex core was crossed. The italicized numbers in Table 8.11 correspond to the cases where the Level 3 boundary is exceeded. SCAS disengaged results are also shown to illustrate the power of the SCAS and its positive impact on safety.
Similarly, Table 8.12 lists the 3-s perturbations in vertical acceleration. Only SCAS-off data are included; the SCAS does not change the level. In this case the reference conditions are the points where the larger negative bump begins (e. g., at 17.5 s for the FGR with the 5 ft/s crossing, Fig. 8.60).
If the pilot intervention time had been set at 1.5 s, the perturbations would have reduced to less than 50% of those in Tables 8.11 and 8.12 (with the possible exception of some SCAS-off cases); the italic cases would then be within the Level 3 boundary
Table 8.12 Transient vertical acceleration following the vortex encounter
Encounter velocity
![]() 5ft/s 10ft/s
5ft/s 10ft/s
|
Lynx SCAS off |
0.16 |
0.31 |
0.47 |
|
|
0.2 < nz < 0.4 |
||||
|
FGR SCAS off |
0.19 |
0.38 |
0.53 |
|
Aircraft |
|
Vertical acceleration in 3 seconds (g) |
|
ADS-33 Level 3 |
and most other cases would be Level 2. Combining the ADS-33 approach with the hazard categories in Fig. 8.44 leads to the following relationships:
• Handling qualities Level 1,2 – hazard category MINOR (safety of flight not compromised; slight reduction in safety margin or increase in pilot workload)
• Handling qualities Level 3 – hazard category MAJOR (safety of flight compromised; significant reduction in safety margins or increase in crew workload)
• Handling qualities Level >3 – hazard category HAZARDOUS (safety of flight compromised; large reduction in safety margin)
From this classification, and without considering control margins, it can be deduced that with a 3-s pilot intervention time the vortex encounter is HAZARDOUS, and with a 1.5-s intervention time the hazard category of the encounter is MAJOR. Both relate to the disturbance-induced flight path variations and the resulting risk of disorientation or loss of control. It should be noted that the largest attitude and acceleration changes occur after the initial pitch-up or negative bump. It could be argued that the pilot may at this stage be aware of the vortex encounter and the normal, full-attention, 0.5-s intervention time is more appropriate. The hazard category may then reduce to MINOR.
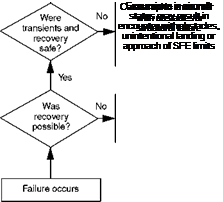
The effect of intervention time on the severity of the response can be investigated with the aid of the upset severity rating (USR) scale shown in Fig. 8.61. This scale is based on the pilot rating scale for failure transients described in Ref. 8.49 and already presented in modified form in Fig. 8.43. In summary, ratings A to E indicate tolerable severity and are awarded for cases where the disturbed excursions range from minimal, requiring no corrective action, to very objectionable, requiring immediate and intense pilot effort. For cases A through E, safety of flight is judged not to be compromised, and the hazard category is MINOR. Safety of flight is compromised with ratings of F through G, with excursions leading to possible encounter with obstacles, unintentional landing or exceedance of flight envelope limits; recovery is marginal and the hazard category is MAJOR (F) or HAZARDOUS (G). A rating of H means that the pilot judged recovery to be impossible with the hazard category CATASTROPHIC.
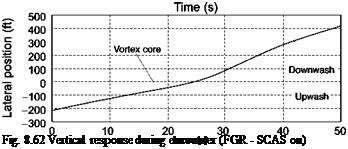
Figure 8.62 shows results from simulation trials at Liverpool with the FGR, with power, collective and vertical motion changes as the vortex is traversed at a nominal 10 ft/s. Also shown is the lateral track as a function of time with the core and outer boundaries indicated. The pilot reduces collective as the rotor enters the upwash of the advancing tail. The pilot is able to maintain height within ±10 ft during this phase of flight and reduces collective to command a very low engine torque, less than 20% of the hover setting. At about 25 s the vortex core is passed and as the helicopter moves into the downwash of the retreating tail, a descent rate of more than 1000 ft/min builds up in about 5 s, arrested by the pilot applying significantly more than the 106% transient torque limit. This transient overtorque limited the height loss to about 50 ft. Height and collective excursions when the helicopter experiences the downwash in the vortex tail are double those during the ‘upwash’ phase. The effect of the helicopter being rolled and accelerated to starboard during the core encounter, i. e., pushed out of the vortex, can be seen in the increased slope of the lateral position trace. An HQR of 7 and USR of F (MAJOR) were awarded for this case on the grounds that the torque limit was exceeded and the height excursion was beyond the adequate boundary of ±30 ft.
The ability to counteract the vertical motion induced by the vortex clearly depends on the available power and thrust margin. As shown in Fig. 8.62, the FGR was being flown with a power margin of more than 30%, reinforcing the point made earlier that the
 |
 |
|
Tolerable
 |
 |
|
Intolerable
Fig. 8.61 Upset severity rating scale
ADS-33 minimum standards for Level 1 performance margins in hover are insufficient in this respect. Another observation made by pilots during the trials related to the large changes in roll and yaw attitude during the encounter. Yaw motion can be induced by the lateral velocities in the lower and upper portions of the vortex. If the aircraft yaws by 90° then the pitch effects described earlier would transform into roll.
The solution to the wake vortex problem for runway-dependent aircraft approaching and departing along similar trajectories is to define minimum longitudinal separation distances. The severity of encounters can be catastrophic close to the ground, but the risk is lowered to an acceptable level by reducing the probability of occurrence through separation. When considering runway-independent aircraft and the associated
![]()
|
|
 |
concept of simultaneous, non-interfering operations (SNIOps), the problem is more complex and lateral separation of approach and departure flight paths also becomes a major issue. At any particular location, the positioning of a helicopter final approach and landing area can be optimized on the basis of prevailing winds and atmospheric conditions, fixed-wing aircraft landing and take-off patterns and the nature of the traffic at any particular time. Whether it will ever be acceptable to operate with this flexibility is another question, but the risk certainly needs to be carefully managed through flight path constraints and positioning of the terminal area ground operations. The most concerning result is the potential loss of height due to encounters with the downwash side of a vortex. Reference 8.64 documents an accident following a suspected encounter of a light helicopter with a vortex, and it was the vertical motion of the aircraft that most disturbed the crew prior to the loss of control and crash. Helicopters typically operate with fairly low power/thrust margins in hover (<10%). Although these may satisfy the handling standards for vertical performance, the results of both off-line and piloted simulations show that they may be wholly inadequate to overcome the effects of a vortex encounter. The situation will improve when some forward velocity has been gained and also when the helicopter has a rate of climb.
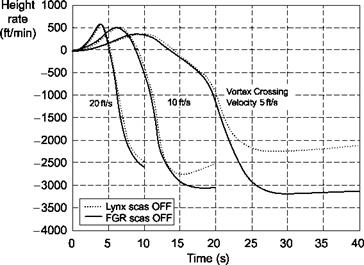
The vertical motions of the rotorcraft during the vortex encounters are illustrated in Fig. 8.58 (height), Fig. 8.59 (height rate) and Fig. 8.60 (vertical acceleration). The effects of SCAS are negligible in most cases; hence only SCAS-off results are presented. An exception is the vertical acceleration response of the Lynx, which has a feedback loop from acceleration to collective to improve high-speed stability characteristics.
|
|||||
|
|||||
|
|||||
|
|||||
|
|
|
|
Fig. 8.58 Height response in encounter |
The acceleration peaks in Fig. 8.60 would be reduced by 20% with SCAS engaged on the Lynx.
An important point to take into account when interpreting these data is that the initial trim of both aircraft is 100 ft to port of the clockwise-rotating vortex. The collective pitch is therefore lower than the hover value by an amount depending on the rotorspeed and rotor solidity. The fixed collective setting then results in a descent rate in
|
Fig. 8.59 Height rate response in encounter |
 |
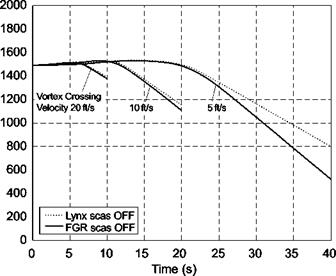
the receding vortex tail, which is higher than that corresponding to the hover collective setting. For the Lynx, the reference rate of descent (i. e., the descent rate corresponding to the decreased collective at the initial condition) is about 900 ft/min and for the FGR about 1200 ft/min.
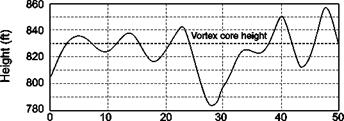
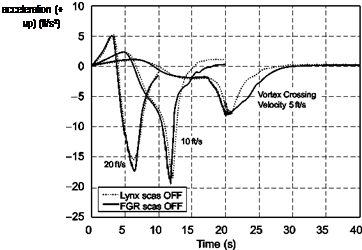
Approaching the vortex core the rotorcraft are lifted up to a maximum rate of climb of about 500 ft/min, followed by a reversal to a rapid descent rate of more than 2500 ft/min (more than 1500 ft/min relative to reference rate of descent noted in the previous paragraph). The slower the encounter, the greater time is spent in the vortex wakes and the larger height loss. At 20 ft/s encounter, 100 ft is lost in about 3 s; at 10 ft/s, 100 ft in 5 s; at 5 ft/s, 100 ft in about 8 s. The lower disc loading on the FGR results in larger peak accelerations and higher descent rates; at the fastest encounter of 20 ft/s, a bump of about -0.5 g is experienced within 3 s of a small positive bump. The descent rates induced in the vortex tail (1100 ft/min – Lynx; 2000 ft/min – FGR, again, relative to reference) are significantly higher than the 650 ft/min minimum requirement for Level 1 performance defined in ADS-33. This suggests that thrust margins of 10-15% would be required to enable a pilot to completely counteract the effects of a vortex encounter.
Handling qualities criteria provide a natural framework within which to set performance margins and quantify severity during upsets caused by vortex encounters. The preceding analysis has demonstrated that an aircraft satisfying minimum Level 1 (tracking) attitude quickness and (aggressive manoeuvring) control power performance should have sufficient control margin to overcome the effects of a full-strength vortex. Satisfying the normal minimum performance requirements for general MTEs will not provide an adequate margin, however. A rate SCAS significantly reduces the disturbance, while the addition of the attitude hold function (Lynx) returns the aircraft to the hover attitude, further reducing the upset. In terms of vertical performance, the minimum Level 1 standard, when translated into a margin for climb performance, is insufficient by a significant margin to overcome the effects of the downwash in the vortex tail.
Table 8.11 Transient pitch attitudes following the vortex encounter
|
Encounter velocity 5ft/s 10ft/s 20ft/s Aircraft Pitch attitude in 3 s (deg) ADS-33 Level 3
|
The performance criteria indicate what is ultimately achievable, but further insight can be gained by comparing the severity of the disturbance against the ADS-33 criteria for the transient response following failures.
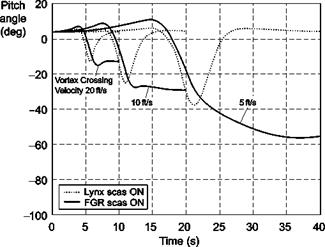
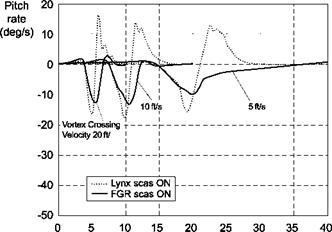
Figures 8.54-8.57 show aspects of the helicopter attitude response to a vortex encounter with no pilot recovery inputs. Figures 8.54 and 8.55 show the pitch attitude and rate response of the rotorcraft for three vortex encounter speeds: 5, 10 and 20 ft/s (~1.5, 3 and 6 m/s). The attitude transients increase as vortex-passing speed decreases as expected, since the aircraft is exposed to the vortex flow-field for longer. Note that the attitude hold system in the Lynx SCAS returns the aircraft to the hover attitude after the passage of the vortex, contrasting with the rate-damping SCAS in the FGR, which leaves the aircraft in a disturbed attitude state. Both rotorcraft initially pitch up as they pass through the advancing tail of the vortex induced by the lateral distribution of inflow through the rotor disc. As the rotor hub encounters the vortex core, the lateral inflow distribution reverses, leading to a much larger flapping and nose-down pitching moment. The attitude perturbations for the 10 and 20 ft/s encounters are approximately 30 and 20°, respectively, in 3-4 s, similar for both aircraft, while the slower encounter results in a pitch of nearly 40° in 5 s for the Lynx and more than 50° in 10 s for the FGR.
The pitching moment and corresponding accelerations are much higher on the Lynx with its hingeless rotor system, but the FGR is pitched to the larger attitude
|
Fig. 8.54 Pitch attitude response |
|
Time (s) Fig. 8.55 Pitch rate response |
because the increased diameter rotor is in the vortex for about 30% longer. The pitch response would be reversed for clockwise rotors (e. g., Eurocopter Super Puma).
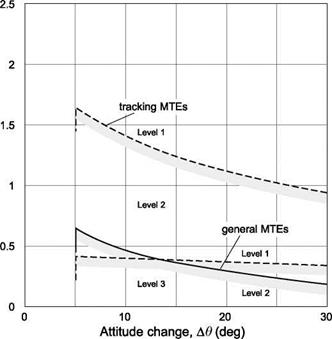
The attitude responses are plotted on the pitch quickness charts in Figs 8.55 and 8.56. On each chart the maximum quickness is also plotted as a function of attitude derived from applying high-amplitude pulse inputs with varying duration. The ADS-33 handling qualities boundaries are also included.
Both aircraft have significant quickness margin (40-100%) to overcome the vortex, up to the 30° pitch attitude change (limit set in the ADS manoeuvre performance). Also, just meeting the ADS-33 minimum quickness requirements for tracking tasks (Level 1/2 boundary) gives a significant response margin (50-100%) for attitude changes up to 30°. It should be recognized that the pitch rates are transient and the nature of encounters is such that the pilot should need to apply compensatory control inputs only momentarily. This is not to say that the transient disturbance is not a serious handling ‘problem’ for the pilot. Such encounters are most likely to occur close to airports, and Ref. 8.56 highlights the result that pilots would most likely abort an approach following such upsets. The results also indicate that an aircraft that just met the minimum Level 1/2 quickness requirements for general MTEs would have wholly inadequate control for counteracting the effects of a vortex encounter. As with control system failures, quantifying response in terms of flight-handling qualities parameters provides a description of severity that links with safety and provides the basis for safety cases. While the attitude response is important, the vertical disturbance can be even more serious.
A key part in the process of assessing the response of helicopters to the vortices of fixed – wing aircraft is the development of severity criteria for the encounters. Severity criteria based on handling qualities analysis link directly with the central thrust of this book. The results presented here are drawn from the author’s research with colleagues (Ref. 8.53-8.56), which was initially aimed at developing safety cases for the positioning of final approach and take-off areas (FATO) at airports. The work has since expanded to inform the development of operating procedures for runway-independent aircraft (Ref. 8.56), hence assisting the timely expansion of vertical flight aircraft operations, both helicopters and tilt rotor aircraft, to and from busy hubs.
The wake vortex
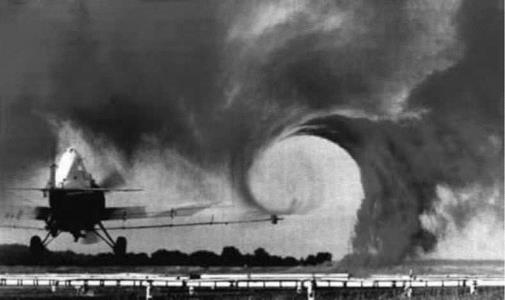
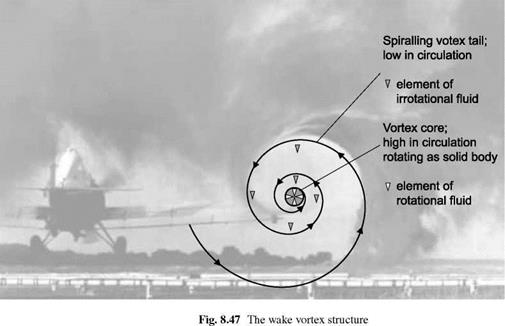
Wake vortices are an extension of the so-called bound vorticity of a lifting surface, shed from the wing tips as distinct vortex structures and rolling up with the span-wise shed vorticity into a counter-rotating pair. The resulting flow structure descends in the mean downwash from the wing, moves laterally with any horizontal wind and eventually breaks up as the inner core, kept together almost as a solid body by strong viscous forces, becomes unstable. Both fixed – and rotary-wing aircraft leave a vortex wake behind, dissipating the energy required to maintain the aircraft aloft. Figure 8.47 illustrates the flow topology in the tip vortex.
The velocity in the vortex core increases linearly with radial location from the centre, the fluid rotating effectively as a solid body. The flow here is ‘rotational’ so that elements of fluid rotate as they are drawn around in a circular pattern (see the white triangular fluid elements in Fig. 8.47). Outside the core, the flow is largely irrotational and the velocity decreases with distance from the core centre. An element of fluid would be drawn into the vortex from the surroundings, and would move toward the centre along a spiralling streamline, without rotation (the decreasing velocity with radius allows this to happen – see the grey fluid elements in Fig. 8.47) until reaching the outer edge of the core. The manner in which the rotational core is fed with irrotational fluid and the 3-dimensional development of the vortex, both radially and streamwise, has been the subject of aviation research for decades (see Ref. 8.57 for ‘… a consolidated European view on the current status of knowledge of the nature and characteristics of aircraft wakes…’). For the purposes of this analysis a rather simple model of the vortex structure is used and will be described following an appraisal of the severity criteria in handling qualities terms.
 |
 |
Hazard severity criteria
The definition of a hazard set out in the SAE’s Aerospace Recommended Practice ARP4761 (Ref. 8.40) is ‘a potentially unsafe condition resulting from failures, malfunctions, external events, errors or a combination thereof’. In busy airspace, aircraft are regularly exposed to the risk of experiencing unsafe conditions through wake-vortex
encounters (Ref. 8.58). Separation is designed to minimize this risk, but the risk is ever present, and its ‘acceptability’ is a function of the severity of the disturbance and the probability of occurrence. Generally, severe disturbances must be improbable and as the level of severity decreases, the frequency of occurrence can increase for the same risk. This critical relationship underpins aviation safety and system design.
There are two main concerns and related questions regarding disturbance severity:
(a) Does the disturbed aircraft have sufficient control margin for the pilot to overcome the disturbance?
(b) Can the disturbance transient lead to an unsafe flight condition if not checked within a reasonable pilot intervention time, in terms of collision with surfaces, exceedance of flight envelope, risk of pilot disorientation or loss of control?
The detailed answers to these questions lie in understanding the nature of the response of the aircraft to a vortex disturbance. In handling qualities terms, the response characteristics of immediate interest relate to the moderate to large amplitude criteria – quickness and control power (see Chapter 6). To recap, the control power is the amount of response achievable with the available control margin; the response quickness is the ratio of peak attitude rate to attitude change in a discrete attitude change manoeuvre. Quickness is inversely related to the time to change attitude and will be affected by roll/pitch damping, actuator limits and, to an extent, static stability effects, e. g., how much and in what sense sideslip or incidence changes occur during the manoeuvre.
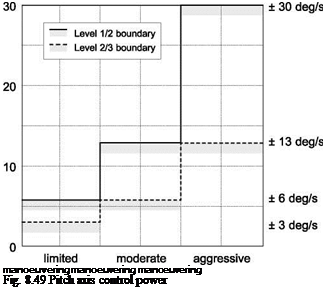
The sufficiency of attitude control margins in terms of quickness (for pitch manoeuvres up to 30°, roll up to 60°) and control power (for pitch manoeuvres >30°, roll >60°) is of primary concern. Reference 8.53 highlighted that the initial disturbance to an encounter with a vortex, aligned in the same direction as the helicopter (parallel encounter), will be in pitch. The non-uniform (lateral) incidence distribution imposed on the rotor disc by the vortex in a parallel encounter has a similar effect to the application of longitudinal cyclic pitch, the flapping response occurring 90° later to give pitch up/down moments. This is in contrast to the rolling moment disturbance experienced by fixed-wing aircraft following a parallel encounter. Figures 8.48 and 8.49 show the MTE-dependent pitch axis quickness and control power criteria boundaries for low-speed/hover tasks according to ADS-33 (Ref. 8.3, also Section 6.4).
A helicopter flying into the irrotational ‘tail’ of the vortex wake will experience a more uniform incidence distribution across the rotor disc, leading to thrust and power changes. In the heave axis, the corresponding Level 1 response criteria are defined in terms of control power (minimum of 160 ft/min, 1.5 s after initiation of rapid displacement of collective control from trim) and vertical rate time constant (t63% < 5 s). These correspond approximately to a hover rate of climb performance of 650 ft/min with a 5% thrust margin. Level 2 performance is obtained with a minimum climb rate of 55 ft/min and Level 3 with 40 ft/min. These values are relatively low and it can be appreciated that a general downwash of magnitude about 10 ft/s would nearly swamp the Level 1 performance margin. An aircraft should possess at least the Level 1 performance standards described above for the pilot to be able to fly moderately aggressive low-speed manoeuvres with precision and low compensation. The question arises as to whether an aircraft designed to meet the ADS-33 performance standards will have sufficient margin for the pilot to overcome the effects of a vortex encounter. The second issue listed above concerns the aircraft motion transients in response to the vortex encounter, and this will be addressed using the same methodology described for
![]()
|
|
|
 Minimum
achievable
pitch rate
(deg/s)
control system failures. ADS-33 sets requirements for the response to system failure transients in the form of Table 8.7 presented earlier in this chapter.
The focus in the study described in Ref. 8.55 was the severity of encounters for rotorcraft flying in hover and low speed (<45 knots), including low-speed climbs. The main concern is with the first column in Table 8.7, and particularly the Level 2/3 boundary, on the basis that this differentiates between safe and unsafe conditions. The Level 2/3 boundary corresponds to a transient that would result in a displacement of the aircraft of about 20 ft (6.1 m), with a velocity of about 20 ft/s (6.1 m/s) and angular rate of 10°/s, after 3 s. A question that arises when expressing the encounter transients using these criteria is – what should the pilot intervention time be? The 3 s in ADS-33 corresponds to a scenario of a single pilot attending to other mission duties while in hover with auto-hover engaged. In the UK Defence Standard (Ref. 8.42) this would correspond to passive hands-on operation. For attentive hands-on operation, the pilot response time is 1.5 s according to Ref. 8.42, following control system failures. In the US civil certification standards (Ref. 8.59) the response time (for hover operations) is set at the normal pilot recognition time (0.5 s). However, a strong argument could be made for increasing this to 1.5 s in divided-attention situations or when operating with auto-hover engaged.
To address the two questions posed above, a series of piloted simulation trials using the facility at The University of Liverpool (see Appendix 8A) was carried out. The modelling and simulation environment used in the studies was FLIGHTLAB and the HELIFLIGHT motion simulator (Ref. 8.60). The two aircraft featured in the study were the Westland Lynx and the FLIGHTLAB Generic Rotorcraft (FGR), configured as a UH-60 type helicopter. Key configuration parameters of the two aircraft are given in Table 8.9.
The aeromechanics modelling features are summarized in the following:
• blade element rotor with look-up tables of quasi-steady, nonlinear lift, drag and pitching moment as functions of incidence and Mach number (five equi-annulus segments),
• FGR – four rigid blades with offset flap hinge; Lynx – four elastic blades with first three coupled modes,
• three-state dynamic inflow model,
• Bailey disc tail rotor with S3 coupling,
• three-state turbo-shaft engine/rotorspeed governor (rotorspeed, torque, fuel flow),
• look-up tables of fuselage and empennage forces and moments as nonlinear functions of incidence and sideslip,
• rudimentary quasi-steady interference between rotor wake and fuselage/empennage,
|
Table 8.9 Helicopter parameters in the vortex encounter study
|
basic mechanical control system with mixing unit and actuators plus limited-authority stability and control augmentation system (SCAS – rate damping with attitude control characteristics at small attitudes in Lynx), rudimentary three-point undercarriage.
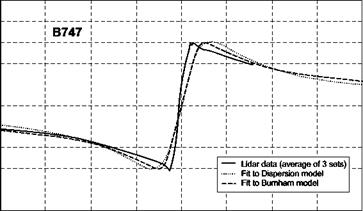
This level of modelling is generally regarded as medium fidelity, capable of capturing the primary trim and on-axis responses within about 10% of test data. Handling qualities parameters are also reasonably well predicted by this modelling standard. A variety of empirical models have been used to describe the tangential velocity profile of a tip vortex. Two commonly used examples are the ‘Dispersion’ model (Ref. 8.61) and the ‘Burnham’ model (Refs 8.62, 8.63); the Dispersion model takes the form
where Vt (r) is the tangential velocity at a distance r from the vortex core, rc is the core radius (defined as the distance from the centre of the vortex to the peak of the tangential velocity) and Г is the total circulation around the vortex (with units of m2—s-1).
The Burnham model takes the form
Vt (r) = Vc (r/rc), |r |< rc
where Vt (r) and rc are as defined previously, and Vc is the peak velocity, i. e., the value of Vt (r) at the edge of the rotational core, r = rc. These vortex models are compared to LIDAR (Coherent Laser Radar) measurements of the tangential velocities in the (young) vortex wake of a Boeing 747 in Fig. 8.50 (Ref. 8.54). A best fit was obtained for the velocity profiles of several aircraft types, and the resulting parameters are given in Table 8.10.
 Tangential 25 velocity (m/s) 20
15
10
5
0
-5
-10
-15
-20
-25
-20 -10 0 10 20
Distance from core (m)
|
Table 8.10 Best fit parameter values to LIDAR velocity profiles for the Burnham and dispersion models (Ref. 8.54)
|
As discussed in Ref. 8.54, the parameter values for the larger aircraft (Boeing 747, Airbus A340) should be reliable, but the maximum velocities for the medium twin engine aircraft (Boeing 757, Airbus A310) are estimates, which will be equal to or less than the true value, as the LIDAR sensitivity was insufficient to detect the peak.
In the study, the encounters occur when the vortex is at the (full) strength. Vortices do decay with time and the decay rate is a function of prevailing wind, humidity and wing flap configuration. The results presented therefore probably represent worse – case scenarios and the encounter effects in a real scenario may differ considerably. Key assumptions are that the vortex flow-field is unaffected by the rotorcraft and is superimposed on the quasi-steady incidence changes on the rotor. These assumptions are clearly open to question, but there is little reliable information on the interactional effects and they are likely to be very complex, particularly if the rotor blade cuts through the vortex core.
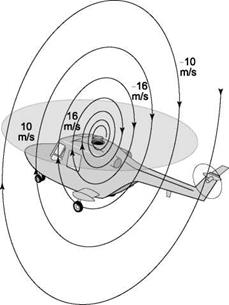
The velocity field of a Boeing 747 vortex when centred at the rotor hub is sketched in Fig. 8.51. Note that, at the rotor tips, the downwash/upwash is still considerable
|
|
(12 m/s, 39 ft/s), and with a rotor tip speed of about 220 m/s (720 ft/s) the perturbation in incidence is approximately 3°. This cyclic variation in incidence will result in longitudinal, forward, flapping of the rotor blades and a nose-down pitch moment for the anti-clockwise rotors on the Lynx and FGR.
A similar rationale can be applied to the perturbations in heave velocity. In this case the greatest disturbances are experienced when the rotorcraft is in the vortex tail, close to the core. The cyclic stick and collective lever margins available to the pilot to negate the effects of the vortex depend on trim position of the controls.
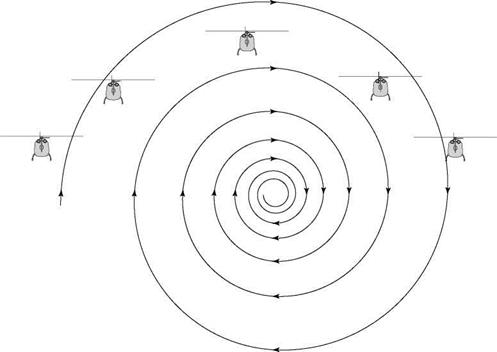
The technique of constrained simulation was used extensively in the study described in Refs 8.53-8.55 to ensure that the rotorcraft-vortex encounters have predictable initial conditions. Also, it proved more convenient and tractable to fix the position of the vortex in space and to move the aircraft laterally at different encounter velocities through the tails and core. As described in Ref. 8.53, with unconstrained simulations it was found that as the vortex approached the aircraft at the same height the aircraft would be lifted up in the approaching tail of the vortex and carried over the top and down in the following tail, as shown in Fig. 8.52.
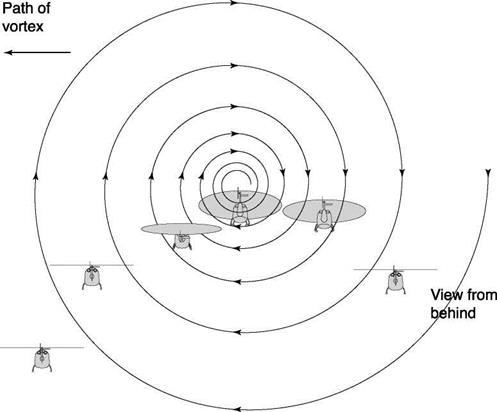
In contrast, Fig. 8.53 illustrates the case when the initial position of the helicopter was such that an encounter with the vortex core was forced to occur. This scenario is not unrealistic as the vortex wakes tend to remain at about a semi-span (of the fixed-wing aircraft) above the ground. Hence, to avoid the complications of having to set different initial conditions for the different helicopters, vortex wakes and encounter speeds and to ensure that worst-case scenarios are explored, the constrained simulation approach was adopted. The initial condition was with the rotorcraft positioned 100 ft (~30 m)
![]()
|
to the port side of the (port wing) vortex, simulating an encounter with a vortex shed from an aircraft taking off to starboard of the rotorcraft.
In the following section, results are presented for two cases: (i) with constrained vertical/forward motion and heading to explore pitch attitude perturbations as the core is encountered and (ii) with constrained attitude, heading and forward motion to explore heave perturbations as the tails are traversed. Both Lynx and FGR have been investigated, with and without their SCAS engaged, although only results with SCAS – on are presented as this will be the normal configuration. Encounters with the vortex wake of the Boeing 747 are shown; Ref. 8.54 presents comparisons of encounters with the different aircraft mentioned in Table 8.10.
To a first, albeit rather crude, approximation, the response of a helicopter to an atmospheric disturbance can be measured in terms of the force and moment derivatives discussed in Chapters 1, 4 and 5 of this book. In Chapter 1, the heave response to a vertical gust was touched on, and expressions for the contributing derivative Zw were then developed in Chapter 4. The discussion was extended in Section 5.4 to the modelling of atmospheric disturbances and the subsequent ride qualities. Heave response tends to dominate the concern because the rotor is the dominant lifting component on a helicopter. As the forward velocity increases, the energy of the ‘gust response’ is absorbed more and more by the vibratory loading, since this dominates the component of lift proportional to forward speed. The heave response derivative, Zw, becomes asymptotic to the expression — pa<^lR as velocity increases (see eqn 5.79). This represents an approximation to the initial vertical bump when flying into a vertical gust and is proportional to rotor blade tip speed and inversely proportional to blade loading (ib). In comparison, as a fixed-wing aircraft flies faster, the product of dynamic pressure and incidence leads to a heave response proportional to forward velocity V (— PaO V) and inversely proportional to wing loading (lw). The charts and tables of derivatives at the end of Chapter 4 give a ‘feel’ for the magnitude of the gust response; a typical helicopter has a value of Zw of about 1 m/s2 per m/s at high speed, giving a 1-g bump when entering a vertical gust of magnitude about 10 m/s. On entering such a gust the aircraft would be climbing at 6.3 m/s after 1 s (t63% = — Z~) and would continue climbing, approaching 10 m/s asymptotically. Similarly, the response to flight through a variable gust field can be approximated by the aerodynamic components of the damping derivatives L p and Mq (the gyroscopic components in expressions like eqns 4.86-4.89 are not included, only the aerodynamic terms), assuming the gust field can be approximated by a linear variation across the rotor disc. Linear approximations
have been used extensively by the fixed-wing community to analyze and quantify the gust response of aircraft, and similar methods are available and used in helicopter design.
Very strong atmospheric disturbances, where linear models are questionable, should be avoided in operations where possible. However, there are some situations where a helicopter has to be flown through a vortex-infested, swirling flow-field to reach its landing site. The helicopter, recovering to a ship or helideck, having to fly through the airwake from the superstructure presents such an example. In Ref. 8.7 (see also Refs 8.51 and 8.52), the ship airwake was described as the ‘invisible enemy’ by virtue of the fact that a pilot is very vulnerable to the degraded handling qualities arising from the effects of the unseen, unsteady and swirling vortical flow structures in the lee of a ship’s superstructure, which commonly is where the helicopter landing deck is situated. Over the decade since the publication of the first edition of this book a considerable amount of research, typified by that reported in Refs 8.51 and 8.52, has been conducted to develop modelling and simulation capabilities able to predict the ship-helicopter operating limits (SHOLs) in the presence of the ship’s airwake. The kind of problem faced by operators is shown in the example of the Royal Navy’s Royal Fleet Auxiliary (RFA), which has two landing spots, spot 1 on the port side close to the hangar and spot 2 on the starboard side to the aft of the flight deck. The difference in the SHOLs for spots 1 and 2 is compared with the original requirement during procurement in Fig. 8.46 (Ref. 8.51). The SHOL is the shaded area on the polar
 |
I I Requirement | | Current Helicopter Current Helicopter
RFA Spot 2 RFA Spot 1
plot of relative wind speed and direction. Although both are restricted, the SHOL for spot 1 makes it almost unusable in most wind-over-deck conditions. The problem is caused by the combination of the helicopter operating close to the hangar face at low heights and the airwake created by the geometry of the ship, the hangar and the flight deck. Mean and unsteady downwash velocity components are so high in this region that the pilot has difficulty taking off and hovering.
The SHOL is defined to allow operations to be conducted safely in the presence of disturbed atmospheric conditions and the additional difficulties associated with ship motion and degraded visibility. For the main discussion in this section of the chapter, we turn to a situation where operating limits are more difficult to define – the effect of fixed-wing aircraft trailing vortices on helicopter handling qualities.
Degradation in performance of a control function typically occurs when the power supply to a control surface actuator, mechanical or electrical, fails in some way. With the exception of some very small types, most helicopters feature powered control systems. The pilot moves the cockpit inceptors, and through a system of rods, bell-cranks, levers and pulleys (or computers and electrical signalling in a fly-by-wire system) the movement is transmitted to the input side of a hydraulic (or electro-mechanical) actuator. The output side of the actuator is connected to the non-rotating face of the rotor swashplate, which can be tilted or raised/lowered, transmitting signals through the rotating face of the swashplate and through the mechanical pitch link rods to the rotor blades. Three actuators are required on the main rotor to provide collective pitch, longitudinal cyclic and lateral cyclic pitch. The tail rotor normally requires only a collective pitch actuator. The high-reliability level required for rotor controls is usually achieved, ‘below the swashplate’, through redundancy of the mechanical or electrical actuation system. A dual-redundant hydraulic actuator would normally be supplied by two hydraulic systems, each providing 50% of the power. Failure of one of the supplies results in a degradation of performance, such that the maximum velocity and acceleration at which the control surface can be moved are reduced. The extent of the reduction depends on the pilot’s control inputs, since the same power system is typically driving collective and cyclic, but a straight comparison before and after failure would normally show a corresponding 50% reduction in maximum rate. This rather simple assumption is being used to establish the actuation power requirements in the preliminary design of the European civil tilt rotor aircraft as reported in Ref. 8.46. Degradation in the ‘predicted’ handling qualities, e. g., attitude bandwidth and quickness, can be derived from off-line analysis of the nonlinear simulation of the aircraft and its systems. The actuation rate at which the predicted handling falls into the Level 3 region establishes a minimum acceptable value corresponding to the transition from minor to major failure category (Fig. 8.44). Because it is likely that the predicted handling for several parameters is likely to degrade at the same time in this scenario, it is especially important to check the predictions by carrying out piloted tests using operational MTEs. The importance of this requirement is emphasized in Ref. 8.47, where the point is made that anything less than the same performance requirements as demanded in the MTEs for normal operational flight would lead to pilots relaxing their control strategy and consequently not really experiencing the adverse effects of degradation. While this might be possible in some or even most conditions, flight
 |
 |
Fig. 8.45 Control and responses in a hover turn manoeuvre
through heavy turbulence, recovering to a moving deck or a confined area in poor visibility may be unavoidable, hence some assessment of the likely consequences needs to be conducted.
Figure 8.45, from Ref. 8.46, captures this point perfectly. The data show results for two test pilots flying a tilt rotor aircraft in a 90° hover-turn manoeuvre to the ADS – 33 GVE performance standards. The actuation rate for the yaw control function, in this case provided by differential longitudinal cyclic pitch, was reduced incrementally until Level 3 ratings were awarded. The case shown corresponds to a reduced cyclic pitch rate of 3°/s. It can be seen that Pilot B flew the manoeuvre with an initial step control input, allowing the aircraft to slow gradually to the required heading with minimal closed-loop action. Pilot A, on the other hand, attempted to stop the yaw rate with a more abrupt input but immediately entered a pilot-induced oscillation. Over about 10 s the oscillatory pedal inputs increased to the stops with yaw rate building up to greater than 20°/s. The rate limiting on the cyclic pitch (differential longitudinal cyclic provides yaw control in hover) can be seen clearly in the lower-right figure. Pilot B returned an HQR 4 for this case, the same rating that both pilots had returned for the case with no rate limiting. Pilot B had continued to adapt his strategy as the system performance degraded to fly the task with moderate levels of compensation. Pilot A, with each new configuration, initially attempted the manoeuvre with a similar strategy, deliberately to focus on changes in handling. For the case shown, the pilot returned an HQR of 10 on the basis that he had to stop flying the aircraft (get ‘out-of-the – loop’) for several seconds. The aircraft had not, however, drifted outside the adequate performance limits on position and bank, only yaw angle, and arguably, a Level 3 rating would have been more appropriate. However, the pilot was holding right pedal on the stops for more than 5 s to bring the aircraft onto heading before coming out of the loop
and his impression was that he had, indeed, lost control. The rate limit on longitudinal cyclic was set at 4°/s, a very similar value to that defined for pitch control in the accel – decel manoeuvre. The full power actuation rate authority was actually set at 10°/s in this preliminary design study, 2.5 times the rate at which the Level 2/3 boundary had been predicted, hence giving an additional margin of safety for compensation in harsher environmental conditions.
Studying the effects of system failure brings home the importance and associated cost of safety in aviation, by far the safest sector in the transport industry. Ensuring that the effects of flight system loss, malfunction or degradation do not lead to a worsening of handling beyond Level 2 provides a major contribution to this safety. Players in this aspect of safety include regulatory bodies, requirements writers, design engineers, manufacturers, certification agencies, operators, maintenance engineers, training organizations and the pilots themselves; in other words, practically the whole aerospace community is involved. Nothing less than a total commitment to safety by the whole community will lead to an eradication of accidents resulting from system failures.
This brings us to the third situation where an otherwise Level 1 aircraft can be literally thrown into a degraded condition – by encountering severe atmospheric disturbances.