Category Aerodynamics of V/STOL Flight

Static Stability and Control of a GEM

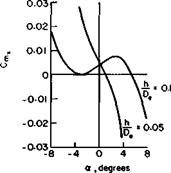
One of the problems of a GEM is its marginal inherent handling quality. A pure peripheral jet exhibits a slight stability in pitch at very low heights. However, this stability deteriorates rapidly as the height is increased above

Static Stability and Control of a GEM

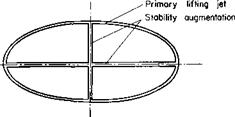
Fig. 12-8. Subdivision of GEM base to improve stability.

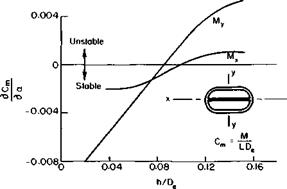
approximately 10% of the diameter. The GEM is inherently stable in heave; that is, as the height tends to increase, the decreasing lift drops the machine back to its trimmed height. Obviously, if we attached several small machines together at the end of a boom, the result would be stable both in heave and pitch. This is essentially the scheme by which the pitch stability of GEM’s is improved. Additional slots are cut in the base to divide the machine effectively into a number of smaller machines capable of sustaining different pressures under different portions of the base. Such a method is shown schematically in Fig. 12-8. The effect of subdivision of the base on the slope of the pitching moment curve with a is shown in Fig. 12-9. Here a stability slot has been installed along the x-axis only. Hence the stability is affected only about the x-axis. The result is a greater height for neutral stability about the x-axis than the y-axis.

Static Stability and Control of a GEM

Static Stability and Control of a GEM

Fig. 12-9. Effect of stability slot on static pitching moments: M = moment; L = lift;

De = equivalent diameter; Dh4 = base area.

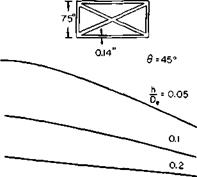
This improvement in stability is not obtained free, however. Figure 12-10 shows the decrease in A as the result of adding inside slots.

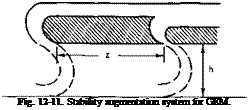
Another somewhat similar scheme for improving the stability of a GEM is presented in Ref. 5. An inside jet is incorporated to parallel the outer jet, as shown in Fig. 12-11. According to the reference, the normal distance between the two slots should be twice the height of the base above the ground in order to provide satisfactory stability.

The control of GEM’s can be accomplished either by diverting some of

0C

Подпись: 15Подпись: _1_Подпись: _1Подпись: 0-02 0.04 0.06 0.08 0.10 Inside slot width - inches Static Stability and Control of a GEMс

■З 4

О

с

<D

Є

з

Подпись: Fig. 12-11. Stability augmentation system for GEM.

Fig. 12-10. Effect of stability slots on thrust augmentation ratio.

the air applied to the base or by providing sources of separate thrusts such as external propellers. The second scheme seems to be gaining favor, as the control forces available with the base air are somewhat limited. Variations include a steerable propeller, ducted or open, and a fixed-propeller with movable control surfaces in its slipstream.

Problems

Подпись: w

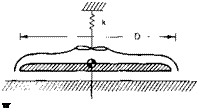
1. Given a circular peripheral-jet ground-effect machine of weight W suspended on a spring of constant k, assume h small in comparison with

D and small vertical excursions about a trimmed value of h. Derive an expression for the natural frequency of vertical oscillation.

[1] Bracketed numbers refer to references.

[2] single

Because df is approximately 1.8, this represents an increase of 90% in the induced power of the tandem configuration over that required by the single rotor. Fortunately, the induced power varies inversely with the velocity so that the increase, as a percentage of the total power, is not nearly so severe. Consider the single rotor example calculated above. By excluding the stall and compressibility corrections to make a more realistic comparison, we can see that a 90% increase in the induced power represents only a 13.5% increase in the total power.

Of course, some of this power is regained by the tandem in the form of decreased parasite power, because the tandem, loaded fore and aft, presents a fuselage shape with a smaller parasite drag than a single rotor helicopter

Operation of a GEM over Water

The operation of a GEM over water is similar to that over a solid surface with some small exceptions. At low forward speeds the higher base pressure displaces the water downward relative to the undisturbed surface. However, Eq. (12-5) still holds if h is measured in relation to the displaced surface. The magnitude of this displacement is, of course, equal to the base pressure expressed in inches or feet of water.

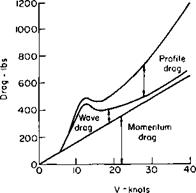
At low forward speeds, therefore, the GEM over water behaves like a displacement vessel. This means that in addition to the other sources of drag we must add a wave drag. As the velocity increases, a point is reached at which the displacement of the water surface is negligible. This results since the impulse applied to each fluid particle by the base pressure becomes less and less as the speed increases. This behavior is illustrated in Fig. 12-7. Here a drag breakdown is shown for the S. R.N. 1, an 8500-lb machine with 535 ft2 of base area. For this particular craft the wave drag reaches a maxi­mum at about 12 knots.

Operation of a GEM over Water

Fig. 12-7. Drag breakdown of a GEM: W = 8500 lb, S = 535 ft2.

The GEM in Forward Flight

In forward flight power must be supplied to overcome the drag of the GEM in addition to sustaining the weight of the machine. Although the

The GEM in Forward Flight

The GEM in Forward Flight

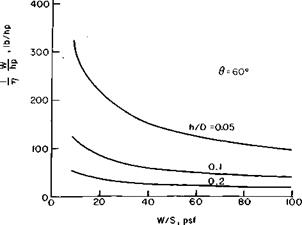
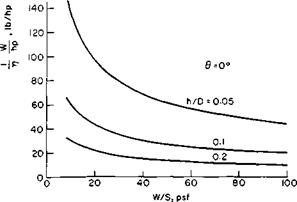
Fig. 12-5. Effect of height, disk loading, and jet angle on power loading.

available data are somewhat conflicting, there is evidence that the thrust augmentation factor does not vary radically with forward speed. Thus the power required in forward flight is approximately equal to the sum of the power calculated to hover and the product of the drag and the forward speed. The drag is equal to the sum of the parasite drag and the momentum drag. Hence it is important for an economically feasible, high-speed GEM to be aerodynamically clean.

The momentum drag is not so high as one might think. If Mj is the mass flux through the machine, the momentum drag might be calculated as the product of the forward speed and M;. However, experimental data suggest a thrust recovery of this momentum somewhat similar to the jet flap. What

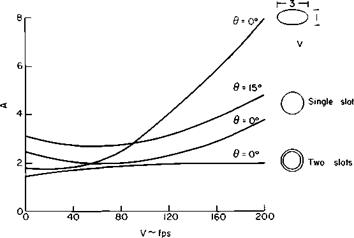
little data are available in this regard show the momentum drag to be approximately half of the product of V and My The effect of forward speed on the lift augmentation factor is presented in Fig. 12-6, taken from the work of Higgins and Martin reported in Ref. 4. We cannot really generalize on these curves because the results must depend

The GEM in Forward Flight

Fig. 12-6. Effect of forward speed on augmentation ratio: D = 16 in., h/D = 0.1, all slots 0.06 in.; elliptic planform has same base area as circular planforms.

on the height of the machine above the ground, the ratio of jet velocity to forward speed, and the external shape of the machine. However, these data, as well as those obtained by others, show no serious deterioration of A with forward speed and even suggest the possibility of some increase of A with V.

Hover Performance

Reference 1 is an excellent collection of papers on the subject of ground – effect machines. Reference 2, taken from Ref. 1, forms the basis for most of the material presented in this section. This reference aptly illustrates what can be accomplished by the application of basic momentum principles, for its results agree closely with more sophisticated and elaborate analysis.

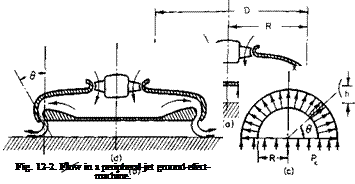
Initially, many investigators considered the two-dimensional GEM in order to provide insight into the behavior of all GEM’s. However, the analysis of Ref. 2 is sufficiently straightforward to permit the ready analysis of three-dimensional configurations. Consider first the performance of the circular planform, peripheral jet GEM shown in Fig. 12-2.

A control volume, shown in Fig. 12-26, is formed by a vertical plane of symmetry, the ground, the base of the machine, and the jet sheet. If pc is the pressure within the cavity above atmospheric pressure and it is assumed to be constant, the integral of this pressure taken over the plane of symmetry must equal the change in flux of momentum in the jet in the x-direction. If Fj is the total momentum in the jet, then

[p-dA =J„

Hover Performance(12-1)

If the jet is assumed to curve in a circular path becoming tangent to the ground, the left-hand side of (12-1) becomes

J Pc dA = p^lRh + h2(l – 0 •

Therefore

Подпись:2FJ

Pc nD2[2(h/D) + (h/D)2(4 – 7t)]

Now, by applying the momentum theorem to control surfaces just above

and below the machine and neglecting the incoming momentum of the air, the weight that the jet system in ground effect can support is obviously

nD2

W = Fj + Pe—- (12-3)

Out of ground effect, W = = Fy The ratio of W to Wx is referred to

as the thrust augmentation factor A and from (12-2) and (12-3) becomes

Подпись: (12-4)

Hover Performance

A = 1 +

The same procedure can be followed for other cases than that in which

Подпись: A = cos в + Подпись: (12-5)

the jet issues vertically downward. It can be advantageous to incline the jets inward through some angle в, as shown in Fig. 12-2d. However, there is little to be gained in going through the algebraic exercise of deriving A for the general case. Instead, the augmentation

Подпись: Fig. 12-3. Thrust augmentation ratio versus height-diameter ratio: theory [Eq. (12-5)]; □ = unpublished data, 0 = 0°.

Equation (12-5) is presented graphically in Fig. 12-3 with some un­published data for the particular case of в = 0. Although not too obvious

from the illustration, the optimum в for maximum A increases as A/D decreases. As A/D approaches zero, the optimum в approaches 90°. The nearly constant experimental values of A between A/D-values of 0.25 to 0.5 are typical of other experimental results.

Next consider the power required by a peripheral jet GEM to hover. If t is the thickness of the jet and Vj, the jet velocity, the power delivered to the jet is

P = QAp = (nDtv j)pv2j.

Подпись: hp Подпись: nDtpv] 1100??“ Подпись: (12-6)

The actual power required will depend on the losses in the internal ducting and the efficiency of the fan. If they are combined into a single efficiency, /7, then the required horsepower can be expressed as

Подпись: (12-7)The total flux of jet momentum F ■ can be written as Fj = nDtpVj.

The total lift of the machine W is thus AFj or W = AnDtpvj.

Hence the lift per horsepower is

W _ ПЩА

Hover Performance Подпись: (12-8)

hp “ Vj

Подпись: T hp Hover Performance Подпись: (12-9)

where W/S is the weight loading with S equal to nD2/4. Hence all other factors being equal the power loading increases inversely with the square root of the weight loading. In Chapter 4 the identical result was obtained for a propeller operating at zero forward speed. From Eq. (4-16) for a propeller

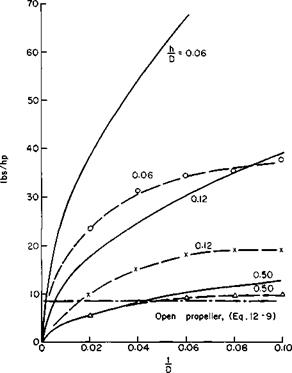
These power and thrust relationsmps can be expected to hold only where the thickness of the jet is small in comparison with the height and diameter. Generally speaking, the predictions are optimistic in comparison with experimental data, at least as far as the power is concerned. Figure 12-4 compares model data taken from Ref. 3 with calculations based on Eqs. (12-4) and (12-8) from which the experimental values of pounds per horse­power for h/D values of 0.12 and 0.06 are seen to be significantly lower than the theory would predict. The experimental values, however, are still well above the value of pounds per horsepower for the ideal statically thrusting propeller with a disk loading of 20 psf.

Figure 12-5 presents the results of calculations based on Eqs. (12-5) and (12-8) for a range of h/D-, в-, and W/S-values for a constant value of t/D of 0.08. The selection of the combination of these design parameters depends on other factors in addition to the aerodynamics. For example, the mini­
mum value of h that can be tolerated will depend on the maximum obstacle height one wishes to pass over. From a power standpoint, of course, the lower the h and W/S the better. Generalized design studies tend to indicate that the place of the GEM in future transportation will probably be as large, high-speed ocean-going craft.

Hover Performance

Fig. 12-4. Lifting capability of GEM’s:————— experimental (Ref. 3),

———- theory [Eq. (12-8)]; W/S = 20 psf; hp = jet horsepower.

Presently, machines are operating commercially with gross weights of approximately 30 tons up to speeds of 80 mph with an installed horsepower of 4000. Larger machines up to 100 tons with speeds of 120 knots and power of 10,000 hp are currently in the design stage. The weight loadings of these machines are fairly low at about 10 psf of base area. The power loadings are approximately 16 to 20 lb/hp—nearly double that of helicopters.

Ground-effect machines

Ground-effect machines Подпись: (M

Although ground-effect machines (GEM) might be described as VTOL aircraft that never quite made it, they are believed to have sufficient potential to warrant at least a chapter. As the name implies, a GEM is limited to operating in proximity to a surface—either a solid surface or over water. By so doing, however, it is able to sustain much greater loads for a given power than an aircraft that operates out of ground effect.

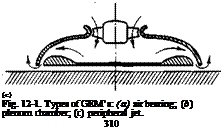
Various types of ground-effect machine have been proposed or studied. They include the air bearing, plenum chamber, and peripheral jet illustrated schematically in Fig. 12-1. Here, only the peripheral jet machine is con­sidered, for it appears to be the most promising configuration. The air­bearing type requires a smooth prepared “ road bed,” whereas the plenum chamber type requires more power than the peripheral jet configuration.

The Design of Cascades for a Prescribed Chord wise Pressure Distribution

The lift, moment, and pressure distribution for airfoils in cascade can be predicted by conformal mapping or by methods similar to thin airfoil theory in which each foil is replaced by a vortex sheet. However, in the general case, both methods are difficult to apply.

It is possible under certain simplifying assumptions to calculate the mean flow through a cascade of airfoils with a prescribed pressure distribution. The mean streamline thus calculated approximates the shape of the camber line of the vanes to produce the prescribed pressure distribution. However, because of the finite number of blades, hence nonuniformities in the flow, the mean streamlines and vane camber lines differ by a small but significant amount. The purpose of this section is to calculate this difference by the
application of thin airfoil theory. The problem is reduced to an integral equation in the unknown vorticity distribution of the vanes, but because of its complexity only particular examples are evaluated.
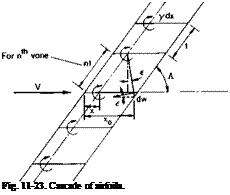
Подпись: Fig. 11-23. Cascade of airfoils.

A cascade of airfoils is shown in Fig. 11-23. Consistent with thin airfoil theory, each airfoil is replaced by a distribution of vorticity y(x). Although, in general, each vane is cambered and at an angle of attack, a, relative to Vm, the vorticity is placed on periodically spaced straight lines parallel to Vm. Also, the boundary conditions that the velocity resulting from Vm and in­duced by the vorticity must be tangent to the vanes everywhere along their

cambered lines is satisfied only on the x-axis. Again, this is consistent with the linearized thin airfoil theory.

The Design of Cascades for a Prescribed Chord wise Pressure Distribution Подпись: (11-16)

The downwash on the reference vane at a distance x0 due to an elemental vortex, у dx, located at x on the nth vane is

but

Подпись: sin єx0 — x — nt cos A

r

r2 — (nt sin A)2 + (x0 — x — nt cos A)2.

The Design of Cascades for a Prescribed Chord wise Pressure Distribution

Thus it follows that

In order that the mean camber line may be a boundary, or streamline, of the flow, the following must hold:

The Design of Cascades for a Prescribed Chord wise Pressure Distribution(11-18)

where a is the angle of attack of the chord line of each vane and yc is the displacement of the camber line from the chord line. At this point, theo­retically, the problem is solved, for if a, yc, Л, and t/c are given it should be possible to solve Eqs. (11-17) and (11-18) for y(x), hence the pressure distribution. Practically, the mechanics of solving the integral equation con­taining a doubly infinite series is quite involved, even for relatively simple cases. Instead of attempting to solve for y(x) for a given yc and a, a >>(x) distribution is assumed and the resulting yc is calculated. To make the problem tractable, the special case in which Л = тг/2 corresponding to Pm = 0 is studied. For this case Eqs. (11-17) and (11-18) become

The Design of Cascades for a Prescribed Chord wise Pressure Distribution(11-19)

To evaluate this integral a change of variables is made:

The Design of Cascades for a Prescribed Chord wise Pressure Distribution The Design of Cascades for a Prescribed Chord wise Pressure Distribution

x = I (1 – cos в),

The Design of Cascades for a Prescribed Chord wise Pressure Distribution

The doubly infinite sum appearing in Eq. (11-20) can be evaluated by contour integral methods. Let

Подпись: — cot (inB);
The Design of Cascades for a Prescribed Chord wise Pressure Distribution

and note that

The Design of Cascades for a Prescribed Chord wise Pressure Distribution

but cot і в = — і coth в. Therefore

Substitution of the above into Eq. (11-20) gives the following:

The Design of Cascades for a Prescribed Chord wise Pressure Distribution

The Design of Cascades for a Prescribed Chord wise Pressure Distribution

Substitution of Eqs. (11-23) into (11-22) gives

– hi


у sin 0 dO


+ J_ ^ Г у sin 0(cos 0 — cos ф) dO, 6n2tJ Jo


(11-24)


where nc/t < 1.5.

For a given у-distribution the modification to м(ф) due to the cascade can be clearly identified in Eq. (11-24).

The Design of Cascades for a Prescribed Chord wise Pressure Distribution

Fig. 11-24. Cascade of airfoils with у = 0 at leading and trailing edges.


Consider now a cascade of airfoils with a у-distribution given by

у = X Лі sin пв. (11-25)

n=l

Because у vanishes at both 6 = 0 and n, it is obvious that the leading and trailing edges of the airfoil will become stagnation points that will result in a cascade of the form shown in Fig. 11-24.

Equation (11-16) is now substituted into (11-24). In addition, the following relations are used:

sin пв sin 6 = j[cos (n — 1)0 — cos (n + 1)0], (11-26)

sin (n — 1)0 — sin (и + 1)0 = —2 sin 0 cos и0, (11-27)

J

‘K cos пв dd sin пф

0 cos 0 — cos ф sin ф

Equation (11-24) then becomes

Note, as one would expect, that for forward loading the slopes at the leading edges differ appreciably, whereas for aft loading it is the trailing edge slopes that differ the most.

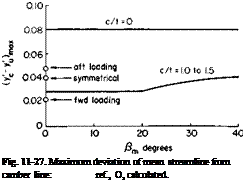
In Ref. 8 a number of different cascades are analyzed. Starting with the measured pressure distribution, the mean streamlines are calculated and compared with the camber lines. The data is expressed in the form of A njl versus Pm, where, according to the notation of this section,

Подпись: Fig. 11-27. Maximum deviation of mean streamline from camber line: ref., O, calculated.

Part of Fig. 298 of Ref. 8 is given here as Fig. 11-27. Spotted on the figure are the results calculated for the three sample cases. It can be seen that,

according to the calculations, increases as the loading shifts aft

and that the experimental results fall in between the forward loading and the symmetrical loading case.

The values of (A«i//)max f°r l/t = 0 is readily verified by letting nc/lt = 0 in Eqs. (11-38) and (11-39). For this case

Подпись:Ус =

У и =

Therefore

(Ус Уи)тах

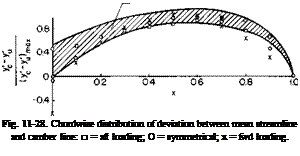
The chordwise distribution of Anjl is given in Fig. 11-28, and similar plots appear in Ref. 8 for different cascades. A general band is included in

Fig. 11-28 in which 75% of the data in Ref. 8 falls. It can be seen that the predicted trend is similar to the experimental trend with the symmetrical and aft loading distributions having the better agreement.

Observations and Conclusions. A solution for a cascade of airfoils, subject to the limitations of thin airfoil theory, has been obtained. Although the results are given only up to the second harmonic of the pressure distribu­tions, they could easily be extended to include higher-order terms, at least for zero stagger angle and solidities less than one. Without too much difficulty, the results could be extended also to cover higher solidities by carrying through additional terms of Eq. (11-23).
Подпись: Fig. 11-28. Chordwise distribution of deviation between mean streamline and camber line: □ = aft loading; О = symmetrical; x = fwd loading.
The relationship between the vortex theory and the momentum con­siderations of the mean streamline can be seen if the spacing t is allowed to

approach 0 while keeping the vorticity per unit length along z finite. As t -> 0, let y/t = у’, nt = z.

Equation (11-17) then becomes

(x0 — x — z cos Pm)y'(x) dz dx

(z sin /U2 + (x0 – X – z cos pmf

The Design of Cascades for a Prescribed Chord wise Pressure Distribution

Since у is not a function of z, (11-17) can be integrated immediately with respect to z to give

The derivative of w(x0) with respect to x0 is then

(*o) = У'(*о) sin Л.

Подпись: (11-40)dw

dx о

Equation (11-40) could be written almost immediately from consideration of the strength of the elemental vortex in Fig. 11-29.
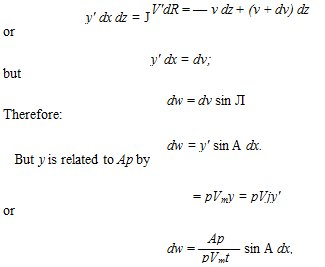
Подпись: y' dx dz = J V'dR = — v dz + (v + dv) dz or y' dx = dv; but dw = dv sin Л Therefore: dw = y' sin A dx. But у is related to Ap by = pVmy = pVjy' or Ap dw = ——— sin A dx, pVmt (11-41)

(11-42)

Equation (11-42) is the same result obtained by momentum considerations for the mean

/ A dx

flow resulting from distributing the vorticity of each vane uniformly in the z-direction.

We can now easily determine the cascade geometry to produce a desired pressure distribution. If the form of Ap is given by

Ap = jpV%,Cpf(x),

then

C

C, = — f(x) dx.
c Jo

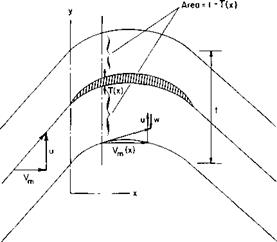
Given a desired turning angle в and choosing a solidity, we calculate Ct from Fig. 11-17 or Eqs. (11-12) and (11-13). Knowing Ct, Cp, and Ap(x) are then determined. The velocity w can next be calculated by integrating Eq. (11-42) from 0 to x. Referring to Fig. 11-30, the shape of the mean streamline can now be determined from the fact that

dyu и — и’ dx VJx) ’

(11-44)

Vm{x) is determined from continuity by

Vj = Vm(x)[t – T(x)],

(11-45)

where T(x) is the thickness of the vane in the у-direction. Having calculated yu(x) for the mean streamline and knowing C and C„ we calculate y’u from

II

– Э

(11-46)

The difference between the camber line and the mean dimensionless form, y’c — y’u, can be estimated from Fig.

streamline in 11-26 or from

The Design of Cascades for a Prescribed Chord wise Pressure Distribution

Fig. 11-30. Construction of the mean streamline including the effect of vane thickness.

Figs. 11-27 and 11-28, depending on whether the loading is symmetrical and more toward the leading or trailing edge. The shape of the camber line is then calculated from

y«(*) = l? u + (Ус – y’JlcC,. (11-47)

The attractiveness of the mean streamline method, devised by Wislicenus,

is the fact that most of the camber of the vane, in the form of the mean streamline, can be calculated by relatively simple momentum and con­tinuity principles and only the small difference between the mean camber line and mean streamline needs to be estimated.

Problems

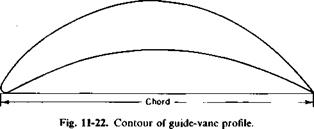
1. Calculate the cascade geometry to produce a turning angle of 90°, with Ap equal to a constant across each vane. Use a solidity of 1.93 and the thickness distribution of the vane in Fig. 11-22. How does the resulting vane compare with the illustration?

2. A jet of air 1 ft in diameter issues from a long straight duct with a velocity of 400 fps and with a density equal to that of air at standard sea-level conditions. What is the thrust produced by the jet? It now goes into a cylindrical duct with a bellmouth entry and a throat diameter of 4 ft. Assuming complete mixing, what is the thrust of the combination? Now the mixed flow goes into a diffuser with an exit diameter of 6 ft. What is the total thrust now? Finally, the diffused, mixed flow is turned 90° by a well-designed cascade. What is the vertical thrust?

3. Given a primary jet and two nozzles, and assuming that the mixing is

The Design of Cascades for a Prescribed Chord wise Pressure Distribution

complete at the end of each nozzle, derive an expression for the augmentation ratio.

The Deflection of a Jet by a Cascade of Airfoils

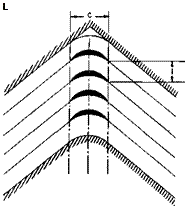
Whether augmented or nonaugmented, the momentum in the exhaust of a turbo-jet must be turned for VTOL applications in order to attain a vertical component of its thrust. This is in lieu of rotating the entire engine. Figure 11-12 is a sketch of the jet being turned by a cascade of airfoils in a

The Deflection of a Jet by a Cascade of Airfoils

Fig. 11-12. Flow turned in a duct by a cascade of airfoils.

duct. This section treats the basic aerodynamics of such a cascade without being concerned with any one particular cascade or design configuration for diverting the jet at different angles.

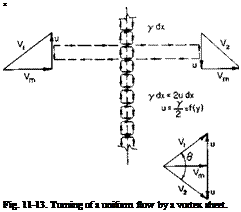
We begin by placing a doubly infinite two-dimensional vortex sheet in a uniform flow, as shown in Fig. 11-13. Either by application of the Biot – Savart law and integration over the vortex from x = — oo to + oo or by consideration of the circulation around a dashed path, the velocity induced

by the sheet is purely tangential to the sheet and is constant, independent of the distance from the sheet, and has a value of

М=Д. (11-8)

Подпись: X Fig. 11-13. Turning of a uniform flow by a vortex sheet.

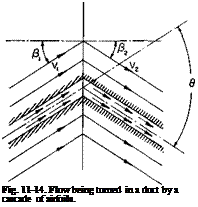
This velocity reverses direction discontinuously through the vortex sheet. The uniform и adds to the uniform velocity Vm and produces the streamline

pattern shown in Fig. 11-14. We can replace two of the streamlines by solid boundaries, thus generating a flow being turned through an angle в in a duct. Notice that the velocity Vm does not exist anywhere in the duct except in the plane of the vortex sheet.

Let us now replace the vortex sheet by a finite number of airfoils in cascade spaced a distance of t apart, as shown in Fig. 11-15. If Г is the circulation around any one airfoil, then from (11-8) the velocity и will be

Г

и = —•

2t

For an inviscid fluid the resultant force on the vanes can be normal only to Vm. For each vane, by applying the momentum theorem,

Подпись: (11-9)L = pVmt2u

or, from the Kutta-Joukowski law,

L = pVm Г
= pVJ2ut).

In terms of a vane lift coefficient,

L = У VicC,

or, using (11-9),

C-4(B’ ,1M0)

where a is the cascade solidity,

Подпись: c a = — t (11-11)

Подпись: L Подпись: Fig. 11-14. Flow being turned in a duct by a cascade of airfoils.

Hence the lift coefficient of each vane increases as the turning increases or the solidity decreases.

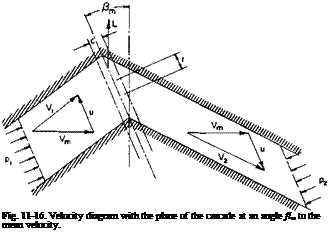
Now let us go back to the vortex sheet, but this time let us place the plane of the sheet at an angle Pm different from 0 to the velocity Vm, as shown in Fig. 11-16. By writing Bernoulli’s equation from the left duct to the right duct we can obtain the pressure decrease across the cascade as

Pi ~ P2 = 2PuVm sin Pm-

Подпись:
By application of the momentum theorem or by use of the Kutta-Joukowski

law it is apparent that the resultant force on the cascade is still normal to the mean velocity Vm and for one vane is given by

L = pVm Г

= pVJlut).

Подпись: C, Подпись: (11-12)
The Deflection of a Jet by a Cascade of Airfoils

Again, if we let L = ^pV„cCh then

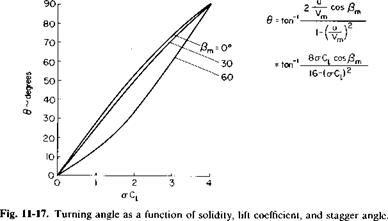
Подпись: 0 = tan 1 Подпись: ~2(u/Vm) cos Pm~ . 1 - iu/Vmf J Подпись: (11-13)

Hence C, for the same solidity, and и is not a function of the angle fim. However, from the geometry of Fig. 11-16 the angle through which the flow is turned is given by

This relationship is presented graphically in Fig. 11-17 as a function of <rC, for various values of /?m. Notice that regardless of a value of <rC, = 4 will produce a turning angle of 90°.

The Deflection of a Jet by a Cascade of Airfoils

The Deflection of a Jet by a Cascade of Airfoils

Подпись: L/D

/3 ~ degrees


The Deflection of a Jet by a Cascade of Airfoils

Hence for a given C, the turning angle decreases as /?m departs from 0. However, there is something to be gained by having a /?m greater than 0, corresponding to Fig. 11-16. This is the fact that in such a cascade the flow is accelerating and has a favorable pressure gradient. Hence the

The Deflection of a Jet by a Cascade of Airfoils

Fig. 11-19. Effect of solidity on С,(ттяІ and L/D.

frictional losses and the maximum C„ both dependent on the boundary layer growth, may be improved with a greater than zero.

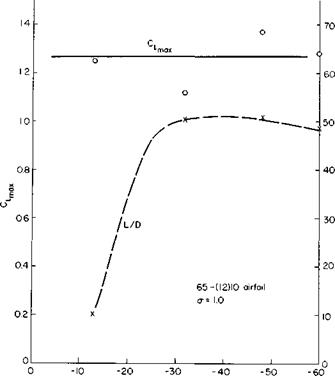
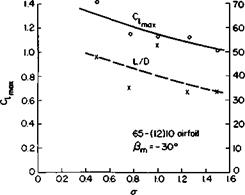
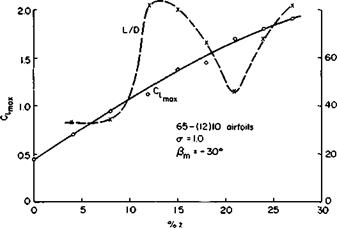
Figures 11-18,11-19, and 11-20 summarize the data of Ref. 6. As presented in the reference, these data are based on and the resultant inlet velocity. When reduced on the basis of Vm and /?m, as shown here, the data are very

The Deflection of a Jet by a Cascade of Airfoils

The Deflection of a Jet by a Cascade of Airfoils

Fig. 11-21. Effect of drag on total pressure.

revealing. Figure 11-18 shows little or no variation of C, maii with the angle Pm for constant solidity and camber. The preceding paragraph suggested a possible improvement of C, max as fim becomes more positive. The L/D curve even shows the opposite trend with /?m. However, the L/D data are some­what erratic and should be viewed with caution. In general, the safest state­ment would be to say simply that most of the L/D values at C, max range between 20 and 60. The importance of L/D is discussed later.

Figure 11-19 shows the effect of varying the solidity while keeping f}m and the camber constant. Although there is some scatter, there is a definite trend for C, max to increase with decreasing solidity.

The effect of varying camber, keeping solidity and f}m constant, is shown in Fig. 11-20. As expected, C, max increases with increasing camber and, at least for this a and /?ш, shows no sign of leveling out as z is increased.

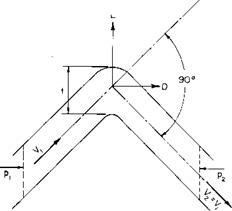
The drag of the cascade in turning the jet produces a loss in the total pressure of the flow, hence in the thrust that can be produced by the jet. To obtain an expression of the relative decrease in the thrust in terms of the cascade drag, let us consider only the particular case in which the jet is turned through 90°. From Fig. 11-21, since Vl = V2, we can write

ІРі ~ Pi)t – D = 0.

Thus, in dimensionless form, the decrease in total pressure across the cascade is

Ap D

The Deflection of a Jet by a Cascade of Airfoils

The Deflection of a Jet by a Cascade of Airfoils

Now consider a jet flow with a mass flow rate m and a total pressure of Pi + hpV- By expanding this jet to ambient pressure for incompressible flow we obtain a jet velocity of

/Pl — Po + lPv i‘

" 4hP

If the total pressure is now decreased by Ap, the reduced jet velocity will be

The decrease in the jet momentum flux as a fraction of the original flux therefore is

AT

Подпись: AT ~T The Deflection of a Jet by a Cascade of Airfoils Подпись: K, Подпись: 2 “11/2

T

Using (11-14) and assuming the fractional decrease to be small, we obtain

Подпись:The Deflection of a Jet by a Cascade of Airfoils2

Finally, in terms of the resultant velocity in the duct Fj, the fractional decrease in the jet thrust after substituting for C, is

Подпись: AT T The Deflection of a Jet by a Cascade of Airfoils(11-15)

The ratio of VJ depends on the particular design of the duct. For a straight duct VJv} might be about 1.0. If the cascade were located in a short duct right behind a propeller, VJ vj would be about j for the static case.

Reference 7 is a study of the design of turning vanes for miter bends at the corners of a water tunnel. The criteria for these vanes are nearly identical to those for turning a high velocity jet of air. The Reynolds number is high, the flow is turned through 90° with a minimum loss, and low pressure peaks
are to be avoided (to prevent cavitation in water or low Mcr in air). Accord­ing to the reference, the optimum solidity is about 1.9. For R = 1.2 x 10⁶ based on Vl and the vane chord the following pressure loss coefficients are reported for two different solidities :

a = 1.89, Cp = 0.13,

a = 0.943, Cp = 0.26,

where Cp = Ap/jpV.

From the preceding developments the drag-to-lift ratios are half the above Cp values, or £ = 0.065 and 0.13 for the higher and lower solidities,

The Deflection of a Jet by a Cascade of Airfoils

respectively. Note that because aC, = 4.0 for в of 90° the higher solidity corresponds to a C, of 2.12. These results are fairly well in line with the data of Ref. 6. A drawing of the vane, selected from Ref. 7, is shown in Fig. 11-22. The drawing is to scale.

From this data, it would appear that the frictional loss in thrust due to turning the jet through 90° will be of the order of 5%, depending on the ratio of V1 to Vj. This may not seem to be too much, but as a percentage of the payload it may be a deciding factor.

Thrust augmentation and deflection of jets from turbo-jet engines

For many V/STOL missions the utilization of turbo-jet engines appears promising. This is particularly true for missions requiring short hovering times in which the low specific weight (pounds of engine weight per pound of thrust) offsets the disadvantages associated with the high disk loading such as high jet velocities and high specific fuel consumption (pounds of fuel per hour per pound of thrust). Also, for supersonic aircraft the required thrust – to-weight ratio of the power plant can exceed unity anyway, and all that is needed for adding V/STOL capability to these aircraft are the necessary controls and nozzles for vectoring the jets from the engines.

Thrust Augmentation

The thrust from a turbo-jet engine, particularly at low speeds or in the static case, can be augmented by passing the jet through a nozzle or a

Thrust augmentation and deflection of jets from turbo-jet engines

Fig. 11.1. Thrust augmentation of a turbo-jet.

series of nozzles. The primary flow from the jet induces a secondary flow of air through the nozzles, thereby developing a thrust on the nozzles. This is shown schematically in Fig. 11-1. The entrainment of the secondary flow is

280

produced by the high viscous shear and turbulent mixing that occurs along the boundary of the jet. For this reason the performance of the system depends not only on the geometry of the system but also on the Reynolds number of the jet.

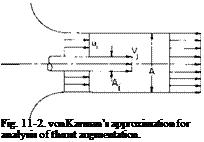
Подпись: Fig. 11-2. von Karman’s approximation for analysis of thrust augmentation.

A relatively simple approach to the analysis of a thrust augmenter was suggested by von Karman in Ref. 1. Consider the simple jet-nozzle com­bination shown in Fig. 11-2. It is assumed that the exiting flow has been completely mixed so that the exiting velocity is uniform. The problem is to calculate the ratio of the total thrust to the jet thrust. This ratio, denoted by ф, is called the thrust augmentation ratio. The area of the nozzle is taken to be constant and equal to A. The area of the jet is denoted by Aj and its velocity by vf, u1 is the velocity of the secondary flow in the plane of the jet, whereas u2 is the uniform velocity issuing from the nozzle. It is further

assumed that the pressure at the nozzle exit is equal to the undisturbed static pressure, and p1 is the static pressure at the jet exit.

From continuity

u^A – A+ VjAj = u2A. (11-1)

Application of the momentum theorem between the jet exit and the nozzle exit results in

APi ~ Po) = PuA – pvjAj – pu(A – Aj). (11-2)

Also Bernoulli’s equation can be written outside the entrance up to the plane of the jet before mixing occurs.

Po = Pi + ipul – (11-3)

From these equations, eliminating n, and pu

Подпись:u2 — q(l — 2a) + yj2a — 6a.2 + 6a3 — 2a4,

Vj 1 – 2a + 2a2

where a = Aj/A. The augmentation can then be calculated from

Подпись: Ф =puA

PVjAj

Подпись: (11-5)(и2/у/

a

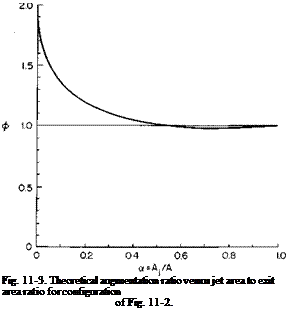
Подпись: Fig. 11-3. Theoretical augmentation ratio versus jet area to exit area ratio for configuration of Fig. 11-2.

Because (11-5) represents complete mixing, it is the maximum augmenta­tion to be expected from such a jet nozzle configuration; ф is shown as a

function of a in Fig. 11-3. It can be seen that ф drops off rapidly with increasing values of a for values of a below approximately 0.1 and is less than unity for a greater than j.

Thrust augmentation and deflection of jets from turbo-jet engines Подпись: 2 Thrust augmentation and deflection of jets from turbo-jet engines

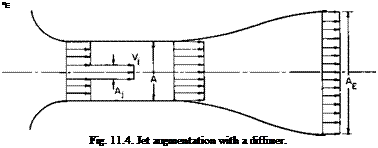
Theoretically, ф can be increased by the addition of a diffuser after the nozzle, as shown in Fig. 11-4. If it is assumed that the mixing is complete at the end of the cylindrical section and that Bernoulli’s equation holds in the diffuser, the ratio of the exit velocity VE to the jet Vj can be found in a manner similar to that used to obtain Eq. (11-4).

ф is then calculated from

a _ PV*A£ PvjAj

-(-)4

(11-7)

vjJ a

where p = Ae/A.

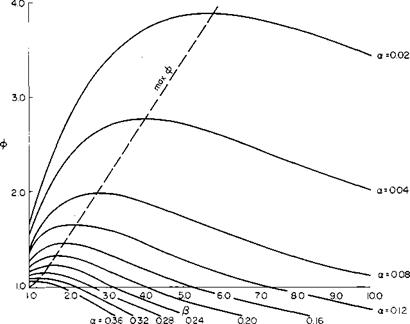
Equations (11-6) and (11-7) have been evaluated for combinations of a and p; ф as a function of P is given in Fig. 11-5 for constant values of a. For

Подпись: VE Fig. 11.4. Jet augmentation with a diffuser.

a constant value of a it can be seen that as j8 is increased <f> reaches a maximum value and then decreases for further increases in p. This graph clearly demonstrates the possible gains to be achieved by diffusion, partic­ularly for small a-values.

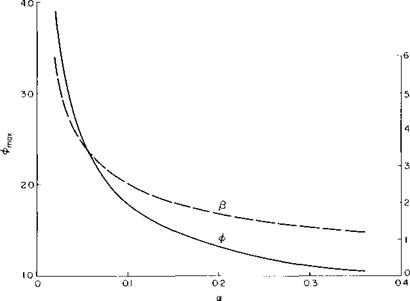
Figure 11-6, taken from Fig. 11-5, presents the maximum augmentation ratio obtainable with diffusion as a function of a. Also shown on the graph is the diffusion area ratio that gives the maximum ф.

The foregoing developments represent only one approach to predicting the performance of a thrust augmenter. Other analyses accounting for the thermal properties and compressibility of the working medium have been made in which the enthalpy of the mixed secondary and primary flow is assumed to be equal to the enthalpy of the entering primary flow.

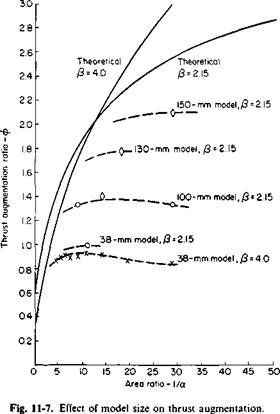
The predictions in Fig. 11-5 appear to represent an upper limit on ф difficult to attain in practice. Both Reynolds number and compressibility effects have a pronounced influence on the performance of a thrust augmenter, as pointed out in Ref. 2. At high Mach numbers the primary jet expands after leaving the nozzle, thus giving an effectively greater oc. At low Reynolds numbers the mixing of the primary and secondary flows is in­complete. This is illustrated in Fig. 11-7, taken from Ref. 2 (Fig. 5-5).

Here, measured and theoretical values of ф are compared as a function of

Thrust augmentation and deflection of jets from turbo-jet engines

Fig. 11-5. Thrust augmentation ratio as a function of a and /?.

Thrust augmentation and deflection of jets from turbo-jet engines

Fig. 11-6. Theoretical maximum augmentation ratio and optimum diffuser area ratio.

Thrust augmentation and deflection of jets from turbo-jet engines
Подпись: Secondary flow
Thrust augmentation and deflection of jets from turbo-jet engines

1/a for a series of nozzles all having a diffuser area ratio [S of 2.15 (with the exception of the one small nozzle). It is apparent from this figure that, as the model size increases, the experimental results are approaching the theoretical values. Unfortunately, it is not entirely certain exactly what the Reynolds

numbers and Mach numbers were for the data of this figure. For the smaller nozzles the Reynolds number based on the primary velocity of the jet was approximately 8000, with a corresponding Mach number of about 0.8. It is believed that the Mach numbers are comparable for the larger models and that the improved performance of the larger models is probably attributable to Reynolds number effects.

A word of caution is called for here regarding this data, for the results are rather attractive for the larger models. These data are for the Coanda nozzle shown in Fig. 11-8. Instead of being injected centrally, the primary jet is injected around the periphery of the inner nozzle wall and follows the wall around in the downstream direction (the Coanda effect). Efficient mixing can occur for this configuration for a given primary mass rate of flow because of the large surface area of the primary jet. Were the same amount of fluid injected centrally, the performance would probably not be so good. As already mentioned, the Reynolds number for this nozzle is based on the primary jet velocity. The characteristic length used was the diameter of the nozzle throat.

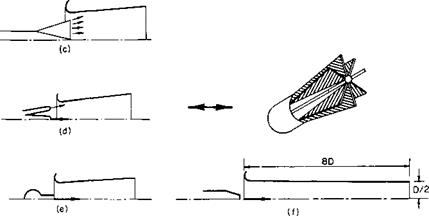
The secret of success for thrust augmentation by secondary flow entrain­ment appears to lie in the provision of a primary jet with a large surface area so that adequate mixing of the two streams is ensured. Some configurations that accomplish this mixing are described in Ref. 3 and shown in Fig. 11-9.

Thrust augmentation and deflection of jets from turbo-jet engines

Thrust augmentation and deflection of jets from turbo-jet engines

Fig. 11-9. Various types of thrust augmenters: (a) annular ring; (b) three annular rings; (c) radial; (d) seven divergent injectors; (e) multi-inline; (/) NACA (Morrison).

Thrust augmentation and deflection of jets from turbo-jet engines

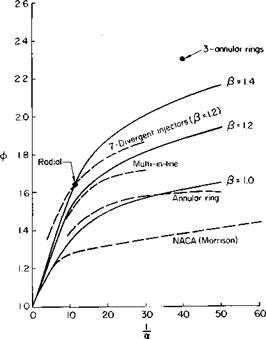
Fig. 11-10. Performance of various thrust augmenters:—————– theory;————- experiment.

Thrust augmentation and deflection of jets from turbo-jet engines

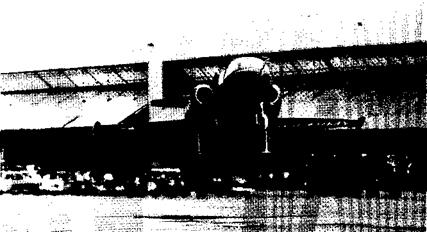
Fig. 11-11. The Lockheed Hummingbird—an aircraft that utilizes jet thrust augmentation by secondary flow entrainment. (Lockheed Aircraft Co.)

Here, the primary jet is issued in the form of sheets through radial slots or concentric rings. The performance of these augmenters is described in Fig. 11-10. Observe that these augmenters incorporate diffusers that also seem to be a requirement for high augmentation ratios. Indeed, the long cylindrical nozzle of the lower augmenter on this graph probably has in effect a p less than unity because of the boundary layer growth on the nozzle walls.

From the theoretical and experimental results presented here it appears possible to augment the thrust from a jet appreciably by entrainment of secondary flow. Whether it is practicable to achieve values much in excess of 2 remains to be seen. The types of primary nozzle shown in Fig. 11-9 are certainly promising, but even here there may be a total pressure loss that will detract somewhat from the 0-values of Fig. 11-10.

Thrust augmentation has been utilized in one aircraft to date (see Fig. 11-11). In Ref. 4 а ф of 1.24 is quoted for this aircraft.

Increase in Maximum Lift by Suction

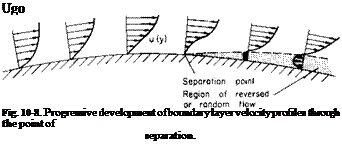
Подпись: Ugo Fig. 10-8. Progressive development of boundary layer velocity profiles through the point of separation.

The Karman-Polhausen method is useful for predicting the occurrence of separation as well as transition. The progressive development of the velocity profiles through separation is shown in Fig. 10-8.

Increase in Maximum Lift by Suction

At the point of separation

From (10-22) this condition leads to the requirement that the coefficient a must vanish. Thus from (10-23) it holds, with or without suction, that at separation

Подпись: (10-25)A = -12.

Suction can be used to ensure that Л is always greater than —12. In the general case the relation between the suction velocity and Л can be deter­mined by numerically integrating the momentum integral equation. How­ever, some insight into the effect of suction on separation can be readily obtained by a method attributed to Prandtl. Prandtl considered the case in which the suction is just sufficient to maintain the separation profile.

In this case du/dy = 0 at the wall so that suction does not influence the values of a, b, c, and d. Hence и becomes

~ = 6h2 – 8h3 + ЗА4.

Подпись: 00oo

Notice that (З is not zero, but because of the change in the boundary con­ditions the effect on the coefficient is the same as if /? were zero; <5* and в for this case are from (10-24):

3*_ _ 2 в _ 4_

T “ 5’ S~ 35

The momentum integral equation can be expanded and put in a slightly different form:

3* + 2 6dUx dS v0 i0

~ur^ + T, + u:-w. (I0’26)

For the separation profile t0 and dO/dx are zero. Hence (10-26) becomes

Increase in Maximum Lift by Suction(10-27)

Increase in Maximum Lift by Suction

In addition, from the boundary layer equation applied at the wall

but for the separation profile д2и/ду2 = ЩІІ^/52), so that

Подпись: (10-28)‘ — 12v T/2

_(dUJdx)_

Подпись: Vo Подпись: 2.18 Increase in Maximum Lift by Suction Подпись: 1/2 Подпись: (10-29)

The suction required to maintain the separation profile is thus

Increase in Maximum Lift by Suction Подпись: 2.18 Подпись: v dp/dx umPui Подпись: 1/2 Подпись: (10-30)

In terms of the pressure gradient, this can be written as

Thus, as one would. expect, the greater the adverse pressure gradient, the greater the CQ must be to maintain the separation profile.

Increase in Maximum Lift by Suction Подпись: (10-31)
Increase in Maximum Lift by Suction

The foregoing applies only to laminar boundary layers. In order to predict the separation of turbulent boundary layers, recourse must be made to experimental results because of the uncertainties involved with the shearing stresses. The momentum integral equation still holds for the turbulent boundary layer. However, it is usually written in the form

where H is the shape factor defined by (10-11).

Experience has shown that a turbulent boundary separates when Я has a value of approximately 1.8 to 2.4.

The velocity profile in a turbulent boundary layer can be fitted closely by a power law

Подпись: (10-32)и _ /у1/и

~ W ‘

For such a form 5*, в, and H can be found from

ё*____ 1_ в n 2

S 1 + n S (1 + иХ2 -1-й) + n

The crux of the problem in studying the turbulent boundary layer lies in obtaining information on H and the wall shearing stress. If this is known, then (10-31) can be integrated. One common assumption is that тolpU2^ is of the same form as for a flat plate:

Подпись: (10-33)ч = a

pUi (U00e/v)llk’

к and a depend somewhat on Reynolds number. Reference 1 suggests using a = 0.0128 with а к of 4 or a = 0.0065 with а к of 6. In integrating (10-31), since H is increased by 2 and generally does not vary much with x, it is not too unrealistic to use a mean value for Я, say the flat plate value of 1.4 corresponding to an exponent n of 5.

By the foregoing procedure, however, we do not obtain any predicted variation of H with x so that the separation point cannot be predicted by using H as a criterion. To do this the reader is invited to take his choice of the myriad analyses of turbulent boundary layers to be found in the literature.

A practical approach to the problem of preventing separation of the turbulent boundary layer or the upper surface of a wing can be found in Ref. 4. Here the approach was taken to calculate the suction distribution necessary to prevent 0 from growing with x. Also a value of H of 1.5 was assumed. Under these assumptions, since dd/dx = 0, Eq. 10-31 becomes

Vq_ = r0 _ 3.50; dUx Ux ~ pUi Ux dx

Подпись: (10-34) (10-35) or in coefficient form

Vo_=C/+ AAi dJA, uaо 2 1 – c„ dx ’

where Cf = turbulent flat plate skin friction coefficient evaluated at the local Reynolds number based on x and Ux,

Cp = (P — P0)/ipUl = local pressure coefficient,

6j = initial value of momentum thickness.

0; can be calculated from methods to be found in Ref. 1 or by the following equation taken from Ref. 4 and credited to Tani.

0; = ^0.44vC/-x6_xJJ’ Ui dx j (10-36)

where xT is the distance from the leading edge measured along the surface to the transition point.

In Ref. 4, Eq. (10-35) was applied to a sailplane and the resulting CQ was calculated as a function of x. From tests of this sailplane with an unflapped wing an average CQ of 0.00316 produced a CLmax of 2.3 with suction, an increase of 0.9 over the solid wing. This increases in Ctmax for this 1300-lb aircraft required less than one air horsepower for the suction.

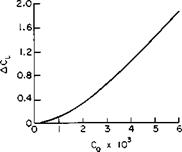
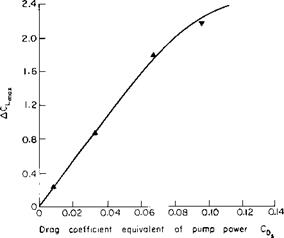
BLC was also applied to light-powered aircraft at Mississippi State Uni­versity. Porosity was obtained by drilling rows of holes in the surface approximately 0.030 in. diameter and spaced no closer than 0.1 apart. The results interpreted in Ref. 5 are presented in Figs. 10-9 and 10-10. From Fig. 10-9 increments in Ctmax of at least 2.0 are seen to be possible by the application of suction BLC. The power required for this particular instal­lation to accomplish a given ACLmax is represented in Fig. 10-10 as an

equivalent increase in the aircraft drag coefficient. If Ps is the suction power required, then CDs is defined according to

Ps = pV3SCDs.

Actually the BLC system should not be charged for all this power, for, in addition to delaying the stall, the suction reduces the form drag of the

Increase in Maximum Lift by Suction

Fig. 10-9. Increment in Cimix due to suction BLC.

wing. I remember clearly the treat afforded me by the late Dr. Raspet of being taken for a flight in a sailplane with BLC. After touching down at near stall with the BLC off, the BLC was turned on and we were able to climb back into the air because of the reduced drag. I also remember that with BLC applied only to the right wing the unbalance in lift produced by

Increase in Maximum Lift by Suction

Fig. 10-10. Variation of suction power with increment in CLt

the unsymmetrical BLC was greater than the available aileron control. However, as pointed out in Ref. 4, the use of distributed suction for stall control imposes no severe trim requirements. An important conclusion of this reference is that the technique of distributing suction by means of the momentum equation yields lift increments with much less power than is required by the single-slot systems previously investigated.

Von Karman Momentum Integral Equation

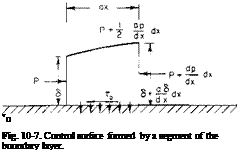
Подпись: vo Fig. 10-7. Control surface formed by a segment of the boundary layer.

The solution of the boundary layer equations, although more palatable in these days of computers, can still prove to be a formidable task in the general case of suction and when dp/dx is not zero. To circumvent these difficulties, a method, attributed to von Karman, is often used in which the

momentum theorem is applied to the gross characteristics of the boundary layer.

Consider Fig. 10-7. A control surface is formed by a differential segment of the boundary layer. The flux entering the left face of the control surface is

Подпись: и dy.Von Karman Momentum Integral Equation■a

Подпись: io

The flux passing out through the right face can be written

The flux removed by suction is

Qs = v0 dx.

Because the flux in must equal the flux out, Q3, the flux in along the top, can be calculated from

Подпись: 2l + бз — 0.2 + Q:

or

The fluid along the top being drawn in has a velocity in the x-direction of Ux. Thus the total flux of momentum in the x-direction coming in is

Подпись: Momoul Von Karman Momentum Integral Equation
Von Karman Momentum Integral Equation

The total momentum out is

The sum of the forces in the x-direction acting on the fluid around the control surface is

Z К = PS + (p + fx *)f Л – (p + fx *)(<5 + fx *) – •. *.

– * U.""

Von Karman Momentum Integral Equation Подпись: ~ d ( f  I dx V. и dy J + v0 Подпись: (10-19)

where t0 is the shear stress at the wall. Equating ZF* = Momout — Momin and dropping higher-order terms produces the following:

However, from the definition of the displacement and momentum thick­nesses

Подпись: f

Von Karman Momentum Integral Equation

U dy = 11^(6 – 5*1

Substituting the above in (10-19) and relating p and UrXj by Bernoulli’s equations, we obtain

uj* ^ + T – + u^0 = -• (10-20)

dx ax p

Equation (10-20) is known as the von Karman momentum integral equation (modified for suction) and relates the displacement and momentum thickness to the wall shearing stress and the velocity U^. It applies equally well to laminar and turbulent boundary layers. For a Newtonian fluid such as air or water the wall shearing stress r0 for laminar flow is given by

(10-21) where p is the coefficient of viscosity.

The advantage in using Eq. (10-20) lies in the fact that the results do not depend to any great extent on the form of the velocity distribution u(y). We can assume a и(у) and by satisfying Eq. (10-20) relating the gross characteristics arrive at reasonable values of these quantities.

For example, consider a flat plate with no suction; (10-20) becomes

dO r0

dx pUi

Now assume an extremely crude profile, namely, a straight-line variation from 0 at the wall to U„ at у = <3.

и у

u^ = s’

For this distribution 9/8 = 5, 8*/8 = and t0 = p(U^/8). Hence (10-20) becomes

d5 6p

dx pUj

Von Karman Momentum Integral Equation

or integrating and substituting for в and 8* gives

These results agree surprisingly well with Blasius’ exact solution. Even the wall shearing stress is only about 13% lower than that calculated by the exact method.

Karman-Pohlhausen Method

We represent the velocity profile by a fourth-degree polynomial in terms of the dimensionless distance from the wall, h = y/8.

-j— = ah + bh2 + ch3 + dhA. (10-22)

on

Von Karman Momentum Integral Equation Подпись: at у = 0,

The constants a, b, c, and d are determined from the following boundary conditions. From Eq. (10-1)

Подпись: и = 0,at у = 0.

Von Karman Momentum Integral Equation Подпись: , -6/? - ЗЛ ‘■TT' , -A-3p + 6 6-/! • Подпись: (10-23)

At у = ё, и = Uди/ду = 0, 82и/ду2 = 0. From these boundary con­ditions the constants are found to be

where

<52 «Л/, „

=—– j—> P =—–

v ax v

In terms of a, b, c, and d, the displacement and momentum thickness are given by

s*

1 a- b– 2 3

c

d

5

4

5

9

S ~

1

+

1

a2

3

ab

У “

2ас + b2 5

Подпись: (10-24)ad + be 2bd + c2 cd d2

3 7 ~4 ~ ~9

Equation (10-20) can now be solved numerically, given UrJx). At each x, Rd, and the shape factors H or К are calculated and R6. compared with R6irjt from Figs. 10-4 and 10-5. In this manner the point of transition can be determined or the amount of suction required to delay transition can be calculated.