Category MECHANICS. OF FLIGHT

Skin friction or Surface friction

These two between them form a large part of the total drag of an aeroplane – in the high subsonic range, the major part. The sum of the two is sometimes called profile drag but this term will be avoided since it is apt to give an impression of being another name for form drag, whereas it really includes skin friction.

The total drag of an aeroplane is sometimes divided in another way in which the drag of the wings or lifting surfaces, wing drag, is separated from the drag of those parts which do not contribute towards the lift, the drag of the latter being called parasite drag. Figure 2A illustrates an old type of aero­plane in which parasite drag formed a large part of the total. Figure 2B (overleaf) tells another story.

Lines which show the direction of the flow of the fluid at any particular moment are called streamlines. A body so shaped as to produce the least poss­ible resistance is said to be of streamline shape.

We may divide the resistance of a body passing through a fluid into two parts –

[5] Form drag or Pressure drag

[6] To allow the tail to touch the ground before the main wheels (Fig. 6.7a). This is hardly a practical proposition.

[7] To have a much higher undercarriage (Fig. 6.7b). This will cause extra drag and generally do more harm than good.

[8] To provide the main planes with a variable incidence gear similar to that which is sometimes used for tail planes (Fig. 6.7c). This involves consider­able mechanical difficulties.

[9] To set the wings at a much greater angle to the fuselage (Fig. 6.7d). This means that in normal flight the rear portion of the fuselage sticks up into the air at an angle which not only looks ridiculous, but which is inefficient from the point of view of drag. It gives the appearance of a ‘broken back’, but has sometimes been used for aircraft designed for deck landing since it not only gives a low landing speed, but a quick pull-up after landing.

The only real answer lies in the design of flaps and slots which must be such that the effective camber of the wing can be altered so as to give

We assumed at an earlier stage, that the area of the wings was bound to remain constant, but inventors have from time to time investigated the problem of providing wings with variable area.

Since W = CL. іpV2 . S

W/S = CL. ipV2

It is easy to work out simple problems on minimum or landing speeds by using the now familiar formula –

Weight = Tift = CL. ip У2 . S

If we denote the maximum value of the lift coefficient by CL max, and the landing speed by VL, then our formula becomes

W = CL . max ip У2 . S

[10]The quotation from The Stars in their Courses by Sir James Jeans is given by courtesy of the Cambridge University Press.

[11] A car is travelling along a road at 50 km/h. If it accelerates uniformly at 1.5 m/s2 –

(a) What speed will it reach in 12 s?

(b) How long will it take to reach 150 km/h?

[12] A train starts from rest with a uniform acceleration and attains a speed of 110 km/h in 2 min. Find –

(a) the acceleration;

(b) the distance travelled in the first minute;

(c) the distance travelled in the two minutes.

[13] If a motorcycle increases its speed by 5 km/h every second, find –

(a) the acceleration in m/s2;

(b) the time taken to cover 0.5 km from rest.

[14] During its take-off run, a light aircraft accelerates at 1.5 m/s2. If it starts from rest and takes 20 s to become airborne, what is its take-off speed and what length of ground run is required?

Numerical questions

The student may be surprised to find that in some of the examples below, we have used unfamiliar units such as knots for air speed and feet for altitude. This is quite deliberate, because flying is an international activity, and it is standard practice to use knots and feet for performance calculations. Anyone therefore who is thinking of making a career in aeronautics, whether as a pilot, an engineer, a technician or working in the area of flight management will have to get used to using these units and develop a feel for the magnitudes involved. Note that it is usually safer to convert the values to SI units before making cal­culations as these units are much simpler to use. Do not however forget to convert the answers back where appropriate. For convenience, we have given the necessary conversion factors below. You will soon get used to converting knots tom/s. You may not need to convert the feet to metres in all cases, because often all you need to know is what the relative density is at the given height. This can be found from Fig. 2.2 which gives the relative density against height, both in metres and feet.

In Europe, it is now common practice to use SI units for aerodynamic analysis and design, and for general scientific work, so questions of this type are in SI units.

It is recognised that in order to solve some of the examples, assumptions must be made which can hardly be justified in practice, and that these assump­tions may have an appreciable effect on the answers. However, the benefit of solving these problems lies not in the numerical answers but in the consider­ations involved in obtaining them.

Unless otherwise specified, the following values should be used –

Density of water = 1000 kg/m3 Specific gravity of mercury = 13.6 Specific gravity of methylated spirit = 0.78 International nautical mile = 1852 m, or approx 6076 ft 1 knot = 0.514 m/s 1 ft = 0.3048 m

Radius of earth = 6370 km Diameter of the moon = 3490 km Distance of the moon from the earth = 385 000 km Aerofoil data as given in Appendix 1 CD for flat plate at right angles = 1.2 cylinder = 0.6 streamline shape = 0.06 pitot tube =1.00

Take the maximum length in the direction of motion for the length L in the Reynolds Number formula.

At standard sea-level conditions – Acceleration of gravity = 9.81 m/s[11] [12]

Atmospheric pressure = 101.3 kN/m2, or 1013 mb, or 760mmHg Density of air = 1.225 kg/m[13] [14] at 1013 mb and 288°K Speed of sound = 340 m/s = 661 knots = 1225 km/h Dynamic viscosity of air (//) = 17.894 X 1026kg/ms For low altitudes one millibar change in pressure is equivalent to 30 feet change in altitude.

International standard atmosphere as in Fig. 2.2.

[1] m in 5 seconds, then the power is 20 Nm (20 joules) in 5 seconds, or 4 joules per second. A joule per second (J/s) is called a watt (W), the unit of power. So the power used in this example is 4 watts. Readers who have studied electricity will already be familiar with the watt as a unit of electrical power; this is just one example of the general trend towards the realisation that all branches of science are inter-related. Note the importance of the time taken, i. e. of the rate at which the work is done; the word power or powerful, is apt to give an impression of size and brute force. The unit of 1 watt is small for practical use, and kilowatts are more often used. The old unit of a horse-power was never very satisfactory but, as a matter of interest, it was the equivalent of 745.7 watts (Fig. IB).

A body is said to have energy if it has the ability to do work, and the amount of energy is reckoned by the amount of work that it can do. The units of energy will therefore be the same as those of work. We know that petrol can do work by driving a car or an aeroplane, a man can do work by propelling a bicycle or even by walking, a chemical battery can drive an electric motor which can do work on a train, an explosive can drive a shell at high speed from the muzzle of a gun. All this means that energy can exist in many forms,

These three terms are used frequently in mechanics, so we must understand their meaning. This is especially important because they are common words too in ordinary conversation, but with rather different shades of meaning.

A force is said to do work on a body when it moves the body in the direc­tion in which it is acting, and the amount of work done is measured by the product of the force and the distance moved in the direction of the force. Thus if a force of 10 newtons moves a body 2 m (along its line of action), it does 20 newton metres (Nm) of work. A newton metre, the unit of work, is called a joule (J). Notice that, according to mechanics, you do no work at all if you push something without succeeding in moving it – no matter how hard you push or for how long you push. Notice that you do no work if the body moves in the opposite direction, or even at right angles to the direction in which you push. Someone else must be doing some pushing – and some work!

Power is simply the rate of doing work. If the force of 10 N moves the body

Scale effect and Reynolds Number

This appendix is an amplification of a short note given about scale effect in Chapter 2. From the earliest days of the science of flight, even before any aero­plane had actually flown, people experimented with small models. The problem is how do we relate the behaviour of the model and the aerodynamic forces that are exerted on it to a full-size aircraft? We know that if we can measure, say, the lift force on a small model, we can work out its lift coeffi­cient using L = 2pv2SCL, and from this we can calculate the lift on the full-size aircraft at any speed. However, we do not always get quite the correct answer, and sometimes we get an answer that is completely wrong. Is there something else that we should be doing? The clue to this was found by Osborne Reynolds some 150 years ago. Reynolds was not interested in aircraft aerodynamics but in the flow of liquids. In particular, he was interested in the conditions that determined whether the flow of water in a pipe was smooth and layered (laminar), which is normally associated with low-speed flow, or turbulent, which is associated with higher-speed flow. What he discovered was that the speed of flow at which the change or transition occurred depended on the value of the quantity:

which is now called a Reynolds Number.

A

In this quantity, p is the density of the fluid (water in his case) v is the flow speed l is the diameter of the pipe p is the viscosity of the fluid

For the problem of flow in pipes it was found that the transition from one type of flow to the other occurred at a critical value of around 2300. It was discov­ered that this critical value held regardless of the size of the pipe and what type of fluid was used; it even works for gases. So what does the flow of water have to do with model testing of aircraft? Well, we find that if we test our model at

the same Reynolds Number as the full scale aircraft, then it will behave in the same way. For example its wing will stall at exactly the same angle of attack, and full-scale forces calculated using the lift and drag coefficients will be correct. Of course for aircraft there is no pipe diameter involved, so for the quantity /, we have to use some other characteristic length. This leads to some confusion, because different characteristic lengths have to be used for different types of model. For a wing section, the wing chord is normally used as the characteristic length, but a missile may not have a wing, so in this case we would probably use the overall missile length. It does not actually matter which length we use, as long as we are consistent between model and full-size. It is also important to say exactly what dimension one is using. All too often Reynolds Number values are quoted without this important piece of infor­mation. For the testing of a low-speed aircraft then, apparently, all we have to do is to ensure that the Reynolds Number of the model test is the same as that of the flight conditions that we are going to simulate. For example, consider an aircraft as below, flying at sea level

Flight speed v = 30 m/s

Wing chord = 2 m

If we want to test a l/10th scale model under the same sea level conditions, then the Reynolds Numbers must be the same so the speed v that we must test the model at is found from

pv X 2/10 = p 3 0X2

p p

After cancelling out the density and viscosity terms (which for this special case are the same for both model and full scale) we find that the required model test speed v is 300 m/s. This result is both surprising and unfortunate. The model actually needs to fly ten times faster than the real aircraft in order to correctly simulate the flight conditions. This is normally impractical, especially for faster aircraft, because the model would have to be flying at speeds where compressibility would totally change the flow.

We do not, of course, normally fly our models around the room; we put them in a wind tunnel and let the air flow past them. However, this does not immediately solve the problem that the relative air flow speed past a l/»th scale model would need to be n times as fast as the full-scale aircraft. In the example above, this would mean a tunnel speed of 300 m/s, which would not only require a very strong tunnel and a huge amount of power to drive it, but would also mean that the effects of compressibility would be important. One solution is to make the tunnel very strong indeed and raise the air pressure inside. This has the effect of increasing the density, and, as will be seen from the Reynolds Number expression above, if the density is raised, then the speed can be lowered in the same proportion. Fortunately, modern large aircraft mostly cruise at very high altitude, where the density is low, so this also reduces the speed required for the model. Unfortunately, large compressed air wind tunnels are extremely expensive both to build and to run, and for this reason there are very few of them in the world; indeed the number is if any­thing reducing now. Making the tunnel smaller does not help, because the smaller the model, the greater the speed required. One way to overcome the problem of tunnel size is to test small critical parts of aircraft such as a wing section at large scale in a relatively small compressed air tunnel.

Compressed air tunnels do not unfortunately solve all the problems of sim­ilarity because nowadays all but light and a few specialist aircraft need to fly in the transonic region at speeds approaching the speed of sound, and fast military aircraft have to fly supersonically. Under these conditions, getting the Reynolds Number correct is less important than getting the right condition for similarity of compressibility effects. The latter entails getting the same Mach Number on the model and the full-scale aircraft. Mach Number is given simply by the ratio (speed/speed of sound). The speed of sound depends only on the square root of the absolute temperature of the air. The difference between the sea level absolute temperature on a really hot day and the tem­perature in the upper atmosphere is only a ratio of about 2:3, so broadly speaking, for compressible flows, matching of Mach Numbers requires us to run the tunnel air at a speed that is quite similar to that of the full-size aircraft. Notice that the size of the model does not come into this.

Trying to match both the Mach Numbers and the Reynolds numbers at the same time is very difficult. The most practical solution has been the adoption of the cryogenic tunnel, which is a variation of the compressed air tunnel, in which the air is cooled by injecting liquid nitrogen. Cooling affects the speed of sound (and hence the Mach Number), the density and the viscosity coeffi­cient (and hence the Reynolds Number). By suitably juggling the pressure, temperature and speed, it is possible to get a simultaneous match for both the Reynolds and Mach numbers. Such tunnels are extremely expensive to con­struct and to run, and only a few exist in the entire world.

Needless to say, not all wind tunnel testing is carried out in such facilities. For practical purposes, we can still make reasonably accurate predictions by use of compromises. It is fortunate that matching the Reynolds Numbers is most important for very low-speed flight, so we can still make useful measure­ments in low-speed (about 30 to 100 m/s) wind tunnels.

The mismatch in Reynolds Number is particularly significant when it comes to the behaviour of the boundary layers. The position of transition from laminar to turbulent flow and the point at which the flow separates is strongly related to the value of the Reynolds Number, so we can expect reasonably good results if we are testing in situations where these two factors are not likely to be critical. However, when investigating stall behaviour, for example, we may need to use a large higher speed tunnel or rely more on full-scale testing.

In high flight speeds it is the matching of Mach Numbers that is important. Thus for high-speed flight, we use specially designed transonic or supersonic tunnels where we can match the Mach Numbers, but normally have to ignore the Reynolds Number. The expensive cryogenic tunnels are used only where highly accurate work is required on a major airliner or military aircraft. All of this might seem a little baffling, and indeed it requires a great deal of experi­ence and knowledge to achieve really reliable wind tunnel results.

I am frequently asked what is the speed at which you should test a model to simulate a given full-scale speed. The answer, as you may see from the above, is that it is the speed at which the Reynolds and Mach numbers are both simultaneously the same as they would be if full scale. As we have also seen above, though, this is not normally practical unless you have a very large research budget. In practice, the answer normally is to test as fast as your tunnel will allow. The precise speed of the test is not really important, because we can determine the full-scale lift and drag etc. by using the relationships L= 2 pv2SCL and D = 2pv2SCD The wind-tunnel data allow us to work out the lift and drag coefficients, and these can then be used to determine the values of lift and drag that would be obtained at full-scale size air density and speed. We just have to hope that the effects of Reynolds Numbers, are small.

Apart from the problems of trying to match Reynolds and Mach numbers, wind tunnels have some other drawbacks. These mainly arise from the fact that the air is constrained by the tunnel walls and cannot behave exactly as it would if there were no boundary. For example, the model forms partial blockage in the tunnel and thus it causes the flow to speed up in its proximity, thereby giving misleadingly high loads. Explaining the details of these effects is well beyond the scope of this book. What is normally done, however, is that some theoretically based corrections have to be applied. Whole books and many scientific papers have been written in the subject of wind tunnel correc­tions, and the science is still developing.

With all the difficulties and expense involved in wind tunnel testing it is not surprising that people have sought to find ways around it. Increasing use is now being made of computer modelling or computational fluid dynamics (CFD). After many years of development, CFD can now provide accurate pre­dictions for many aspects of aircraft aerodynamics, but it is not such a cheap or quick solution as might have been hoped for. Also, CFD is not yet reliable for situations where important flow separations occur; it can be quite poor at predicting the drag forces from areas and components where the flow is not streamlined. At the time of writing, both wind tunnel testing and CFD are used, and there is no indication that wind tunnels are about to disappear. Experience shows that there are situations, such as in the behaviour of boundary layers, where wind tunnels work best, and others where computa­tional methods are more appropriate. Finally, it should be mentioned that with modern telemetry and remote guidance systems it is possible to do some useful testing using flying scale models. Apart from the use of radio controlled models, there is a whole new area of testing which involves making piloted scale models, usually with relatively cheap composite material airframes.

Aerofoil data

The aerofoil sections, of which particulars are given in the following pages, have been chosen from among the thousands that have been tested, as being typical of the best that have been designed for particular purposes.

Although the values have been taken from standard tests, they have been modified so as to bring them as far as possible into line with each other, and simplified so as to correspond with the symbols and methods used in this book. In thus modifying the figures the aim has been to bring out the principles even at the sacrifice of some degree of accuracy. For the purpose of this book nothing is lost by this simplification and, while it is right and proper that official results should be given to the accuracy with which they can be measured, the student should remember that they are, after all, taken from experimental figures and that there is a limit not only to the accuracy of such figures, but even more so to the various corrections that have to be applied to them.

Unfortunately it is not possible to obtain results for all the sections at the same Reynolds Number, but for each the approximate Reynolds Number of the test has been given, and where alternative results are available those at the highest Reynolds’ Number have been chosen.

For reasons of security it is not possible to give test results for the most modern high-speed sections; but, even if they could be given, it is doubtful whether the tests would have been made at sufficiently high Mach Numbers and Reynolds Numbers to be reliable as a guide to full-scale performance. There is no difficulty in getting lift from bi-convex or double-wedge sections used at supersonic speeds, the problem is to keep down the drag.

For the benefit of those readers who would like to sketch out the shapes of the various aerofoil sections, the co-ordinates of the upper and lower surfaces are given; the measurements are expressed as percentages of the chord, nega­tive values being below the chord line and positive values above it.

The tables give values of CL and CD at various angles of attack – from nega­tive angles to above the stalling angle – but unfortunately values of CD are not available for aerofoils with flaps down (except for No. 8, the model of the Tightning). When a dash appears in the data columns it means that the figure

is not available, or that for some reason it would be meaningless. Pitching moments are given about the leading edge, or about the quarter-chord, or about the aerodynamic centre; and an opportunity is given in the short ques­tions that follow the data for the reader to work out one from the other. Similarly the position of the centre of pressure can be found from other data, the lift/drag ratio from C£ and CD, and so on.

Most of the questions can be answered from the information given in Chapter 3, but the student may require a little guidance on the questions dealing with moment coefficients and centres of pressure, especially since the simplest method of reaching some of the answers is through the notation of differential calculus which has not been used in the text of the book.

For instance, to solve question (c) for RAF 15 (without slot):

In Chapter 3 when discussing the aerodynamic centre we arrived at the equation –

x/c = (CM. AC – Cm. le)/Cl (!)

or

CM. AC = CM. LE + Ш ■ CL (2)

By differentiating (2) with respect to CL we get the differential equation –

^^M. Ac/^L ~ ^M. LE^^L X^C (3)

But, by definition, the moment coefficient about the aerodynamic centre does not change with the angle of attack (or with the lift coefficient), or expressed in mathematical terms –

dCu. AC/dCL = 0

Therefore

x/c = – dCMLE/dCL (4)

By drawing a graph of CM LE against CL we can determine the slope of the curve, i. e. dCMLE/dCL for any value of CL, and so for any angle of attack. Thus we can get x/c from (4), and substitute in (2) to get CMAC. To solve question (c) for RAF 15 (with slot), we must first find CML£ from another formula in Chapter 3 –

CP position = —CML£/CL (5)

and then use the same method, as outlined above, to find CMAC. The same method can be used to solve questions (a) and (b) on the Clark YH aerofoil; and for questions (b) and (c) on NACA 0009 we can start from –

x’ = CMCI4/CL as in (5) above.

Finally it should be noted that formulae (1) and (2) are approximations based on the assumption that the angle of attack is small. The answers given in Appendix 4 have been arrived at by using these simplified formulae.

The more refined formula for (2) is –

CMAC = CMLE + x/c (CL cos a + CD sin a)

and the student is advised to work out one or two of the examples at the larger angles of attack with this formula, if only to confirm that the use of the sim­plified formula is justified – at any rate for the angles of attack of normal flight.

When differentiating the full formula, it must be remembered that cos a, CD and sin a all vary with CL and so the appropriate mathematical techniques must be used; these involve drawing graphs of cos a, CD and sin a against CL, in order to determine d cos a ldCL, dCD/dCL and d sin a ldCL.

More extensive questions on aerofoils will be found in Appendix 3.

1. RAF 15 *1A. RAF 15 with slot

Aerofoil data

Chord line

Tike Clark Y, used on many early types of aircraft.

Figures relate to aspect ratio of 6.

Reynolds Number of test 3.5 million; with slot 200 000.

Slot assumed to remain open at position giving maximum lift.

(a) What is the max. value of LID with slot? without slot?

(b) What is the stalling angle with slot? without slot?

(c) What is the value of CMAC at +4° with slot? without slot?

(d) What is the value of CLmax/CDmin with slot? without slot?

(e) What is the value of CL^/CD (without slot) at 4° and 8°?

Distance from LE, % chord

Upper surface

Lower surface

0

1.50

1.50

1.25

3.14

0.76

2.5

3.94

0.50

5

5.00

0.18

7.5

5.37

0.02

10

6.09

0.02

15

6.67

0.18

20

6.96

0.53

30

6.94

1.02

40

6.63

1.02

50

6.13

0.71

60

5.52

0.33

70

4.79

0.06

80

3.91

0.04

90

2.81

0.21

95

2.17

0.32

100

0.94

0.94

Angle of attack

cL

cD

r

^M. LE

*CL

*cD

,fCP, fraction of chord

-4°

-0.14

0.014

-0.036

-0.27

0.120

22°

+ 0.02

0.008

-0.052

-0.12

0.075

0.14

0.008

-0.090

+0.03

0.056

+2°

0.32

0.012

-0.130

+0.18

0.050

0.70

+4°

0.46

0.020

-0.160

0.33

0.050

0.45

0.60

0.030

-0.200

0.47

0.053

0.39

0.76

0.044

-0.240

0.62

0.060

0.37

10°

0.90

0.060

-0.280

0.76

0.070

0.36

12°

1.04

0.070

-0.310

0.90

0.080

0.34

14°

1.16

0.096

-0.330

1.05

0.100

0.32

15°

1.22

0.110

-0.340

1.12

0.110

0.31

16°

1.16

0.140

-0.350

1.21

0.120

0.31

18°

1.02

0.210

-0.384

1.36

0.148

0.30

20°

0.94

0.260

-0.390

1.51

0.175

0.30

24°

1.70

0.234

0.30

26°

1.76

0.270

0.30

28°

1.76

0.304

0.30

30°

1.64

0.344

34°

1.30

0.430

2. Clark YH

Chord

line

Excellent American general purpose aerofoil.

Modifications of Clark Y have been used on many types of aircraft all over the world; Clark YH was one of the first of these modifications.

Figures relate to aspect ratio of 6, and standard roughness.

Reynolds Number of test 7 million.

Distance from LE, % chord

Upper surface

Lower surface

0

3.50

3.50

1.25

5.45

1.93

2.5

6.50

1.47

5

7.90

0.93

7.5

8.85

0.63

10

9.60

0.42

15

10.68

0.15

20

11.36

0.03

30

11.70

0

40

11.40

0

50

10.51

0

60

9.15

0

70

7.42

0.06

80

5.62

0.38

90

3.84

1.02

95

2.93

1.40

100

2.05

1.85

Angle of attack

cL

cD

CP, fraction of chord

r

^M. LE

L/D

24°

+0.09

0.010

+0.030

-10

22°

+0.05

0.009

0.74

-0.010

+ 5.2

0.20

0.010

0.40

-0.046

19.3

0.36

0.015

0.32

-0.072

23.2

0.51

0.022

0.295

-0.116

23

0.66

0.033

0.285

-0.150

20.6

0.80

0.045

0.275

-0.184

17.7

10°

0.94

0.062

0.27

-0.220

15.2

12°

1.06

0.083

0.27

-0.244

13.3

14°

1.21

0.103

0.27

-0.276

11.8

16°

1.33

0.125

0.265

-0.320

11

18°

1.43

0.146

0.265

-0.352

9.9

19°

1.36

0.170

0.275

-0.356

8

20°

1.26

0.211

0.29

-0.354

7

25°

0.97

0.324

0.33

-0.354

2.9

30°

0.81

0.430

0.37

-0.352

1.9

(a) What is CMAC at 0°, 4° and 8° for this aerofoil?

(b) Where is the aerodynamic centre of this aerofoil section?

(c) What is the stalling angle?

(d) What is the value of CLmax/CD min?

(e) What is the value of CL^/CD at 4° and 8°?

*3A. NACA 0009 with flap

Aerofoil data

A thin symmetrical section.

All figures relate to standard roughness.

Reynolds Number of test 6 million.

Position of aerodynamic centre 0.25 of chord from LE. *With 20 per cent split flap set at 60°.

Distance from LE, % chord

Upper and lower surfaces % chord

0

0

1.25

1.42

2.5

1.96

5.0

2.67

7.5

3.15

10

3.51

15

4.01

20

4.31

30

4.50

40

4.35

50

3.98

60

3.50

70

2.75

80

1.97

90

1.09

95

0.61

100

0

Angle of attack

cL

cD

r

Ч1С/4

*cL

4lC/4

28°

-0.88

0.022

0

+0.45

-0.200

26°

-0.65

0.014

0

+0.68

-0.210

24°

-0.45

0.011

0

+0.90

-0.216

22°

-0.21

0.010

0

+ 1.09

-0.220

0

0.009

0

+ 1.29

-0.216

+2°

+0.21

0.010

0

+ 1.38

-0.218

+0.43

0.011

0

+ 1.65

-0.222

+0.64

0.014

0

+ 1.78

-0.225

+0.85

0.018

0

+ 1.72

-0.230

10°

+0.90

0.021

-0.002

+ 1.58

-0.275

12°

+0.89

0.028

-0.004

14°

+0.87

0.036

-0.012

(a) What is the value of CMAC (without flap)?

Is it the same at all angles, as it should be?

(b) What is the position of the CP (without flap) at +4°?

(c) What is the position of the CP (with flap) at +4°?

(d) What is the value of LID (without flap) at 2°, 6°, 10°?

(e) What is the stalling angle (i) without flap? (ii) with flap?

Подпись: Chojxl line
Aerofoil data

*4A. NACA 4412 with flap

Medium thickness NACA 4-digit good all round section. All figures relate to standard roughness.

Reynolds Number of test 6 million.

Position of aerodynamic centre 0.246 of chord from LE. *With 20 per cent split flap set at 60°.

Distance from LE, % chord

Upper surface

Lower surface

0

0

0

1.25

2.44

-1.43

2.5

3.39

-1.95

5.0

4.73

-2.49

7.5

5.76

-2.74

10

6.59

-2.86

15

7.89

-2.88

20

8.80

-2.74

25

9.41

-2.50

30

9.76

-2.26

40

9.80

-1.80

50

9.19

-1.40

60

8.14

-1.00

70

6.69

-0.65

80

4.89

-0.39

90

2.71

-0.22

95

1.47

-0.16

100

0

0

Angle of attack

cL

cD

r

^M. AC

*cL

4lC/4

-8°

-0.45

0.022

-0.097

+0.90

-0.287

-6°

-0.23

0.014

-0.092

+ 1.12

-0.297

-4°

-0.03

0.012

-0.092

+ 1.34

-0.302

-2°

+0.20

0.010

-0.092

+ 1.56

-0.305

+0.38

0.010

-0.093

+ 1.75

-0.305

+2°

+0.60

0.010

-0.095

+ 1.95

-0.305

+0.80

0.012

-0.098

+2.14

-0.305

+ 1.00

0.014

-0.100

+2.43

-0.302

+ 1.15

0.017

-0.100

+2.50

-0.300

10°

+ 1.27

0.022

-0.095

+2.65

-0.290

12°

+ 1.36

0.030

-0.092

+2.63

-0.275

14°

+ 1.35

0.042

-0.092

16°

+ 1.25

0.059

-0.095

(a) What is the value of CMC/4 (without flap) at 0° and 8°?

(b) Where is the CP (without flap) at these angles?

(c) What is the value of LID (without flap) at these angles?

(d) What is the stalling angle (i) without flap? (ii) with 60° flap?

(e) What is the value of CLmax/CD min (without flap)?

Aerofoil data

Medium thickness 5-digit section that has been much used. Low drag; maximum camber well forward.

All figures relate to standard roughness.

Reynolds Number of test 6 million.

Position of aerodynamic centre 0.241 of chord from LE.

Distance from LE, % chord

Upper surface

Lower surface

0

0

0

1.25

2.67

-1.23

2.5

3.61

-1.71

5.0

4.91

-2.26

7.5

5.80

-2.61

10

6.43

-2.92

15

7.19

-3.50

20

7.50

-3.97

25

7.60

-4.28

30

7.55

-4.46

40

7.14

-4.48

50

6.41

-4.17

60

5.47

-3.67

70

4.36

-3.00

80

3.08

-2.16

90

1.68

-1.23

95

0.92

-0.70

100

0

0

Angle of attack

cL

cD

r

Ч1С/4

r

^M. AC

-8°

-0.60

0.020

-0.018

-0.013

-6°

-0.43

0.014

-0.015

-0.013

-4°

-0.25

0.011

-0.013

-0.014

-2°

-0.08

0.010

-0.013

-0.016

+0.15

0.010

-0.012

-0.016

+2°

+0.36

0.010

-0.010

-0.015

+0.55

0.011

-0.008

-0.014

+0.75

0.013

-0.010

-0.014

+0.96

0.016

-0.013

-0.016

10°

+ 1.14

0.023

-0.014

-0.017

12°

+ 1.23

0.032

-0.012

-0.017

14°

+0.82

0.045

-0.013

16°

+0.77

0.065

-0.050

(a) What is the value of LID for this aerofoil at 0°, 4°, 8°?

(b) Where is the CP at these angles?

(c) Where is the maximum thickness?

(d) What is the stalling angle?

(e) What is the value of CL^/CD at 2°, 4° and 6°?

Aerofoil data

Typical thick 5-digit section of the 230 series.

All figures relate to standard roughness.

Reynolds Number of test 6 million.

Position of aerodynamic centre 0.241 of chord from LE.

Distance from LE, % chord

Upper surface

Lower surface

0

0

0

1.25

4.09

-1.83

2.5

5.29

-2.71

5.0

6.92

-3.80

7.5

8.01

-4.60

10

8.83

-5.22

15

9.86

-6.18

20

10.36

-6.86

25

10.56

-7.27

30

10.55

-7.47

40

10.04

-7.37

50

9.05

-6.81

60

7.75

-5.94

70

6.18

-4.82

80

4.40

-3.48

90

2.39

-1.94

95

1.32

-1.09

100

0

0

Angle of attack

cL

cD

r

Ч1С/4

r

^M. AC

-8°

-0.62

0.016

-0.018

-0.008

-6°

-0.47

0.014

-0.010

-0.007

-4°

-0.28

0.012

-0.008

-0.007

-2°

-0.09

0.011

-0.005

-0.007

+0.12

0.010

-0.002

-0.007

+2°

+0.33

0.011

-0.001

-0.007

+0.53

0.012

0

-0.007

+0.72

0.014

+0.002

-0.007

+0.90

0.016

+0.003

-0.007

10°

+ 1.01

0.020

+0.004

-0.008

12°

+ 1.06

0.028

+0.005

-0.008

14°

+0.75

0.040

+0.002

16°

+0.68

0.060

-0.020

(a) What is the maximum thickness? Where is it?

(,b) What is the value of LID at -4°, 0°, 4°, 8°, 12°?

(c) Where is the CP on this aerofoil at 2°, 4° and 6°?

(d) What is the stalling angle?

(e) What is the maximum lift coefficient?

*7A. NACA 65,-212 with flap

Aerofoil data

Typical of the NACA 6 series; medium thickness.

All figures relate to standard roughness.

Reynolds Number of test 6 million.

Position of aerodynamic centre 0.259 of chord from LE. *With 20 per cent split flap set at 60°.

Distance from LE, % chord

Upper surface

Lower surface

0

0

0

0.5

0.970

-0.870

0.75

1.176

-1.036

1.25

1.491

-1.277

2.50

2.058

-1.686

5.00

2.919

-2.287

7.5

3.593

-2.745

10

4.162

-3.128

15

5.073

-3.727

20

5.770

-4.178

25

6.300

-4.510

30

6.687

-4.743

35

6.942

-4.882

40

7.068

-4.926

45

7.044

-4.854

50

6.860

-4.654

55

6.507

-4.317

60

6.014

-3.872

65

5.411

-3.351

70

4.715

-2.771

75

3.954

-2.164

80

3.140

-1.548

85

2.302

-0.956

90

1.463

-0.429

95

0.672

-0.040

100

0

0

Angle of attack

cL

cD

r

Ч1С/4

*cL

4lC/4

-8°

-0.68

0.020

-0.025

+0.58

-0.223

-6°

-0.50

0.015

-0.026

+0.80

-0.230

-4°

-0.33

0.013

-0.030

+ 1.03

-0.240

-2°

-0.10

0.010

-0.033

+ 1.25

-0.250

+0.12

0.009

-0.035

+ 1.45

-0.260

+2°

+0.35

0.010

-0.037

+ 1.63

-0.265

+0.55

0.011

-0.038

+ 1.80

-0.267

+0.80

0.015

-0.039

+ 1.87

-0.264

+0.95

0.023

-0.040

+ 1.83

-0.260

10°

+ 1.07

0.035

-0.040

+ 1.70

-0.255

12°

+ 1.06

0.050

-0.038

+ 1.48

-0.380

14°

+ 1.01

-0.035

(a) What is Смлс? Is it the same at all angles, as it should be?

(b) Where is the maximum thickness?

(c) What is the stalling angle (i) without flap? (ii) with 60° flap?

(d) What is the maximum value of L/D?

(e) What is the value of CLmax/CDmin (without flap)?

8. English Electric ASN/P1/3 *8A. English Electric ASN/P 1/3 with flap

Aerofoil data

This is the symmetrical aerofoil section used on the ВАС Mach 2+ Lightning. The wing was tapered and the ordinates relate to a section at 38.5 per cent of semi-span.

Reynolds Number of test 1.5 million (based on mean chord).

The values of coefficients refer to a complete model of the aircraft, not to the wing section alone.

The Lightning was a mid-wing monoplane with 60° sweepback on leading edge (see Fig. 11B).

*Model with approx 25 per cent plain flaps set at 50°.

Distance from LE, % chord

Upper and lower surfaces % chord

0

0

0.25

0.426

0.75

0.706

1.25

0.875

2.50

1.175

5.00

1.530

10

1.941

15

2.183

20

2.435

25

2.612

30

2.782

35

2.904

40

2.944

45

2.970

50

2.942

55

2.855

60

2.703

65

2.502

70

2.237

75

1.921

80

1.564

85

1.183

90

0.797

95

0.414

100

0.032

The values of CM are related to a point at 0.405 of mean chord. The position of the aerodynamic centre = 0.405 + dCM/dCL. The figures for the Tightning were given by courtesy of the former British Aircraft Corporation, Preston.

(a) What is the thickness/chord ratio of this aerofoil?

(b) Where is the maximum thickness?

(c) What is the stalling angle of the aircraft model: (i) with flaps up? (ii) with flaps down?

(d) What are the values of LID of the model at 4°, 12° and 20°: (i) with flaps up? (ii) with flaps down?

(e) What are the positions of the aerodynamic centre of the clean aircraft at 4°, 12° and 20°?

(Note: The answers involve the drawing of the curve of CM against CL and measuring the slopes of this curve at the specific angles.)

Data for ВАС Lightning model – clean aircraft

Angle of attack

cL

cD

0

0.020

-0.017

0.08

0.020

-0.013

0.17

0.030

-0.008

0.27

0.040

-0.006

0.38

0.050

+0.005

10°

0.50

0.075

+0.010

12°

0.61

0.105

+0.016

14°

0.71

0.140

+0.026

16°

0.81

0.180

+0.040

18°

0.91

0.225

+0.055

20°

1.00

0.275

+0.070

22°

1.09

0.335

+0.088

24°

1.17

0.405

+0.108

26°

1.22

0.480

+0.124

28°

1.26

0.560

+0.132

30°

1.27

0.650

+0.140

Data for ВАС Lightning model

– flaps at 50°

Angle of attack CL

cD

0.17

0.07

-0.072

0.27

0.07

-0.068

0.37

0.08

-0.062

0.47

0.09

-0.060

0.57

0.11

-0.053

10°

0.67

0.13

-0.040

12°

0.78

0.16

-0.032

14°

0.88

0.20

-0.025

16°

0.98

0.25

-0.015

18°

1.07

0.31

+0.005

20°

1.15

0.37

+0.013

22°

1.22

0.43

+0.020

24°

1.27

0.50

+0.037

26°

1.27

0.55

+0.045

28°

1.22

0.59

+0.074

30°

1.16

0.63

+0.074

Sub-orbital flight – the aeroplane – missile – satellite

Have you ever realised that the ‘lift’ required to keep an aeroplane in the air depends upon the direction in which it is travelling? – e. g. whether it is going with the earth or against it. In an earlier paragraph we worked out the cen­tripetal force on a body of mass 1 kg sitting on the earth’s surface at the equator – sitting still, as it seems, but in fact behaving like a stone travelling at 1690km/h on the end of a string of 6370 km radius. The answer didn’t come to much – about 0.018 N – but the principle is of extreme importance.

The corresponding value for an aeroplane of mass 10190 kg is about 400 N, still not much perhaps, but none the less an appreciable and measur­able quantity. It means that if the real force of gravity on the aeroplane is

Sub-orbital flight - the aeroplane - missile - satellite

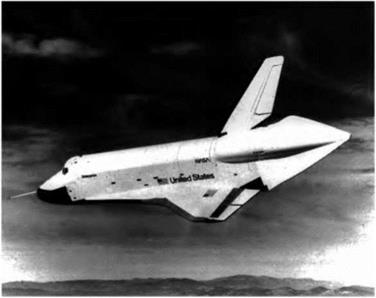
Fig 13E The Space Shuttle (By courtesy of NASA)

100 000 N, it would appear to weigh only 99 600 N – in fact, of course, we would call this the weight, it is the force we would have to exert to lift it.

But it is a solemn thought, though none the less a fact, that if this aeroplane were to fly against the direction of the earth’s rotation, i. e. towards the west, at 1690 km/h, it would not require this centripetal force, and so would appear to weigh 100 000 N – and that is the lift the wings would have to provide. If, on the other hand, it flew towards the east at 1690km/h, its real speed would be 3380 km/h, and the centrifugal force would be, no, not 800 N but 4 X 400,

i. e. 1600 N (because the centripetal force depends on the square of the vel­ocity), so the lift that the wings would have to provide would be 100 000 — 1600 = 98 400 N.

Similarly at a real speed of 6760km/h (5070 km/h eastwards) the cen­tripetal force would be 6400 N, and the necessary lift 93 600 N. At 12 800 km/h (11 200 km/h eastwards), the corresponding figures would be 25 600 N and 74 400 N; and at 25 600 km/h, 102 400 N and minus 2400 N! At approximately 29 000 km/h the centripetal force is 100 000 N and the lift required nil.

What does it all mean? Well, the reader who has followed the arguments in this chapter will surely know what it means – simply that the aeroplane trav­elling at 29 000 km/h near the earth’s surface is travelling at the circular velocity, it doesn’t need any lift from the wings, it will stay up of its own accord, it is a satellite. Nor when these velocities are reached does it make all that difference (only 1600 km/h each way) whether it travels east or west.

What it will need is colossal thrust to equal the colossal drag, which in any case will cause it to frizzle up.

But what if it flies higher – and higher – and higher? The drag for the same real speed will be less, less thrust will be needed, the circular velocity required for no lift conditions will be less, even the real force of gravity upon it will be less; it won’t even create a sonic boom at ground level.

Can you answer these?

Now let us see what we know about this fascinating subject –

1. What is meant by escape velocity? What is its approximate value for the earth? Is it the same for the moon?

2. Is the escape velocity the same for a horizontal launch as for a vertical launch?

3. Distinguish between the perigee and the apogee in an elliptical orbit.

4. What is the particular significance of a satellite circling the earth at about 35 400 km from the centre of the earth?

5. What is the time of circular orbit of –

(a) a satellite very near the earth’s surface?

(b) a satellite 1600 km from the earth’s surface?

(c) the moon?

6. Under what conditions is the path of a satellite parabolic? hyperbolic? For solutions see Appendix 5.

For numerical examples on missiles and satellites see Appendix 3.

Flights in space

We could go on to discuss orbits round the sun and the possibility of flights to and round the various planets. It is a fascinating subject, and becomes more

and more so as the possibilities become practicabilities and then historical facts. But the principles of all such flights are the same as those we have men­tioned, and the author must avoid the temptation of going any further into space. The reader who is as fascinated with the subject as is the author – and who, if he is interested in the mechanics of flight at all, is not? – must seek other books, though admittedly it is not easy to find books that are at the same time reasonably simple and reasonably sensible.

Re-entry into the atmosphere

On the Apollo missions, the craft re-entered the atmosphere after at least a partial orbit, and after discarding the larger part of what still remained of the spacecraft leaving only the small command module, a mere 5 tonnes of the 3500 tonnes or more of the mass at launch. From re-entry to splashdown was one of the most difficult, and in some ways the crudest part of the whole pro­cedure. Once again extreme accuracy was needed because the craft, by final

Re-entry into the atmosphere

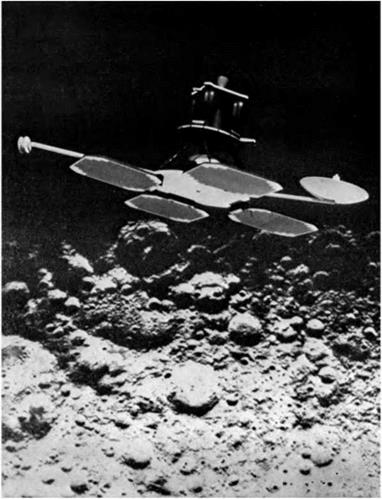
Fig 13C Orbiting the moon

(By courtesy of the Boeing Company, USA)

Scale model of a lunar orbiter; the lunar landscape (taken by Lunar Orbiter 1 on the far side of the moon) is authentic, and shows the sharp break between sunshine and shadow

use of the rocket power still available, must enter the atmosphere, at some 400 000 feet, through a ‘window’, as it is called, only 8 kilometres wide, and at an angle of between 5.6° and 7.2° to the top of the atmosphere – if it entered too steeply it would have burned up, if too shallowly it would have bounced off again. Not only is the angle of entry very critical, but the craft also had to be manoeuvred into such a position that it encountered maximum drag (from drag rather than skin friction) and so maximum retardation of about 6 g. Even

Re-entry into the atmosphere

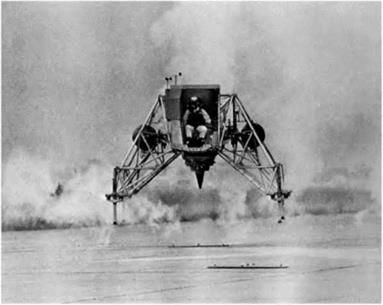
Fig 13D Moon landing craft

(By courtesy of the Bell Aerospace Division of Textron Inc, USA) Astronaut Charles Conrad Jr in a lunar landing training vehicle during a simulation flight for the Apollo 12 mission

so, the speed was so high, and the skin friction so great, that the heat gener­ated was quite alarming, the surface of the craft was burnt and scarred, and the air ionised so that radio communication between the earth and the crew was temporarily interrupted. When denser air was reached, first a drogue parachute was released, followed by at least three large parachutes, and these reduced the velocity sufficiently for any surplus fuel to be jettisoned, and finally for a reasonably soft splash-down in the sea, again with reasonable accuracy of position.

In view of the crudeness of this method of approach and landing it is not surprising that a reusable vehicle, the Space Shuttle, was developed (Fig. 13E). This has the same problems – it gets hot and needs to slow down for landing. But using wings gives another way of controlling the trajectory and means that it can land on a runway. It is really a glider – albeit an unusual one!

The return flight

The moon lift-off, by another burst of rocket power, is again made just that much easier than from earth owing to the reduction in the mass of the space­ship which has thrown off the multi-stage rockets, owing too to the lesser force of gravity, the lack of air resistance, and the lower speed required for orbit; all this is just as well because the rockets that developed the tremendous thrust for lift-off from earth are no longer available, and by now much of the reserve fuel and power has been expended. Even so, a high degree of accuracy is again necessary to ensure that the lunar module gets into orbit close to the command module (though again small adjustments can be made by bursts of power), so that they can again be linked up into one spacecraft. Once they have been re-united and men, films and other souvenirs have been transferred to the command module, the lunar module can itself be discarded, and left to orbit or to hit the moon – this time probably at speed!

The next stage is a further and considerable boost to put what remains of the spacecraft out of moon orbit and on the return path to earth – once more really an elongated elliptical orbit with the apogee this time near the earth. Although this has been described as a considerable boost, the thrust required is nothing like so great as was needed to start the craft on its journey to the moon because the neutral point is now comparatively near, and once this has been passed the earth’s attraction will all the time be increasing, as will the speed of the space-ship until it reaches something of the order of 10.46 km/s (more than 37 000 km/h), the speed with which it started on its journey.

Now another reverse burst is needed to slow the craft down to approxi­mately 7.5 km/s for a similar circular orbit, or partial orbit, and in the same direction too as that used after launch.

Orbiting the moon

In order to understand this we must consider how the moon differs from the earth. It is, of course, much smaller, its diameter (3490 km) being rather more than 1/4 that of the earth, and its mass, which is more important from the point of view of satellite orbits, about 1/81 that of the earth. The weight of a body on the moon’s surface is about one sixth of its weight on earth – if this puzzles the reader let him work it out, remembering that weight is the force of attraction which is proportional to the two masses multiplied together and inversely proportional to the square of the respective distances, i. e. the radii of the moon and the earth. The acceleration of gravity on the moon is also, of course, about one sixth of that on earth, i. e. just over 1.6 m/s2. But the most interesting difference – and it is the result of the smaller mass of the moon and the lesser weight of bodies near the moon – is that the velocities for moon satellites, circular velocity, escape velocity, etc., are much lower than for earth satellites; the escape velocity at the surface of the moon is only about 2.4 km/s, the circular velocity being 2.4/1.41 or 1.7 km/s. Another important point is that owing to the lack of air resistance it is possible for a satellite to circle the moon very close to its surface.

But if the prospective satellite has been fired to meet the moon, the relative speed between satellite (700 km/h) and moon (3700 km/h) will be much too great, and so, unless the body actually hits the moon, it will merely go past it and escape. Thus, on first thoughts, it would seem that a body fired from the earth cannot become a moon satellite – this is true so long as there is no propulsion in the reverse direction, in other words braking; and the moon has no atmosphere to act as a brake, so the only practical means of persuading a satellite to orbit the moon, under the influence of the moon, is to provide for a rocket to act as a brake on its speed as it gets into the moon’s sphere of influ­ence (Fig. 13.12).

This, in fact, is how the spacecraft is put into orbit round the moon – a burst of power slows it down to the correct speed for the orbit required which, as already explained, can be much nearer the moon’s surface than orbits of the earth (Fig. 13C, overleaf).

Thus far there has been quite a number of flights, manned and otherwise, and there have also been several soft, and some not so soft, landings of craft conveying instruments designed to send messages back to earth; but the actual landing of men on the moon has not been achieved so often that it can be con­sidered as a matter of standard procedure. In the successful attempts so far made a small part of the spacecraft, the lunar module, has been detached at that part of the orbit which, as calculated by computer, will result in a landing at the desired point on the moon’s surface. By a small burst of reverse power the lunar module is again slowed down to bring it closer to the moon, while the command module continues on its circular orbit. As the lunar module ‘falls’ onto the moon, fortunately not so fast as it would onto the earth, but quite fast enough to be uncomfortable, a final reverse rocket thrust is fired to enable the module to land gently on the surface – owing to the lack of air no parachutes, or any kind of air brake, are of avail in controlling the fall (Fig. 13D, overleaf).

Launching a spacecraft

A projectile, whether it is launched for the purpose of escaping from the earth, or landing on the moon, or becoming a satellite, or simply travelling over the earth’s surface to some other place, must first pass through the atmosphere.

Launching a spacecraft

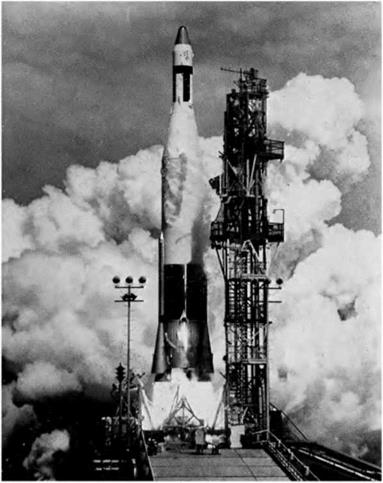
Fig 13B Lift off for the moon

(By courtesy of the General Dynamics Corporation, USA)

The most important effect of this is that we cannot neglect air resistance, as we have so calmly done throughout this chapter (though with constant reminders). And the practical effect of air resistance is to reduce speeds, so the actual speeds of launching within the atmosphere must all be higher than those we have given. How much higher? From ground level, something of the order of 10 or 12 per cent, e. g. if the escape velocity is 40 250 km/h (11.134 km/s), the actual velocity of launch at ground level would have to be about 45 000 km/h (12.5 km/s), and for a circular velocity of 29 000 km/h (8.05 km/s), say 32 000 km/h (8.9 km/s). This naturally makes accuracy more difficult to achieve.

But there is a further difficulty. The launching speed cannot be attained at ground level. As has already been explained, the body on the first part of its flight is propelled by rockets; if it is required to reach great heights by multi­stage rockets. So in contrast with a shell fired from a gun there is time – and distance – in which to gather speed; and by so deciding and regulating the thrust of the rockets in relation to the mass of the projectile, and taking into account the drag due to air resistance, the acceleration can be moderated suf­ficiently to prevent damage to the missile itself and its mechanisms, and if passengers are to be carried, even to human beings. This moderation of the acceleration is of course an advantage, but it also makes it extremely difficult to calculate just what the speed, direction, and height of the vehicle will be when it is finally launched, i. e. when the fuel of the last launching rocket has been exhausted.

No one who has thought of this problem, even in the very elementary form such as we have attempted to explain in this book, can be anything but amazed at the accuracy that has actually been achieved in the launching of spacecraft.

As greater heights are reached there is less density of air, and so the drag decreases in spite of ever-increasing speeds. Eventually the rocket power is shut off, the last stage of the launching rocket is jettisoned, and the projectile, or spacecraft, or whatever it may be, travels on its elliptical path under the force of gravity until it begins to descend and again approaches the earth’s atmos­phere. The distance it travels during this ballistic phase – under its own steam, one might almost say! – will depend on the velocity it had achieved and the direction in which it was travelling when the rocket power ended. It may be hundreds or thousands of kilometres, it could be round the earth and back again, or several times round; there is no fundamental difference between a missile, a satellite and a spacecraft, they differ only in the speed, direction and height of launch.

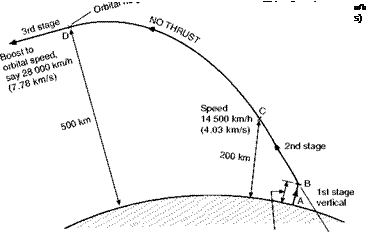
The fact that the final launch takes place at considerable height does, at least, provide partial justification for our earlier neglect of air resistance when considering their motion. It is true that in thinking of launches at a height of 800 km we may have been guilty of going rather far though, as explained at the time, it had the advantage that we really could neglect air resistance, and so the speeds we gave for that height were reasonably correct. Typical figures for an actual launch (Fig. 13.13, overleaf) are to a height of 60 km and a speed of 6000 km/h (1.67km/s) at the end of the first stage, 200 km and 14 500 km/h (4.03 km/s) at the end of the second stage, and 500 km and 28 000 km/h (7.78 km/s) at the end of the third stage. The take-off is vertical, the path is then inclined at say 45°, then when the velocity is sufficient there is a period of coasting or free-wheeling between the second and third stages to the required height (which will become the perigee if the missile is to be a satellite) where the path will be horizontal, then the third stage rocket boosts the velocity to that required for orbit. The more this exceeds the circular velocity, the more distant will be the apogee. The perigee of nearly all the early satellites was less

than 800 km, but the apogee varied from just over 800 km for Sputnik 1 up to – well, to the moon and beyond.

The second stage, orbiting the earth, has already been considered in some detail, and there is little to add. This is the aspect of space flight of which we have had most experience, and there are now literally hundreds of ‘bodies’ of various shapes and sizes and masses orbiting the earth, and on a variety of orbits, and hundreds more that have finished their flights and have been burnt up on re­entering the atmosphere. There have also been several manned orbits of the earth, and space stations have been set up which can be permanently manned in ‘shifts’ by shuttle services, put together and enlarged up there, and used for a variety of purposes, some peaceful – others perhaps not so peaceful.

Launching a spacecraft

So far as going to the moon is concerned the first orbits are more or less cir­cular and then, at the third stage, at exactly the correct part of the orbit, a burst of power is given to boost the speed and put the spacecraft on its journey to the moon. Although this journey is often represented in diagrams as a straight line it is in fact merely an elongated elliptical orbit designed to pass near the moon, so the astronauts still experience the sensation of ‘weightless­ness’. Mid-course and other corrections, if required, can be given by short bursts of rocket power; since there is no air resistance the thrust required to make such changes is not very great. As in all elliptical orbits the speed will decrease as the apogee is approached, but by then the spacecraft will have passed the neutral point, will be attracted by the moon and will again pick up speed, but now new problems arise and we must consider how orbits of the moon differ from those round the earth.

Fig 13.13 Typical flight path for launching of spacecraft Not to scale.