Our heavyweight helicopter equal in the world does not have
In Rostov started production of the most load-lifting rotary-wing car The Russian holding «Helicopt[...]

Everything about aircrafts and helicopters. News and events in aviation worldwide. Civil, transportation, military helicopters and airplanes.

Everything about aircrafts and helicopters. News and events in aviation worldwide. Civil, transportation, military helicopters and airplanes.

Everything about aircrafts and helicopters. News and events in aviation worldwide. Civil, transportation, military helicopters and airplanes.

Everything about aircrafts and helicopters. News and events in aviation worldwide. Civil, transportation, military helicopters and airplanes.


Let an aircraft describing straight line phugoid, as shown in Figure 10.11, corresponding to C = 3/2, z = z1, cos в = 1, have its path slightly disturbed, say by a gust. It may then begin to describe a sinuous path of small slope, as in Figure 10.12, having the straight line as mean. This motion is called phugoid
oscillation. Since the vertical upward acceleration is — d2z/dt2, and since cos в = 1 to the first order, we have, for the vertical motion:
and therefore from Equation (10.10):
![]() d2 z gz
d2 z gz
dt2 Z1
This is simple harmonic motion whose period is 2n/(zi/g), showing that the disturbed motion is stable. In terms of the speed Vx the period is n-JlV^/g.
Example 10.3
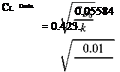
An aircraft weighing 105600 N flies at an altitude where the air density is 0.16 kg/m3. The wing area, aspect ratio and efficiency are 28 m2, 6 and 0.95, respectively. If the drag polar is:
CD = 0.01 + kC2L,
determine the speed and Mach number at which the aerodynamic efficiency will be maximum.
Solution
Given, W = 105600 N, 5 = 28 m2, Ж = 6.
Therefore:
1
k = —– ~E>
nesR
_ 1
n x 0.95 x 6
= 0.05584.
 |
For maximum aerodynamic efficiency, the drag has to be the minimum. For minimum drag, CD0 = kCL2 . Therefore, the lift coefficient becomes:
At level flight, L = W. The speed for drag minimum becomes:
![]()
![]() UDmin =
UDmin =
Dmin
105600
x 0.16 x 28 x 0.423
From standard atmospheric table, for the altitude with density 0.16 kg/m3, the pressure is 11145.75 Pa. The corresponding speed of sound is:
a
1.4 11145.75
0. 16 = 312.3m/s.
The Mach number corresponding to minimum drag is:
 UDn
UDn
a
333.84
312.3
Example 10.4
An aircraft of mass 30 000 kg, with an elliptical wing of area 225 m2, aspect ratio 7 delivering constant thrust of 53 kN, is taking off at sea level. The maximum possible lift coefficient is 2.0 and the profile drag coefficient while lift-off is 0.02 and the lift-off speed is 1.2 times the stalling speed. Assuming the rolling resistance to be negligible, calculate the lift-off distance required.
Solution
Given m = 30000 kg, S = 225 m2, T = 53000 N, CLmax = 2.0, CDf) = 0.02, A! = 7. The stalling speed Vs is the speed in level flight, with CLmax. Thus:
W
![]() 2 PSCl
2 PSCl
30000 X 9.81
і x 1.225 x 225 x 2.0
32.68 m/s.
Therefore, the lift-off speed is:
V = 1.2 x Vs = 1.2 x 32.68 = 39.22 m/s.
The lift coefficient at lift-off becomes:
![]() W
W
2 pV 2S mg
2 pV 2S
30000 x 9.81
2 x 1.225 x 39.222 x 225
1.388.
The drag coefficient at lift-off becomes:
![]() 1.3882 n x 1 x 7
1.3882 n x 1 x 7
= 0.108.
At lift-off, by force balance we have:
![]() T – D 12
T – D 12
T – – pV2SCd T – ^ 1 x 1.225 x 225 x 0.108^ V2 T – 14.88 V2
We can write — as: dt
dV _dV ds _ ydV dt ds dt ds
where s is the distance along the run way, that is the distance travelled by the aircraft from starting to any instantaneous state. Therefore:
T – 14.88 V2 = mV—.
ds
This gives:
Integrating from s = 0 (V = 0) to s = slo (V = V), we have the lift-off distance as:
m
— ln. „
2 T – 14.88 V2

![]() 53000
53000
53000 – (14.88 x 39.222) 53000
30111.46
10.10 Summary
For a flying machine, when the control surfaces are in their neutral positions the aircraft, like the aerofoil, has a median plane of symmetry, and when properly located the center of gravity G lies in this plane.
For an aircraft in straight level (horizontal) flight, the lift generated by the wings balances the weight and the thrust produced by the engine overcomes the drag.
Raising the elevators will decrease the lift on the tail, and will cause a pitching moment and moving the rudder will cause a yawing moment.
The ailerons move in opposite senses, one up, one down, by a single motion by the control column. If we depress the port aileron and therefore simultaneously raise the starboard one, the lift on the port wing will increase and that on the starboard wing will decrease so that the rolling moment will be caused tending to dip the starboard wing, and this sense will be positive. This movement also cause a yawing moment, for the drag on the two wings will likewise be altered.
When the aircraft velocity V is in a fixed straight line the flight is termed linear. When V is in the plane of symmetry the flight is termed symmetric. There are three types of linear symmetrical flight; gliding, horizontal, and climbing.
The flights can be steady (constant V) or accelerated. In the case of steady flight the resultant force on the aircraft must be zero. The forces are: (i) engine thrust, (ii) weight, (iii) aerodynamic force.
The lift coefficient CL is a function of the absolute angle of incidence a, and strongly influenced by the Reynolds number Re = pVl/g.
The stalled state is that in which the airflow on the suction side of the aerofoil is turbulent. Just before the stalled state sets in, the lift coefficient attains its maximum value, and the corresponding speed is called the stalling speed. Thus the stalling speed corresponds to a given CLmax. Stalling speed is a function of incidence.
For an aircraft gliding steadily with the engine off the resultant aerodynamic force Fad balances the weight W, that is:
Fad – W = 0.
Thus, if L and D, respectively, are the lift and drag acting on the aircraft:
L = W cos y D = W sin y,
where y is the angle which the direction of motion makes with the horizontal, called the gliding angle.
The forces acting on an aircraft in straight horizontal flight are the thrust T, weight W, and aerodynamic force Fad.
By proper choice of chord the incidence may be taken equal to the attitude and
L = W – T sin в D = T cos в.
In practice в is small, so that T = D, L = W, and
^ L W w
Cl = іpV2S = 2pV2S = 2pV2 ’
where w = W/S is called the wing loading, that is, the average load per unit area of wing plan. At the stalling speed VS, Cl becomes:
For aircraft flying steadily and horizontally, if Cl’ is the lift coefficient:
Cl'( 2 P^s) = W.
A sudden increase of incidence will increase the lift coefficient to:
cl( 2 pV’s)
and the aircraft will acquire an upward acceleration f given by:
c – clo( 2 pv 2 ^ = gf
so that it will begin to describe a curved path of radius of curvature r given by f = V2/r, where:
![]() 2W 1 _ 2w 1
2W 1 _ 2w 1
SgP (,Cl – Cl’) ~ ~8P (Cl – Cl’) ‘
In this analysis we ignore the change in drag. If the speed is high, CL’ is small and CL cannot exceed CLmax for speed V. Thus the absolute minimum value of r is given by:
where VS is the appropriate stalling speed.
When an aircraft flying steadily and horizontally is rolled through an angle ф from the vertical, the lift will no longer balance the weight. If the aircraft is supposed to be flying towards us so that the starboard wing is dipped, the aircraft will accelerate in the direction of the resultant of L and W, and will continue to accelerate until a steady state is reached owing to the wind blowing across the body and producing a side force in the direction of the span. The direction of motion is now inclined to the plane of symmetry at an angle в, say, measured positively when the direction of motion is to starboard. The aircraft is now moving crab-wise in the straight path and is said to be sideslipping. If V is the speed, the component of V sin в perpendicular to the plane of symmetry is called the velocity of side-slip.
Side-slip will neither diminish the drag nor increase the lift as compared to symmetrical flight at the same speed.
A banked turn is a steady motion in a horizontal circle with the plane of symmetry inclined to the vertical. The direction of motion is longitudinal and there is no side-force.
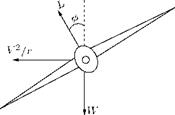
A phugoid is the path of a particle which moves under gravity in a vertical plane and which is acted upon by a force L normal to the path and proportional to V2.
Exercise Problems
1. If the lift coefficient of an aircraft is given by:
![]() CL = b sin
CL = b sin
find the maximum value of the lift coefficient, for b = 2, a = 2n.
2.
Show that the minimum radius of a true banked turn, for a given angle of bank ф, is:
2w cosec ф gp CLmax
6. The aerodynamic efficiency of a sail plane of weight 3150 N and wing area 10 m2 is 30. If it is in level flight at sea level with a speed of 170 km/h, determine the drag coefficient.
[Answer: 0.0077]
7. An aircraft weighing 23000 N has a span of 14 m and average chord of 1.2 m. If it flies with a velocity of 90 m/s and angle of attack 4° in sea level (a) determine the lift curve slope. (b) If the aircraft glides steadily with the same speed at a glide angle of 6°, what will be the lift curve slope? (c) If the lift coefficient during glide has to be the same as that in the level flight what should be the flight speed?
[Answer: (a) 3.954, (b) 2.65, (c) 90.24 m/s]
8. An aircraft flies at a true speed of 350 m/s at an altitude where the pressure and temperature are 18.25 kPa and 216.5 K, respectively. (a) If a one-fourteenth scale model of the aircraft is to be tested, under dynamically similar conditions, in a wind tunnel with test-section temperature 288 K, what should be the pressure in the test-section? Assume the viscosity of air varies with temperature as T3/4 approximately. (b) Show that the forces on the model will be about 10% of the corresponding forces on the prototype.
[Answer: (a) 365.26 kPa]
9. An aircraft wing of span 10 m and mean chord 2 m is designed to develop 45 kN lift at freestream velocity 400 km/h and density 1.2 kg/m3. A 1/20 scale model of the wing section is tested in a wind tunnel at velocity 500 m/s and density 5.33 kg/m3. The total drag measured is 400 N. Assuming the wind tunnel data refer to a section of infinite span, calculate the total drag and aerodynamic efficiency of the aircraft wing, assuming the load distribution to be elliptic.
[Answer: D = 2.649 kN, L/D = 16.99]
[1] Conservation of matter (continuity equation).
• Newton’s second law (momentum equation).
[2]Note that in Equation (5.3) both V and ds are vector quantities. Therefore, their “dot” product has become §AB(U dx + vdy)
[3]From Equation (5.5), it is seen that the circulation is undefined for r < r0, that is, around the axis of rotation the circulation is not defined.
[4]The induced velocity for the circulation shown (that is, clockwise when viewed from right to left), is into the page. When the circulation direction is reversed (that is, counter clockwise) the induced velocity will be from the page to upwards.
[5]It would be of value to note that, for a steady, incompressible viscous flow, the Bernoulli equation can be applied between any two points along a streamline only. But for a steady, incompressible and inviscid (that is, potential) flow, the Bernoulli equation can be applied between any two points, in the entire flow field. That is, the two points between which the Bernoulli equation is applied need not lie on a streamline.
[6]2
KEi = 4 жруг.
Thus the total KE is:
KE = KE0 + 2KEi
[8] pco V 2
[9] RTx 00 ’
since by thermal state equation:
[10] Approximate the vortex sheet shown in Figure 7.4 by a series of straight panels.
• Let the vortex strength y(s) per unit length be constant over a given panel, but allow it to vary from one panel to the next.
• That is, the vortex strength per unit length of the n panels are Y1. Y2. Y3. ….. Yn. These panel strengths are unknowns. Therefore, the main objective of the vortex panel technique is to solve for Yj, j = 1 to n, such that the body surface becomes a streamline of the flow and the Kutta condition is also satisfied.
[11] We could use the source strength distribution to satisfy flow tangency and the vortex distribution to satisfy the Kutta condition.
[12] Results
[13] Calc. Induced Velocity and Pressure coeff. do 400 i=1,num
Vsurf(i) = Vinf*cos(alpha-phi(i)) do 410 j=1,num
if(j. ne. i)then
xcl = (xc(i)-xn(j))*cos(phi(j)) + (yc(i)-yn(j))*sin(phi(j)) ycl =-(xc(i)-xn(j))*sin(phi(j)) + (yc(i)-yn(j))*cos(phi(j)) beta= atan(xcl/ycl) – atan((xcl-s(j))/ycl) ulocal =
1 (1.0/(2.*pi))*(gamma(j)+(gamma(j+1)-gamma(j))*xcl/s(j))*beta
2 + (1.0/(2.*pi))
3 *ycl/s(j)*(gamma(j+1)-gamma(j))*log(r(i/j+1)/r(i/j)) vlocal =
(1.0/(2.*pi))*(gamma(j)+(gamma(j+1)-gamma(j))*xcl/s(j))
[14] Given the load distribution and the plan, find the profiles of the sections.
[15] Given the plan and the profiles, find the load distribution (that is the vorticity distribution).
[16]This assumption will fail at a stagnation point, for then v = V. However, this will not cause any subsequent difficulty.
[17]It is essential to note that Mach lines are weak isentropic waves across which the changes in the flow properties are small but finite, thus, Mach lines are different from the weak isentropic waves termed Mach waves across which the changes in the flow properties are negligible.
A phugoid is the path of a particle which moves under gravity in a vertical plane and which is acted upon by a force L normal to the path and proportional to V2.
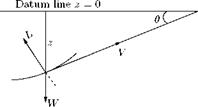
Since no work is done by force L, it follows that (1V2 — gz), the total energy of the particle (per unit mass), is constant, z being the depth of the particle below horizontal line, when speed is V, as shown in Figure 10.11.
We can choose the position of this line so that the constant energy is zero, and then we shall have:
V2 = 2gz. (10.6)
If в is the inclination of the path to the horizontal, as in Figure 10.11, then:
![]() W V2
W V2
L — W cos в =———- ,
g R’
where R is the radius of curvature.
If we could imagine an aircraft flying at constant incidence, and so arrange that the thrust exactly balances the drag, the center of gravity of the aircraft would describe a phugoid, for such a case L = 2pV2SCL and CL is constant for an incidence (if we neglect the effect of curvature of the path on lift coefficient).
Now let us assume that V1 is the speed at which the aircraft would fly in steady straight horizontal flight at the same incidence as in the phugoid. Then:
12
W = 2 pV2SCl
![]()
so that Equation (10.7) will give:
|
|
|
|
|
|
|
|
|
|
|
|
|
|
|
|
 |
![]()
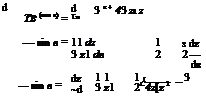
![]() From Equation (10.9), we have sin в
From Equation (10.9), we have sin в
dz dz 1 C _s/zr dS = Тв 3І7 — "2 ~
or
dB 1 C _s/zr
ds 3z1 2 z 2
|
Datum
 |
|
Figure 10.13 An aircraft in trochoidal-like paths.
1 _ _1____ C yZT
R = 3z1 2 ^ 2
or
![]() Z1 _ 1 C fz R = 3 – 2 Z3′
Z1 _ 1 C fz R = 3 – 2 Z3′
It can be shown that in Equation (10.10), cos в > 1 if C > 2/3, so that no phugoid is possible.
If C = 2/3, Equation (10.10) gives cos в = 1 so that в = 0 and R = <X). For this condition the phugoid is along a horizontal straight line, at depth z, below the datum line.
If C = 0, Equation (10.11) gives R = 3zi, and the phugoid reduces to a set of semicircles of radius 3zi. The cusps are on the datum line and the paths correspond to unsuccessful attempts at “loop the loop,” as shown in Figure 10.12.
For 0 < C < 2/3, the flight path will become trochoidal-like paths, as shown in Figure 10.13.
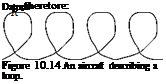
If Z1 and the initial values of z and в are prescribed, Equation (10.11) shows that for a given value of C there are two possible radii of curvature owing to the ambiguity sign of the square root. If there is a sudden gust, an aircraft describing a trochoidal-like paths as in Figure 10.13 will get into a loop, as shown in Figure 10.14.
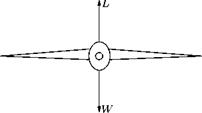
This is a steady motion in a horizontal circle with the plane ofsymmetry inclined to the vertical, as shown in Figure 10.10. The direction of motion is longitudinal and there is no side-force.
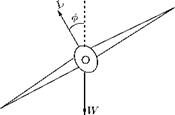
If ф is the angle of bank and r is the radius of the turn, then:
L cos ф = W
W V2
L sin ф =———-
g r V2
tan ф = —.
gr
If the differences due to the difference in speed at the outer and inner wing tips are ignored, then:
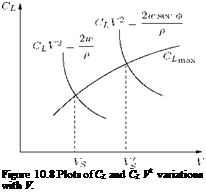
L = W sec ф w sec ф
CL =
|
|
and therefore, as in Figure 10.8, the stalling speed V’S is determined by the intersection of the curves CL V2 versus V with CLmax versus V graph. From the relation:
it appears that banking increases the stalling speed, and if we treat CLmax as a constant, the increase is in the ratio:
 |
 |
Consider an aircraft flying steadily and horizontally, as shown in Figure 10.9(a), to be rolled through an angle ф from the vertical, as shown in Figure 10.9(b) and held in this position by controls. The lift will no longer balance the weight.
If the aircraft is supposed to be flying towards us so that the starboard wing is dipped, the aircraft will accelerate in the direction of the resultant of L and W, and will continue to accelerate until a steady state is reached owing to the wind blowing across the body and producing a side force in the direction of the span. The direction of motion is now inclined to the plane of symmetry at an angle в, say, measured positively when the direction of motion is to starboard. The aircraft is now moving crab-wise in the straight path and is said to be sideslipping. If V is the speed, the component of V sin в perpendicular to the plane of symmetry is called the velocity of side-slip.
Side-slip will neither diminish the drag nor increase the lift as compared to symmetrical flight at the same speed. If D’ and L’ are the drag and lift, respectively, in the steady side-slip induced by the above maneuver then L’ < L, D > D. The gliding angle у’ will be given by:
tan у’
or у’ > у. The effect of side-slip is therefore to increase the gliding angle without reducing the speed.
Let us assume the aircraft to be flying steadily and horizontally, so that if CL’ is the lift coefficient:
CL ^ 2 pV2S^j = W,
a sudden increase of incidence will increase the lift coefficient to:
cL( 2 pvs)
and the aircraft will acquire an upward acceleration f given by:
C – Сь)(1PV 2 S) = gf
so that it will begin to describe a curved path of radius of curvature r given by f = V2/r, where:
_ 2W 1 _ 2w 1
Г = SSP (Cl – Cl’) ~ ~SP (CL – CL’) ‘
In this analysis we ignore the change in drag. If the speed is high, CL’ is small and CL cannot exceed CLmax for speed V. Thus the absolute minimum value of r is given by:
where VS is the appropriate stalling speed. Since CLmax is accompanied by a rather large drag, the theoretical value of rmin in Equation (10.4) cannot be attained.
Example 10.2
An aircraft weighing 200 kN, wing span 12 m and mean chord 2misin steady level flight at sea level, at a speed of 120 m/s. If the lift coefficient is suddenly increased by 10%, determine the upward acceleration causing the lift increase.
Solution
Given, W = 200 kN, 2b = 12 m, c = 2 m, V = 120 m/s.
|
1 2 ,
L = W = – pV2SC’L.
At sea level, p = 1.225 kg/m3. Therefore:
![]() L
L
2 pV 2S
200 x 103
= 1 x 1.225 x 1202 x (12 x 2) = 0.945.
The new lift coefficient is:
Cl = 1.1 x C’L = 1.1 x 0.945 = 1.04.
The expression for upward acceleration f is:
W, ,4 1 2
– f = Cl – CL) – pV2S. g 2
Hence:
(Cl – CL) 2pV2Sg
W
(1.04 – 0.945) 2 x 1.225 x 1202 x 24 x 9.81
200 x 103
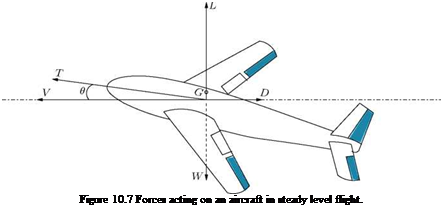
The forces acting on an aircraft in straight horizontal flight is shown in Figure 10.7. There are three forces; the thrust T, weight W, and aerodynamic force Fad acting on the aircraft. The components of Fad in the direction of V and normal to V, respectively, are the lift L and drag D.
By proper choice of chord the incidence may be taken equal to the attitude and
L = W – T sin в D = T cos в.
In practice в is small, so that T = D, L = W, and
![]() ^ L W w
^ L W w
L = 1 pV2S = 2pV2S = 2pV2 ’
 |
where w = W/S is called the wing loading, that is, the average load per unit area of wing plan. When w, p (that is altitude), and V are given, CL is determined, and therefore incidence from the CL versus а graph (Figure 10.3).
At the stalling speed VS, Equation (10.1) becomes:
The stalling speed VS can be determined by plotting a graph of CLV2 = 2w/p versus V and CL versus V together, as shown in Figure 10.8.
It is seen that the stalling speed VS increases with altitude (that is, with decrease of flow density p). From Equations (10.1) and (10.2), we have:
 |
CL^1PV2) = CLmax (jPV^j = W. (10.3)
The air-speed indicator measures 1pV2 but is graduated to read V. It is, therefore, correct only for the particular value of the density p for which it is graduated, but, if we neglect variations of CLmax, it follows from Equation (10.3) that the aircraft will stall always at the same indicated airspeed when it is in straight horizontal flight, whatever the height.
For an aircraft gliding steadily with the engine off, as shown in Figure 10.6, the resultant aerodynamic force Fad balances the weight W, that is:
Fad – W = 0.
Thus, if L and D, respectively, are the lift and drag acting on the aircraft:
L = W cos у D = W sin y,
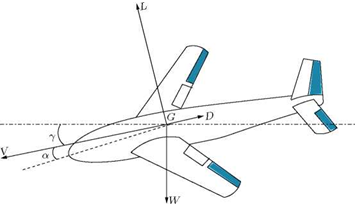 |
where y is the angle which the direction of motion makes with the horizontal, called the gliding angle. Therefore:
This equation expresses the gliding angle у in terms of CL and CD. It should be noted that CL and CD here are the lift and drag coefficients for the whole aircraft. The attitude of the aircraft is the angle which a line fixed in the aircraft makes with the horizontal, as shown in Figure 10.6. If we measure the incidence a and attitude в from the same line we have в = а — у. Note that в and a can be negative, as shown in Figure 10.6, but the glide angle у is necessarily positive. Also note that the direction of the glide does not, in general, coincide with any fixed direction in the aircraft, in other words the attitude is a function of the incidence a.
The extreme attitude is that assumed when the aircraft is diving vertically, the terminal velocity dive. In this case the lift vanishes, the incidence is that of zero lift, and if the dive is undertaken from sufficiently great height, the weight just balances the drag, the speed being the terminal speed, may be five or six times the stalling speed. The attitude will then be about —90°.
Example 10.1
A glider of aspect ratio 6 has a drag polar of:
CD = 0.02 + 0.06CL.
Find the change in minimum angle of glide if the aspect ratio is increased to 10.
Solution
 1 and 2 refer to aspect ratio 6 and 10, respectively.
1
6, Cd0 = 0.02, k = —— = 0.06.
ЛеДъ 1
wing efficiency is:
1
![]() 0.06 x n x 6 0.884.
0.06 x n x 6 0.884.
For minimum glide angle, the drag should be minimum. For drag minimum, CDo = kC, therefore,
0.06Ci = 0.02
/__2 L1 у o._6
= 0.577.
For^?2 = 10:
_ 1 ne$t 2 _ 1 n x 0.884 x 10 = 0.036.
0.02 0.036 0.745.
![]()
The drag coefficients for aspect ratios 6 and 10 are:
CDl = 0.02 + 0.06 x 0.5772 = 0.04
CD2 = 0.02 + 0.036 x 0.7452 = 0.04.
Therefore, the gliding angles for these cases become:
|
Y1 = tan 1 | |
‘ CDi j ,ClJ |
|
= tan-1 ( |
ґ 0.04 |
|
ч0.577 |
|
|
= 3.966° |
|
|
Y2 = tan-1 1 |
‘ 0.04 |
|
0.745 |
|
= 3.073°. |
The difference between the gliding angles is:
Y1 – y2 = 3.966° – 3.073°
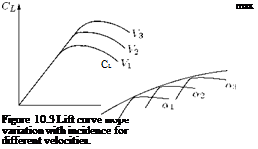
We know that the lift coefficient CL is a function of the absolute angle of incidence a, and strongly influenced by the Reynolds number Re = pVl/д. For a given aircraft we could therefore draw a surface which is the locus of the point (CL, a, Re) which is the characteristic lift surface for that aircraft. Since the aircraft is given, l is known, and for the freestream flow the state of the air is given, so that in this case CL is a function of incidence a and of the forward speed V. From this point of view the characteristic surface may then be regarded as the locus of the point (CL, a, V). Let us consider three points on this surface (CL1, aj, Vj), (CL2, a2, V2), (CL3, a3, V3), where let us suppose V1 < V2 < V3 and a < a2 < a3. The variation of CL with a corresponding to velocities V, V2, V3 are shown in Figure 10.3.
It is seen that the straight portions of CL versus a graph corresponding to values of V, V2, V3 of V, the straight portions are practically in the same line. This plot may be thought of as showing sections of the characteristic surface by planes V = V, V = V2, V = V3. In all our discussions in the previous chapters, we considered CL to be directly proportional to a, that is, we have restricted ourselves to the linear part of the graph about which pure theory can make statements. Plots of the type shown in Figure 10.3 must necessarily be obtained from experimental measurements, and the graph shows that, with increasing incidence, CL rises to a maximum value CLmax and then decreases.
It is generally, but not always, the case that CLmax for a given V increases as V increases. If the sections of the characteristic surface by the planes a = a1, a = a2, a = a3, we get the variation of CL with V as shown in Figure 10.4.
 |
у
Figure 10.4 Lift curve slope variation with V in the sections of the characteristic surface cut by the planes a = аь
a = a2, a = a3.
The stalled state is that in which the airflow on the suction side of the aerofoil is turbulent. It is found that, just before the stalled state sets in, the lift coefficient attains its maximum value, and the corresponding speed is called the stalling speed. Thus the stalling speed corresponding to a given CLmax can be read from the continuous curve of Figure 10.4.
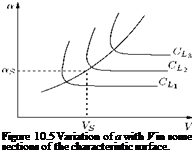
Stalling speed is a function of incidence. Variation of a with V in the sections of the characteristic surface by planes CL = CL1, CL = CL2, CL = CL3 is as shown in Figure 10.5.
In Figure 10.5 the continuous line shows the stalling speed as a function of the stalling incidence aS. Any point (a, V) above this curve corresponds to stalling flight, any point below it with normal flight.
 |
It should be noted that the foregoing discussion only applies to speeds V such that the flow speed over the aerofoil nowhere approaches the speed of sound, that is, we neglect variation with Mach number.
The graphs of the above type are all cases deduced from experiments, generally in wind tunnels for condition corresponding to linear flight at constant speed. When the aircraft flies in a curved path the graph will differ slightly from the above, but investigations made by Wieselsberger [Reference 9] show that the changes are of the order of the square of the ratio of the span to radius of curvature of the path and may therefore, in general, be neglected.
Moreover, for most calculations it is sufficient to substitute one of the CL graphs in Figure 10.3 for the whole graph, namely the one which corresponds to the landing speed, because the danger of stalling is generally greatest when the aircraft is about to land and is therefore flying near to the stalling incidence and at a low speed. When we substitute Reynolds number Re for velocity throughout, the foregoing conditions may be held to apply to a family of geometrically similar aircraft. For such a family there will be one characteristic lift surface.
When the aircraft velocity V is in a fixed straight line the flight is termed linear. When V is in the plane of symmetry the flight is termed symmetric. There are three types of linear symmetrical flight; gliding,
Theoretical Aerodynamics, First Edition. Ethirajan Rathakrishnan.
© 2013 John Wiley & Sons Singapore Pte. Ltd. Published 2013by John Wiley & Sons Singapore Pte. Ltd.
 |
-У
Gliding Horizontal Climbing
Figure 10.2 Illustration of gliding, horizontal and climbing flight.
horizontal, and climbing, as illustrated in Figure 10.2. Among these, gliding is the only flight possible without use of the engine.
The flights can be steady (constant V) or accelerated. In the case of steady flight the resultant force on the aircraft must be zero. The forces are: (i) engine thrust (under control of the pilot), (ii) weight (not under control of the pilot), and (iii) aerodynamic force (in some measure under control of the pilot by use of ailerons, rudder, and elevators).
10.1 Introduction
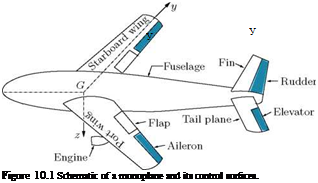
So far we were focusing on the wing and its sectional profiles, considering the geometrical parameters of the aerofoil (wing) and the parameters of the flow to which it is exposed. The pressure loading, lift and drag associated with aerofoil were discussed for both two-dimensional (infinite) and three-dimensional wings. In this chapter, let us consider a complete flying machine and study some of the basic flights associated with it. A flying machine and its control surfaces are schematically shown in Figure 10.1
When the control surfaces are in their neutral positions the aircraft, like the aerofoil, has a median plane of symmetry, and when properly located the center of gravity G lies in this plane.
The fixed fin of the aircraft is in the plane of symmetry, as shown in Figure 10.1. For simplicity, let us assume the aircraft to be in straight level (horizontal) flight, with all the control surfaces in their neutral positions. The lift is generated by the wings (port and starboard wings) and tail (the lift associated with the body of the aircraft is ignored). The thrust produced by the engine overcomes the drag, that is the thrust is assumed to be horizontal.
In Figure 10.1, the lateral axis Gy is perpendicular to the plane of symmetry and positive to starboard (that is to right). The symmetry will not be disturbed if the elevators are deflected. Raising the elevators will decrease the lift on the tail, and will cause a pitching moment, positive when the nose tends to be lifted. Moving the rudder to starboard will cause a yawing moment, tending to deflect the nose to the starboard, the positive sense.
The ailerons move in opposite senses, one up, one down, by a single motion by the control column. If we depress the port aileron and therefore simultaneously raise the starboard one, the lift on the port wing will increase and that on the starboard wing will decrease so that the rolling moment will be caused tending to dip the starboard wing, and this sense will be positive. This movement also causes a yawing moment, for the drag on the two wings will likewise be altered. To minimize this the ailerons are generally geared to move differentially so that one moves through a greater angle than the other.
Motion of ailerons or rudder will disturb the symmetry of the aircraft. A single-engine aircraft also has a dynamical asymmetry (tendency to tilt).