BERNOULLI’S PRINCIPLE AND SUBSONIC AIRFLOW
All of the external aerodynamic forces on a surface are the result of air pressure or air friction. Friction effects are generally confined to a. thin layer of air in the immediate vicinity of the surface and friction forces are not the predominating aerodynamic forces. Therefore,
ICAO STANDARD ATMOSPHERE [1]
|
ALTITUDE FT. |
density RATIO O’ |
ІТ- |
PRESSURE RATIO 8 |
TEMPER ATURE "F |
TEMPER ATURE RATIO в |
SPEED OF SOUND a KNOTS |
KINEMATIC VISCOSITY V FT^SEC |
|
0 |
t.0000 |
1.0000 |
1.0000 |
59.00 |
1.0000 |
661.7 |
.000158 |
|
IOOO |
0.971 1 |
0.9854 |
0.9644 |
55.43 |
0.9931 |
659.5 |
.000161 |
|
2000 |
09428 |
0.9710 |
0 9298 |
51 .87 |
0 9862 |
657.2 |
.000165 |
|
3000 |
0.9151 |
0.9566 |
0.8962 |
48.30 |
0.9794 |
654.9 |
.000169 |
|
4000 |
0.8881 |
0.9424 |
0.8637 |
44.74 |
0.9725 |
652.6 |
.000174 |
|
5000 |
0.8617 |
0.9283 |
0.8320 |
41.(7 |
0.9656 |
650.3 |
.000178 |
|
6000 |
0.8359 |
0.9143 |
0.8014 |
37.60 |
0.9587 |
647.9 |
.000182 |
|
7000 |
0.8106 |
0.9004 |
0.7716 |
34.04 |
0.9519 |
645.6 |
.000187 |
|
8000 |
0.7860 |
0.8866 |
0.7428 |
30.47 |
0.9450 |
643.3 |
.000192 |
|
9000 |
0.7620 |
0.8729 |
0.7148 |
26.90 |
0.9381 |
640.9 |
.000197 |
|
10000 |
0.7385 |
0-8593 |
0.6877 |
23.34 |
0.9312 |
638.6 |
.000202 |
|
15000 |
0.6292 |
0.7932 |
0.5643 |
5.51 |
0.8969 |
626.7 |
.000229 |
|
20000 |
0.5328 |
0.7299 |
0.4595 |
—12.32 |
0.8625 |
614.6 |
.000262 |
|
25000 |
0.4481 |
0.6694 |
0.3711 |
-30.15 |
0.8281 |
602.2 |
.000302 |
|
30000 |
0.3741 |
0.6117 |
0.2970 |
-47.98 |
0.7937 |
589 5 |
,000349 |
|
35000 |
0.3099 |
0.5567 |
0.2353 |
-65.82 |
0.7594 |
576.6 |
.000405 |
|
* 36089 |
0.2971 |
0.5450 |
0.2234 |
-69.70 |
0.7519 |
573.8 |
.000419 |
|
40000 |
0.2462 |
0.4962 |
0.1851 |
-69.70 |
0.7519 |
573.8 |
.000506 |
|
45000 |
0.1936 |
0.4400 |
0.1455 |
-69,70 |
0.7519 |
573.8 |
.000643 |
|
50000 |
0.1522 |
0.3902 |
0.1 145 |
-69.70 |
0.7519 |
573.8 |
.000818 |
|
55000 |
0.1 197 |
0.3460 |
0.0900 |
-69.70 |
0.7519 |
573.8 |
.001040 |
|
60000 |
‘ 0.0941 |
0.3068 |
0.0708 |
-69.70 |
0.7519 |
573.8 |
.001323 |
|
65000 |
0.0740 |
0.2721 |
0.0557 |
-69.70 |
0.7519 |
573.8 |
.001682 |
|
70000 |
0.0582 |
0.2413 |
0.0438 |
-69.70 |
0.7519 |
573.8 |
.002139 |
|
75000 |
0.0458 |
0.2140 |
0.0344 |
-69.70 |
0.7519 |
573.8 |
.002721 |
|
80000 |
0.0360 |
0.(897 |
0.0271 |
-69.70 |
0.7519 |
573.8 |
.003460 |
|
85000 |
0.0280 |
0.1673 |
0.0213 |
-64.80 |
0.7613 |
577.4 |
.004499 |
|
90000 |
0.0217 |
0.1472 |
0.0168 |
-56.57 |
0.7772 |
583.4 |
.00591 |
|
95000 |
0.0169 |
0.1299 |
0.0134 |
-48.34 |
0.7931 |
589.3 |
.00772 |
|
100000 |
0.0132 |
0.1149 |
0.0107 |
-40.11 |
0.8089 |
595.2 |
.01004 |
![]()
the pressure forces created on an aerodynamic surface can be studied in a simple form which at first neglects the effect of friction and viscosity of the airflow. The most appropriate means of visualizing the effect of airflow and the resulting aerodynamic pressures is to study the fluid flow within a closed tube.
Suppose a stream of air is flowing through the tube shown in figure 1.2. The airflow at station 1 in the tube has a certain velocity, static pressure, and density. As the airstream approaches the constriction at station 2 certain changes must take place. Since the airflow is enclosed within the tube, the mass flow at any point along the tube must be the same and the velocity, pressure, or density must change to accommodate this continuity of flow.
BERNOULLI’S EQUATION. A distinguishing feature of subsonic airflow is that changes in pressure and velocity take place with small and negligible changes in density. For this reason the study of subsonic airflow can be simplified by neglecting the variation of density in the flow and assuming the flow to be incompressible. Of course, at high flow speeds which approach the speed of sound, the flow must be considered as compressible and “compressibility effects” taken into account. However, if the flow through the tube of figure 1.2 is considered subsonic, the density of the airstream is essentially constant at all stations along the length.
If the density of the flow remains constant, static pressure and velocity are the variable quantities. As the flow approaches the constriction of station 2 the velocity must increase to maintain the same mass flow. As – the velocity increases the static pressure will decrease and the decrease in static pressure which accompanies the increase in velocity can be verified in two ways:
(1) Newton’s laws of motion state the requirement of an unbalanced force to produce an acceleration (velocity change). If the airstream experiences an increase in velocity approaching the constriction, there must
be an unbalance of force to provide the acceleration. Since there is only air within the tube, the unbalance of force is provided by the static pressure at station 1 being greater than the static pressure at the constriction, station 2.
(2) The total energy of the air stream in the tube is unchanged. However, the air – stream energy may be in two forms. The airstream may have a potential energy which is related by the static pressure and a kinetic energy by virtue of mass and motion. As the total energy is unchanged, an increase in velocity (kinetic energy) will be accompanied by a decrease in static pressure (potential energy). This situation is analagous to a ball rolling along a smooth surface. As the ball rolls downhill, the potential energy due to position is exchanged for kinetic energy of motion. If friction were negligible, the change of potential energy would equal the change in kinetic energy. This is also the case for the airflow within the tube. The relationship of static pressure and velocity is maintained throughout the length of the tube. As the flow moves past the constriction toward station 3, the velocity decreases and the static pressure increases.
The Bernoulli equation for incompressible flow is most readily explained by accounting for the energy of the airflow within the tube. As the airstream has no energy added or subtracted at any point, the sum of the potential ^rid kinetic energy must be constant. The kinetic energy of an object is found by: K. E.^’AMV*
where K.£. = kinetic energy, ft.-lbs. M=mass, slugs V= velocity, ft./sec.
The kinetic energy of a cubic foot of air is:
where = kinetic energy per cu. ft., psf p=air density, slugs per cu. ft. H^air velocity, ft./sec.

|
|
|
|
|

If the potential energy is represented by the static pressure, p, the sum of the potential and kinetic energy is the total pressure of the air – stream.
H=p+%PV*
where H = total pressure, psf (sometimes referred to as “head” pressure) p — static pressure, psf. p = density, slugs per cu. ft.
V= velocity, ft./sec.
This equation is the Bernoulli equation for incompressible flow. It is important to appreciate that the term y2pV2 has the units of pressure, psf. This term is one of the most important in all aerodynamics and appears so frequently that it is given the name “dynamic pressure” and the shorthand notation “q" ■ q=dynamic pressure, psf = %pV*
With this definition it could be said that the sum of static and dynamic pressure in the flow tube remains constant.
Figure 1.3 illustrates the variation of static, dynamic, and total pressure of air flowing through a closed tube. Note that the total pressure is constant throughout the length and any change in dynamic pressure produces the same magnitude change in static pressure.
The dynamic pressure of a free airstream is the one common denominator of all aerodynamic forces and moments. Dynamic pressure represents the kinetic energy of the free airstream and is a factor relating the capability for producing changes in static pressure on a surface. As defined, the dynamic pressure varies directly as the density and the square of the velocity. Typical values of dynamic pressure, q, are shown in table 1-1 for various true airspeeds in the standard atmosphere. Notice that the dynamic pressure at some fixed velocity varies directly with the density ratio at any altitude. Also, appreciate the fact that at an altitude of 40,000 feet (where the density ratio, <r, is 0.2462) it is necessary to have a true air velocity twice that at sea level in order to product the same dynamic pressure.
|
TABLE 1-1. Effect of Speed and Altitude on Dynamic Pressure
where j= dynamic pressure, psf p=air density, slugs per cu. ft. K=air velocity, ft. per sec. or £=.00339<rV“ where a= density ratio V – true velocity, knots 0.00339= constant which allows use of knots as velocity units and chc altitude density ratio ati alternate form is |
£=—2 (0.00339=™’)
q 295 295/
AIRSPEED MEASUREMENT. If a symmetrically shaped object were placed in a moving airstream, the flow pattern typical of figure 1.4 would result. The airstream at the very nose of the object would stagnate and the relative flow velocity at this point would be zero. The airflow ahead of the object possesses some certain dynamic pressure and ambient static pressure. At the very nose of the object the local velocity will drop to zero and the airstream dynamic pressure will be converted into an increase in static pressure at the stagnation point. In other words, there will exist a static pressure at the stagnation point which is equal to the airstream total pressure—ambient static pressure plus dynamic pressure.
Around the surface of the object the airflow will divide and the local velocity will increase from zero at the stagnation point to some maximum on the sides of the object. If friction and viscosity effects are neglected, the
![]()
|

FORWARD STAGNATION
POINT
AIRSTREAM AHEAD
HAS AMBIENT STATIC
PRESSURE AND DYNAMIC
PRESSURE
STAGNATION PRESSURE
IS AIRSTREAM TOTAL
PRESSURE
P+Q
Figure 1.4. Flow Pattern on a Symmetrical Object
surface airflow continues to the aft stagnation point where the local velocity is again zero. The important point of this example of aerodynamic flow is existence of the stagnation point. The change in airflow static pressure which takes place at the stagnation point is equal to the free stream dynamic pressure, q.
The measurement of free stream dynamic pressure is fundamental to the indication of airspeed. In fact, airspeed indicators are simply pressure gauges which measure dynamic pressure related to various airspeeds. Typical airspeed measuring systems are illustrated in figure 1.5. The pitot head has no internal flow velocity and the pressure in the pitot tube is equal to the total pressure of the airstream. The purpose of the static ports is to sense the true static pressure of the free airstream. The total pressure and static pressure lines are attached to a differential pressure gauge and the net pressure indicated is the dynamic
pressure, q. The pressure gauge is then calibrated to indicate flight speed in the standard sea level air mass. For example, a dynamic pressure of 305 psf would be realized at a sea level flight speed of 300 knots.
Actually there can be many conditions of flight where the airspeed indicator does not truly reflect the actual velocity through the air mass. The corrections that must be applied are many and listed in sequence below:
(1) The indicated airspeed (IAS) is the actual instrument indication for some given flight condition. Factors such as an altitude other than standard sea level, errors of the instrument and errors due to the installation, compressibility, etc. may create great variance between this instrument indication and the actual flight speed.
(2) The calibrated airspeed (CAS) is the result of correcting IAS for errors of the
PITOT-STATIC SYSTEM PITOT WITH SEPARATE
 |
STATIC SOURCE
Figure. 1.5. Airspeed Measurement
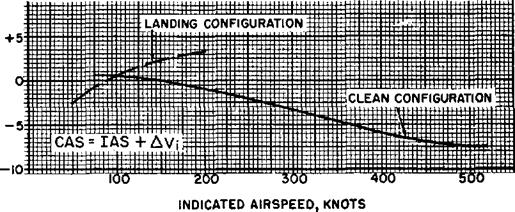
instrument and errors due to position or location of the installation. The instrument error must be small by design of the equipment and is usually negligible in equipment which is properly maintained and cared for. The position error of the installation must be small in the range of airspeeds involving critical performance conditions. Position errors are most usually confined to the static source in that the actual static pressure sensed at the static port may be different from the free airstream static pressure. When the aircraft is operated through a large range of angles of attack, the static pressure distribution varies quite greatly and it becomes quite difficult to minimize the static source error. In most instances a compensating group of static sources may be combined to reduce the position error. In order to appreciate the magnitude of this problem, at flight speed near 100 knots a
0. 05 psi position error is an airspeed error of 10 knots. A typical variation of airspeed system position error is illustrated in figure 1.6.
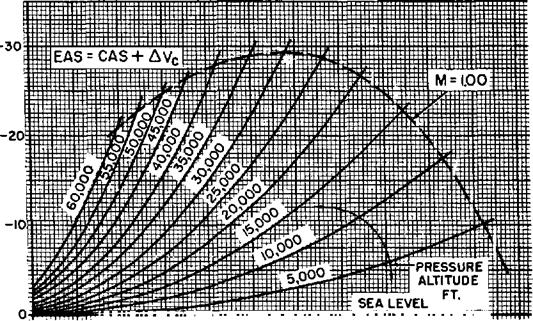
(Ъ) The equivalent airspeed (EAS) is the result of correcting the (CAS) for compressibility effects. At high flight speeds the stagnation pressure recovered in the pitot tube is not representative of the airstream dynamic pressure due to a magnification by compressibility. Compressibility of the airflow produces a stagnation pressure in the pitot which is greater than if the flow were incompressible. As a result, the airspeed indication is given an erroneous magnification. The standard airspeed indicator is calibrated to read correct when at standard sea level conditions and thus has a compressibility correction appropriate for these conditions. However, when the aircraft is operating above standard sea level altitude,
|
імміїміїимміігттмітіїн-жштніпііііішшниіімттіннжн** 100 200 300 400 500 600 CALIBRATED AIRSPEED, KNOTS |
|
|
 |
|
|
|
|
|
|
|
|
|
|
|
|
|
|
|
|
|
|
|
|
|
|
|


condition.
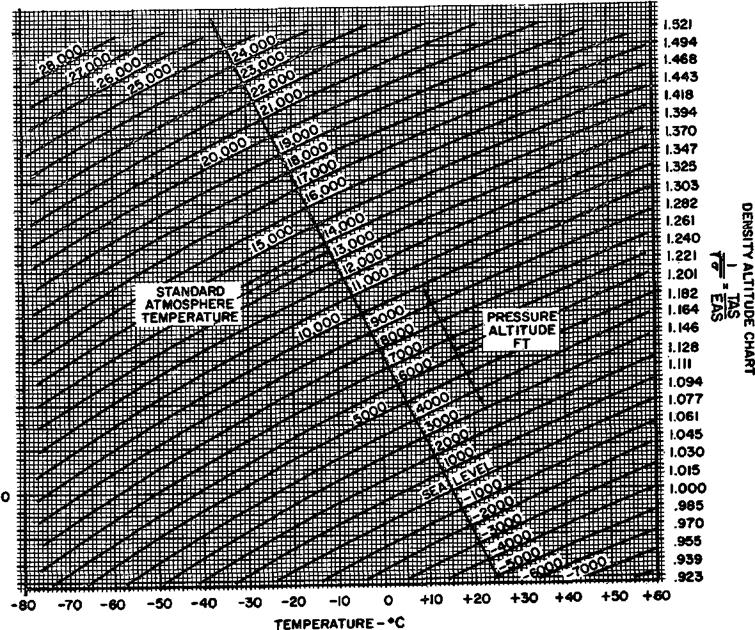
(4) The true airspeed (TAS) results when the EAS is corrected for density altitude. Since the airspeed indicator is calibrated for the dynamic pressures corresponding to airspeeds at standard sea level conditions, variations in air density must be accounted for. To relate EAS and TAS requires consideration that the EAS coupled with standard sea level density produces the same dynamic pressure as the TAS goupled with the
л лАіч л 1 л > и J ЛЛ 11 4 4- тт – rtf А rt /-«<4 d ( f < rsr*
All UL. llblt}’ A/A UUU.
From this reasoning, it can be shown that:
|
(TASyP = (EASy p о
|
where TAT=true airspeed
EAS= equivalent airspeed p = actual air density Po = standard sea level air density <r = altitude density ratio, p/p0
The result shows that the TAS is a function of EAS and density altitude. Figure 1.6 shows a chart of density altitude as a function of pressure altitude and temperature. Each particular density altitude fixes the proportion between TAS and EAS. The use of a navigation computer requires setting appropriate values of pressure altitude and temperature on the scales which then fixes the proportion between the scales of TAS and EAS (or TAS and CAS when compressibility corrections are applicable).
Thus, the airspeed indicator system measures dynamic pressure and will relate true flight velocity when instrument, position, compressibility, and density corrections are applied. These corrections are quite necessary for accurate determination of true airspeed and accurate navigation.
Bernoulli’s principle and the concepts of static, dynamic, and total pressure are the basis of aerodynamic fundamentals. The pressure distribution caused by the variation of local static and dynamic pressures on a surface is the source of the major aerodynamic forces and moment.


