FLUID STATICS AND THE ATMOSPHERE
Before treating the more difficult case of a fluid in motion, let us consider a fluid at rest in static equilibrium. The mass per unit volume of a fluid is defined as the mass density, usually denoted by p. The mass density is a
16
constant for liquids, but it is a function of temperature, T, and pressure, p, for gases. Indeed, for a gas, p, p, and T are related by the equation of state
P = pKT (2.1)
R is referred to as the gas constant and has a value of 287.3 m2/°K-sec2 for air at normal temperatures. In Equation 2.1, T is the thermodynamic or absolute temperature in degrees Kelvin. T and the Celsius temperature, t, are related by
T = t+ 273.15 (2.2)
 |
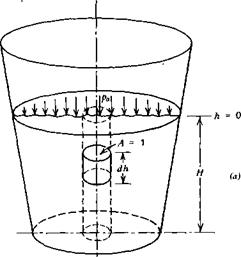
A container filled with a liquid is pictured in Figure 2.1a. A free-body diagram of a small slug of the fluid is shown in Figure 2.1b. This slug has a
|
< |
> |
T dh 1 |
|
A |
И < |
|
Pgdh |
Figure 2.1 The variation of pressure with depth in a liquid.
unit cross-sectional area and a differential length of dh. Acting downward over the upper surface is the static pressure, p, while acting upward over the lower face is this same pressure plus the rate of increase of p with depth multiplied by the change in depth, dh. The static pressure also acts inward around the sides of the element, but this contributes nothing to the balance of forces in the vertical direction. In addition to the pressure forces, the weight of the fluid element, pgdh, acts vertically downward; g is the gravitational constant.
Summing forces on the element in the vertical direction leads to
Integrating Equation 2.3 from h = 0 at the surface to any depth, h, results in the static pressure as a function of the depth.
P = Pa + pgh (2.4)
where pa is the atmospheric pressure at the free surface.
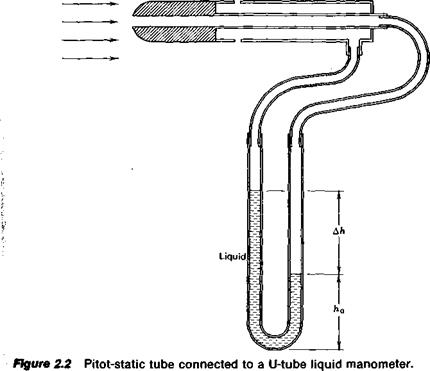
A manometer is a device frequently used to measure pressures. It is based on Equation 2.4. Consider the experimental setup pictured in Figure
2.2. Here, a device known as a pitot-static tube is immersed in and aligned with a gas flow. The impact of the gas being brought to rest at the nose of the tube produces a pressure higher than that along the sides of the tube. This pressure, known as the total pressure, is transmitted through a tube to one side of a U-shaped glass tube partially filled with a liquid. Some distance back from the nose of the pitot-static tube the pressure is sampled through a small opening that is flush with the sides of the tube. This opening, if it is far enough back from the nose, does not disturb the flow so that the pressure sampled by it is the same as the static pressure of the undisturbed flow. This static pressure is transmitted to the right side of the glass U-tube manometer. The total pressure, being higher than the static pressure, causes the liquid in the right side of the U-tube to drop while the level on the left side rises.
If we denote p as the static pressure and p + Ap as the total pressure, the pressure at the bottom of the U-tube can be calculated by Equation 2.4 using either the right or left side of the tube. Equating the results from the two sides gives
p + Ap + pgh0 = p + pg(Ah + h0)
or
Ap = pg Ah (2.5)
Hence, the difference of the liquid levels in the two sides of the manometer is a direct measure of the pressure difference applied across the manometer. In this case we could then determine the difference between the total pressure
|
|
|
|
|
|
|
|
|
|
|
|
From experimental observation, the variation of temperature with altitude is known or, at least, a standard variation has been agreed on. Up to an altitude of 11 km, the temperature is taken to decrease linearly with altitude at a rate, known as the lapse rate, of 6.51 °C/km. Thus, Equation 2.7 becomes
dp _ dT g p T R(dTldh) or
8 = 05 2561 (2.8)
where 5 is the ratio of the static pressure at altitude to the pressure at sea
level and в is the corresponding absolute temperature ratio.
Using the equation of state, the corresponding density ratio, a, is obtained immediately from Equation 2.8.
8
а = в or
c = 042561 (2.9)
Using the standard lapse rate and a sea level temperature of 288.15 °K, в as a function of altitude is given by
0 = 1— 0.02256 h (2.10)
where h is the altitude in kilometers.
The lower region of the atmosphere up to an altitude for which Equations 2.8 to 2.10 hold is referred to as the troposphere. This is the region in which most of today’s flying is done. Above 11 km and up to an altitude of approximately 23 km, the temperature is nearly constant. This region forms the lower part of the stratosphere. Through the remainder of the stratosphere, the temperature increases, reaching approximately 270 °K at an altitude of around 50 km.
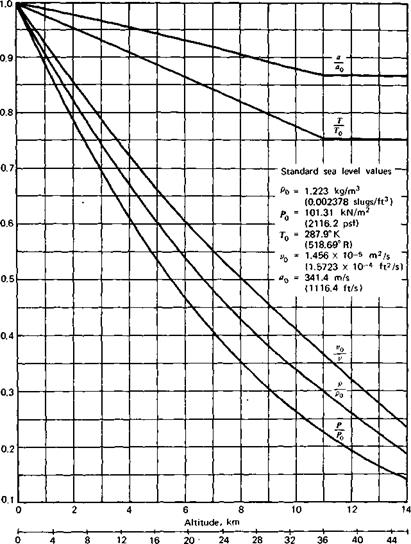
Figure 2.3 presents graphs (taken from Ref. 2.3) of the various properties of the standard atmosphere as a function of altitude. Each property is presented as a ratio to its standard sea level value denoted by the subscript “0.” In addition to p, p, and T, the acoustic velocity and kinematic viscosity are presented. These two properties will be defined later.
One normally thinks of altitude as the vertical distance of an airplane above the earth’s surface. However, the operation of an airplane depends on the properties of the air through which it is flying, not on the geometric height. Thus the altitude is frequently specified in terms of the standard atmosphere. Specifically, one refers to the pressure altitude or the density altitude as the height in the standard atmosphere corresponding tv. the pressure or density, respectively, of the atmosphere in which the airplane is operating. An airplane’s altimeter is simply an absolute pressure gage calibrated according to
|
Thousands of feet Figure 2.3 The standard atmosphere. |
the standard atmosphere. It has a manual adjustment to allow for variations in sea level barometric pressure. When set to standard sea level pressure (760 mm Hg, 29.92 in. Hg), assuming the instrument and static pressure source to be free of errors, the altimeter will read the pressure altitude. When set to the local sea level barometric pressure (which the pilot can obtain over the
radio while in flight), the altimeter will read closely the true altitude above sea level. A pilot must refer to a chart prescribing the ground elevation above sea level in order to determine the height above the ground.


