GEOMETRY AND GENERAL
Before we can evaluate available experimental and other information, we will consider the geometrical shape of foil sections. We will also discuss methods and limitations of testing foil sections.
AIRFOILS, or aerofoils as the British say, are more or less flat surfaces producing or experiencing lift (or “lateral” forces) in a direction essentially normal to their plane. They have usually a more or less round “nose” or leading edge, and a comparatively slender wedge-like afterbody, ending in a sharp trailing edge. Figure 1 shows the geometric elements of such a section; namely chord and mean or camber line, thickness and thickness location, camber and camber location. Regarding shape, there is a nose radius/ and a trailing-edge “wedge” angle to be considered. Any section can thus be fairly well defined by listing the various dimensions in terms of the chord.
EARLY SECTIONS. Within the framework above, there is an endless variety of shapes that can be designed and tried. In fact, during the last 50 or more years, thousands of sections have been tested, and a smaller number of them have been used in the actual building of airplanes. Early researchers developed wing sections completely by empirical methods, imitating, for example, those of birds. The sections investigated by Lilienthal (2,a) in the past century, and many of those tested by Eiffel (2,b) during the first decade of this century, were comparatively thin, and cambered. They are completely obsolete now, although they are evidently suitable for birds (at Reynolds numbers below 10*?). A few of these sections can still be found in (7,a); one of them is included in figure 2. As flying was progressing from just “hovering” at maximum L/D, thin sections used in biplanes, were straightened to accommodate higher forward speeds.
![]()
![]()

![]()
![]()
 Ro = 4(Ю)5
|
biplane section RAJ-15 (8,b) HM 888 t/o =. 64, t/o = 34, Cj.^ – 1.20 NOTE SPACE AVAILABLE POR TWO SPARS |
section reportedly used in the upper wing of the Wright Brothers’ "Flyer’(3) t/o – 2.24, t/o * 74, flown at CL »«o,6
Figure 2. Examples of early wing sections.
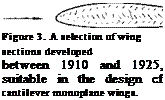
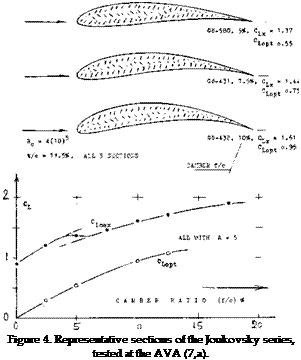
MODERN SECTIONS. Roughly between 1915 and 1925, sections were developed, as particularly reported in (7), eventually to be used in cantilevered monoplane wings. The most successful of these sections, such as Go-535 (a famous sailplane shape) or the Clark-Y repeatedly tested by the NACA (32,a) in thickness ratios between 6 and 22% (31,e) or the British RAF-34, had a thickness ratio in the order of 12%, a thickness location around 30% and some camber; see figure 3. The first systematic series of sections named after Joukowsky (4,a) who established the mathematical method of producing their shape and predicting their circulation, is similar in shape to those first sections. A number of 36 of these “theoretical” sections were tested at Gottingen (7,a) at Rc= 4 (10)5 , with thickness ratios between 6 and 36%, and with camber ratios between zero and 20%. As shown in figure 4, the tail end of these sections (in their original form) is very thin, the leading edge is round, with the maximum thickness in the vicinity of but 25% of the chord.
|
|
RAE-34 (31,e), (12.6/1.8)4 CLx = 1 .49 at Rq = 3(Ю)6
SYSTEMATIC SERIES. To establish some order, several series (families) of practical foil sections have been developed, by systematic variation of their geometry.
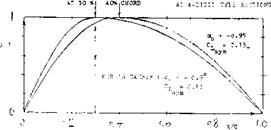
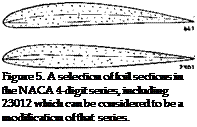
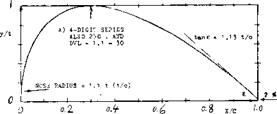
(a) The so-called 4-digit series was published by the NACA (31,a) in 1933, intended to be used in practical design and construction of airplane wings. The maximum thickness in this family is located at 30% of the chord (see figure 6) thus reflecting the earlier empirical result that such sections are most efficient, at the moderate speeds then considered.. Thickness ratios tested (first in the very turbulent Variable Density Tunnel) are between 3 and 25%, later extended to 35%(32,c). Camber ratios are up to 7%, with locations between 20 and 70% of the chord (see figure 25). Selected shapes of this series are shown in figure 5.
An example of this series is
2 4 1 2 — thickness t/c = 12%
Lcamber location at 0.4 chord camber ‘ f; = 2% of the chord
The 4-digit series was later modified (37) as to nose radius and location of the maximum thickness by adding numbers, as for example:
2412-34 — location at 0.4 chord ^indicating the nose radius
As to the nose radius, ‘O’ indicates zero
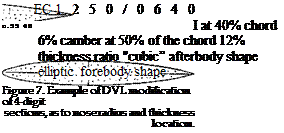
(c) Another modification of the 4-digit series was introduced by the Germans (34), adding digits to indicate nose radius and thickness location much in the same manner as under
(a) above. Example:

 0012 – 0.55 40—thickness location 0.4 c
I
one half original nose radius Nose radii were tested between
r c/t2 = 0.275 and 1.10 = (r/t)/(t/c) (1)
where 1.10 indicates the original nose shape of the 4-digit series, and 0.275 one quarter of that; see figure 7.
radius, ‘3’ (as in the example) 1/4 original size, ‘6’ as in the original 4-digit section and ‘9; three times the original radius.
(b) After disappointing experimentation with reflexed camber lines (8) the 5-digit series was developed at the NACA (33). By making the mean line perfectly straight, aft of 0.2 or so of the chord, the pitching moment Cmo was reduced to “nothing.” Regarding thickness distribution, this series is the “same” as the
4- digit type above. The most famous of the family is the
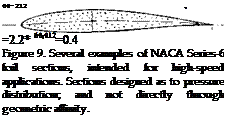
(d) With the advent of higher speeds, it became necessary to vary the position of the maximum thickness. Two things are expected to be obtained by moving the thickness back to between 40 and 50% (and by reducing the nose radius at the same time) preservation of laminar flow (lower drag) and postponement of the critical speed (Mach number) brought on by compressibility. An example of the most – widely used so-called 6-series sections (38,b) of the NACA is
6 4 – 2 1 2 — thickness ratio 12%
^ design lift coefficient Cl=-0.2 location of minimum pressure at 0.4 c NACA series designation for such sections
 ! 3 0 1 2 — thickness t/c = 12%
Ltwice the camber location at 0.15 chord design lift coefficients 0.2
It must be noted that the geometric camber is replaced by the theoretical “design” lift coefficient (see figure 27).
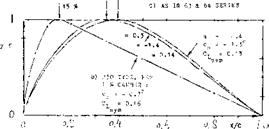
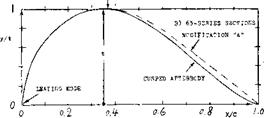 Figure 6. Thickness distribution (shape) of several NACA systematic series of airfoil sections. [17] [18]
|
The designation ‘6’ indicates a certain type of the pressure distribution obtained by thickness distribution. This series was tested almost exclusively in a two-dimensional (between walls) closed-type wind tunnel (38) at Langley Field, with minimum pressure locations between 0.3 and 0.6 of the chord (see figures 6 and 9) and in thickness ratios between 6 and 21%. Certain modifications were investigate:! later (37,b) (38, e). An’A’in place of the hyphen, indicates that the cusped tail of these sections is filled up so that a wedge shape results. Sometimes an indication of a particular shape of the camber line is added in the form cf “a=0.6” for example, where ‘0.6’ means one of the 11 mean lines (varying in location) described in (38,b). Without this indication, it is understood that, for example, one of the two camber shapes as in figure 8 has been use:! in designing the section. * Other series are provided for in the NACA system corresponding to the first digit between T and ‘8’, which all seem to indicate variations of the pressure distribution. Only a few examples of sections other than ‘6’ have been published (16). The ’16’ series is used in hydrodynamics. |
 |
|
 |
|
|
|
|
|
|
|
|
|
|
|
|
|
 |
|
|
|
|
|
|
|

![]()
![]()

![]()

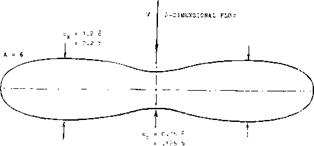
FLOW DINFLECTION. As far as airplane wings are concerned, their flow pattern is never two-dimensional. Because of the limitation of their span, the flow of fluid gets more or less permanently deflected by such wings so that the sections are actually exposed to a curved stream of air. As a consequence, their characteristics such as pitching moment due to camber in particular, must be expected to vary as a function of the aspect ratio. In closed wind tunnels, floor and ceiling more or less resist any deflection (up or down) of the stream by a lifting foil. On the other hand, investigation of wings or airfoils in open-jet wind tunnels (where the stream of air gets too much deflected) can lead to errors opposite in sign to those in closed tunnels. Statistical experience such as in (6) indicates that lift- curve slopes in the NACA two-dimensional closed tunnel set-up (38) are somewhat too high, while those from the open-jet DVL tunnel
(34) are somewhat too low. Reduced to two- dimensional condition, the differentials are in the order of plus/ minus 5%. We have in the graphs given preference to results obtained from airfoils with A = 5 or 6. In other words, we will deal with average wings and not with sections, in the end results. [19] [20] [21] [22]
|
Figure 10. Planform of a wing (9) designed so that it experiences, along center line, two-dimensional flow (no downwash). |


