Airflow Behavior: Laminar and Turbulent
Understanding the role of the viscosity of air is important to aircraft designers. The simplification of considering air as inviscid may simplify mathematics, but it does not represent the reality of design. Inviscid fluid does not exist, yet it provides much useful information rather quickly. Subsequently, the inviscid results are improvised. To incorporate the real effects of viscosity, designs must be tested to substantiate theoretical results.
The fact that airflow can offer resistance due to viscosity has been understood for a long time. Navier in France and Stokes in England independently arrived at the same mathematical formulation; their equation for momentum conservation embedding the viscous effect is known as the Navier-Stokes equation. It is a nonlinear partial differential equation still unsolved analytically except for some simple body shapes. In 1904, Ludwig Prandtl presented a flow model that made the solution of viscous-flow problems easier [2]. He demonstrated by experiment that the viscous effect of flow is realized only within a small thickness layer over the contact surface boundary; the rest of the flow remains unaffected. This small thickness layer is called the boundary layer (Figure 3.3). Today, numerical methods (i. e., CFD) can address viscous problems to a great extent.
 . Boundary layer over a flat plate

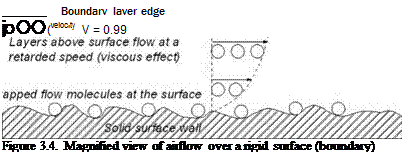
The best way to model a continuum (i. e., densely packed) airflow is to consider the medium to be composed of very fine spheres of molecular scale (i. e., diameter 3 x 10⁻⁸ cm and intermolecular space 3 x 10⁻⁶ cm). Like sand, these spheres flow one over another, offering friction in between while colliding with one another. Air flowing over a rigid surface (i. e., acting as a flow boundary) will adhere to it, losing velocity; that is, there is a depletion of kinetic energy of the air molecules as they are trapped on the surface, regardless of how polished it may be. On a molecular scale, the surface looks like the crevices shown in Figure 3.4, with air molecules trapped within to stagnation. The contact air layer with the surface adheres and it is known as the “no-slip” condition. The next layer above the stagnated no-slip layer slips over it – and, of course, as it moves away from the surface, it will gradually reach the airflow velocity. The pattern within the boundary layer flow depends on how fast it is flowing.
Here is a good place to define the parameter called the Reynolds Number (Re). Re is a useful and powerful parameter – it provides information on the flow status with the interacting body involved:
Re = (pTO U^l )/цто (3.16)
= (density x velocity x length)/coefficient of viscosity = (inertia force)/(viscous force)
where = coefficient of viscosity.
 |
Free steam velocity,
Figure 3.5. Viscous effect of air on a flat plate
 It represents the degree of skin friction depending on the property of the fluid. The subscript infinity, to, indicates the condition (i. e., undisturbed infinite distance ahead of the object). Re is a grouped parameter, which reflects the effect of each constituent variable, whether they vary alone or together. Therefore, for a given flow, characteristic length, l, is the only variable in Re. Re increases along the length. In an ideal flow (i. e., inviscid approximation), Re becomes infinity – not much information is conveyed beyond that. However, in real flow with viscosity, it provides vital information: for example, on the nature of flow (turbulent or laminar), on separation, and on many other characteristics.
Figure 3.3 describes a boundary layer of airflow over a flat surface (i. e., plate) aligned to the flow direction (i. e., X axis). Initially, when the flow encounters the flat plate at the leading edge (LE), it develops a boundary layer that keeps growing thicker until it arrives at a critical length, when flow characteristics then make a transition and the profile thickness suddenly increases. The friction effect starts at the LE and flows downstream in an orderly manner, maintaining the velocity increments of each layer as it moves away from the surface – much like a sliding deck of cards (in lamina). This type of flow is called a laminar flow. Surface skin-friction depletes the flow energy transmitted through the layers until at a certain distance (i. e., critical point) from the LE, flow can no longer hold an orderly pattern in lamina, breaking down and creating turbulence. The boundary layer thickness is shown as S at a height where 99% of the free streamflow velocity is attained.
The region where the transition occurs is called the critical point. It occurs at a predictable distance from the LE lcrit, having a critical Re of Recrit at that point. At this distance along the plate, the nature of the flow makes the transition from laminar to turbulent flow, when eddies of the fluid mass randomly cross the layers. Through mixing between the layers, the higher energy of the upper layers energizes the lower layers. The physics of turbulence that can be exploited to improve performance (e. g., dents on a golf ball forces a laminar flow to a turbulent flow) is explained later.
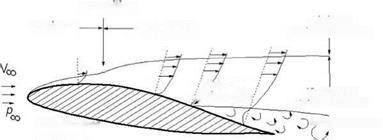
With turbulent mixing, the boundary layer profile changes to a steeper velocity gradient and there is a sudden increase in thickness, as shown in Figure 3.5. For each kind of flow situation, there is a Recrit. As it progresses downstream of lcrit, the turbulent flow in the boundary layer is steadily losing its kinetic energy to overcome resistance offered by the sticky surface. If the plate is long enough, then a point may be reached where further loss of flow energy would fail to negotiate the surface constraint and would leave the surface as a separated flow (Figure 3.6 shows separation on an aerofoil). Separation also can occur early in the laminar flow.
The extent of velocity gradient, du/dy, at the boundary surface indicates the tangential nature of the frictional force; hence, it is shear force. At the surface where
|
(a) Inviscid flow (p1=p2) (b) Viscous flow (p1 > p2) (c) Dented surface (p1 > p2) Figure 3.6. Airflow past aerofoil |
u = 0, du/dy is the velocity gradient of the flow at that point. If F is the shear force on the surface area, A, is due to friction in fluid, then shear stress is expressed as follows:
F / A = t = ^(du/dy), (3.17)
where л is the coefficient of viscosity = 1.789 x 10⁻⁵kg/ms or Ns/m2 (1g/ms = 1 poise) for air at sea level ISA. Kinematic viscosity, v = ЛP m2/s (1 m2/s = 104 stokes), where p is density of fluid. The measure of the frictional shear stress is expressed as a coefficient of friction, Cf, at the point:
coefficient of friction, Cf = T/qm, (3.18)
where qTO = 1 pV2 = dynamic head at the point.
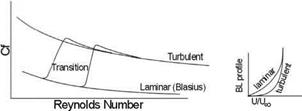
The difference of du/dy between laminar and turbulent flow is shown in Figure 3.6a; the latter has a steeper gradient – hence, it has a higher Cf as shown in Figure 3.6b. The up arrow indicates increase and vice versa for incompressible flow, temp лі, which reads as viscosity decreases with a rise in temperature, and for compressible flow, tempi лі.
The pressure gradient along the flat plate gives dp/dx = 0. Airflow over the curved surfaces (i. e., 3D surface) accelerates or decelerates depending on which side of the curve the flow is negotiating. It results in a pressure field variation inverse to the velocity variation (dp/dx = 0).
Extensive experimental investigations on the local skin friction coefficient, Cf, on a 2D flat plate are available for a wide range of Res (the typical trend is shown in Figure 3.5). The overall coefficient of skin friction over a 3D surface is expressed as CF and is higher than the 2D flat plate. Cf increases from laminar to turbulent flow, as can be seen from the increased boundary layer thickness. In general, CF is computed semi-empirically from the flat plate Cf (see Chapter 9).
To explain the physics of drag, the classical example of flow past a sphere is shown in Figure 3.6. A sphere in inviscid flow will have no drag (Figure 3.6a) because it has no skin friction and there is no pressure difference between the front and aft ends, there is nothing to prevent the flow from negotiating the surface curvature. Diametrically opposite to the front stagnation point is a rear stagnation point, equating forces on the opposite sides. This ideal situation does not exist in nature but can provide important information.
 Transition
Figure 3.7. Flow past a sphere
In the case of a real fluid with viscosity, the physics changes nature of offering drag as a combination of skin friction and the pressure difference between fore and aft of the sphere. At low Re, the low-energy laminar flow near the surface of the smooth sphere (Figure 3.6b) separates early, creating a large wake in which the static pressure cannot recover to its initial value at the front of the sphere. The pressure at the front is now higher at the stagnation area, resulting in a pressure difference that appears as pressure drag. It would be beneficial if the flow was made turbulent by denting the sphere surface (Figure 3.6c). In this case, high-energy flow from the upper layers mixes randomly with flow near the surface, reenergizing it. This enables the flow to overcome the spheres curvature and adhere to a greater extent, thereby reducing the wake. Therefore, a reduction of pressure drag compensates for the increase in skin-friction drag (i. e., Cf increases from laminar to turbulent flow). This concept is applied to golf-ball design (i. e., low Re velocity and small physical dimension). The dented golf ball would go farther than an equivalent smooth golf ball due to reduced drag. Therefore:
drag = skin friction drag + pressure drag (3.19)
The situation changes drastically for a body at high Re (i. e., high velocity and/or large physical dimension; e. g., an aircraft wing or even a golf ball hit at a very high speed that would require more than any human effort) when flow is turbulent almost from the LE. A streamlined aerofoil shape does not have the highly steep surface curvature of a golf ball; therefore, separation occurs very late, resulting in a thin wake. Therefore, pressure drag is low. The dominant contribution to drag comes from skin friction, which can be reduced if the flow retains laminarization over more surface area (although it is not applicable to a golf ball). Laminar aerofoils have been developed to retain laminar-flow characteristics over a relatively large part of the aerofoil. These aerofoils are more suitable for low-speed operation (i. e., Re higher than the golf-ball application) such as gliders and have the added benefit of a very smooth surface made of composite materials.
Clearly, the drag of a body depends on its profile – that is, how much wake it creates. The blunter the body, the greater the wake size will be; it is for this reason that aircraft components are streamlined. This type of drag is purely viscous-dependent and is termed profile drag. In general, in aircraft applications, it is also called parasite drag, as explained in Chapter 9.
Scientists have been able to model the random pattern of turbulent flow using statistical methods. However, at the edges of the boundary layer, the physics is
unpredictable. This makes accurate statistical modeling difficult, with eddy patterns at the edge extremely unsteady and the flow pattern varying significantly. It is clear why the subject needs extensive treatment (see [2]).


