Comparison with Other Facilities
Measurements in other facilities can provide a basis of comparison for the lift and drag obtained in this project. Unfortunately, it is difficult to make a broad range of’systematic comparisons because relatively few of the airfoils tested in this project have been tested in other facilities at the same Reynolds numbers. Until recently the primary application for airfoils operating at Reynolds numbers considered here was for model aircraft. Consequently, little effort was directed at designing and testing airfoils in the Reynolds number range 60к < Rn < 300&. The majority of available data with which to compare the Princeton data is from the Model Wind Tunnel at Stuttgart7,3’10; however, comparisons were also made to data obtained from NASA Langley11, Delft8’12, and Notre Dame13’14.
Comparisons of the available drag polars are shown in Figs. 2.9 through 2.20, and comments are provided in several cases. A listing is given at the end of the discussion.
Fig. 2.10 compare drag polars obtained in the Princeton tunnel (using the E205B-PT model) with those in the Delft tunnel8 and in the Model Wind Tunnel at Stuttgart7 for the E205 at Reynolds numbers of 60k, 100k, and 200k. At 200k all three facilities agree to within 10% over the central region of the lift range. The agreement between Delft and Princeton data at 100k is also quite good. However, at 60k the agreement is worse.
Stuttgart tests of the S3021 in 1986 are compared to the Princeton data in Fig. 2.20 for Reynolds numbers of 100k and 200k. Overall agreement is reasonable; however, the Princeton drag values are generally lower. A comparison with Stuttgart data from 1980 on the NACA 0009 is shown in Fig. 2.18. In this case, the Stuttgart data indicates lower drag throughout much of the lift range. Results of the S2091 are compared with Stuttgart (1986) in Fig. 2.19.
At Reynolds numbers of 100k and below, the agreement is poor, with Stuttgart generally finding higher drag. By 200k, the agreement is quite good.
Comparisons were also made with data from Notre Dame as shown in Figs. 2.16 and 2.17. In the case of the FX63-137, the Notre Dame data indicates a significantly higher drag than either the Stuttgart or Princeton values.
Fig. 2.13 shows a comparison of the E387 data from the present work to that from the NASA Langley11, Delft12, and Stuttgart9. Note that the E387 model used in the Princeton test (E387A-PT) is decambefed (see Fig. 10.13) which is reflected by a shift in the polar to lower lift values. The camber error is approximately 0.4%. Nevertheless, the general agreement between the data from the NASA Langley, Delft, and Princeton is good.
The discrepancies found in these comparisons are primarily due to differences in (1) flow quality, (2) accuracy of measurements, (3) methods of measurement, and (4) model accuracy. At this time it is difficult to determine how much of the disagreement is due to each of these areas, but we have documented those of the present project to allow for future comparisons.
Fig. 2.9 CLARK-Y-PT vs CLARK-Y (Althaus, 1980)9
Fig. 2.10 E2Q5B-PT vs E205 comparisons 7,8
Fig. 2.11 E214B-PT vs E214 (Althaus, 1986)7
Fig. 2.12 E374B-PT vs E374 (Althaus, 1985)10
Fig. 2.13 E387A-PT vs E387 comparisons s>11>12
Fig. 2.14 FX60-100-PT vs FX60-100 (Althaus, 1980)9
Fig. 2.15 FX63-137B-PT vs FX63-137 (Althaus, 1980)9
Fig. 2.16 FX63-137B-PT vs FX63-137 (Bastedo and Mueller, 1985)14
Fig. 2.17 M06-13-128-PT vs M06-13-128 (Pohlen and Mueller, 1983)13
Fig. 2.18 NACA 0009-PT vs NACA 6009 (Althaus, 1980)9
Fig. 2.19 S2091B-PT vs S2091 (Althaus, 1986)7
Fig. 2.20 S3021A-PT vs S3021 (Althaus, 1986)7

 |
|
|
|
 |
|
|
|
|
|
 |
|
|
|
|
|
|
|
|
|
|
|
|
|
|
|
|
|
|
|
|


|
|
|
|
|
Fig. 2.3 Coordinate Measuring Machine (CMM) used for digitizing. |
|
Fig. 2.4 Holding Fixture for digitizing the test sections. |
|
37 |
31/1 |
XZ POINT X= 13.6939 Z= -1.1266 |
|
|
38 |
32/1 |
X Z POINT X= 13.7193 Z= -1.2182 |
! Upper L. E. |
|
13 |
7/1 |
XZ POINT X= 13.7199 Z= -0.7423 |
! Lower L. E. |
|
15 |
9/1 |
XZ POINT X= 13.6941 Z= -0.6770 |
|
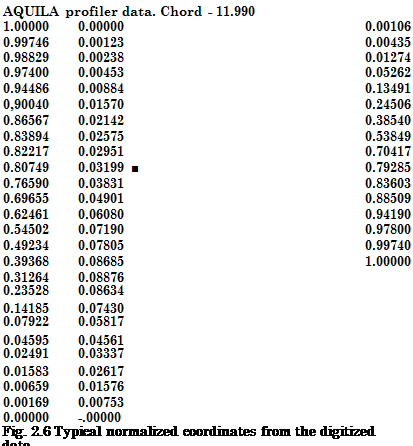
Fig. 2.5 Typical CMM digitized data. |
 |
|
|
. 2.7 Test rig indicating model orientation and lift measurement method. (Plexiglas end plates are not shown for clarity.)
|
|
CLARK-Y-PT vs CLARK-Y (Althaus, 1980)
60.0 ![]() Princeton
Princeton
100.0 Princeton
200.0 Princeton
60.0 Model W. T. at Stuttgart
100.0 Model W. T. at Stuttgart
200.0 Model W. T. at Stuttgart
|
0.5 |
|
0.00 0.01 0.02 0.03 0.04 0. |
|
-0.5 0.0 |
E374B-PT vs E374 (Althaus, 1985)
60.0 Princeton
100.0 Princeton
200.0 Princeton
60.0 Model W. T. at Stuttgart
100.0 Model W. T. at Stuttgart
200.0 Model W. T. at Stuttgart
|
Fig. 2.13 Comparison polars: E387A-PT vs NASA LTPT, Delft University, and Stuttgart. |
E—387 data comparison for Rn = 200,000
G Princeton a NASA Langley LTPT 0 Low—Turbulence Tunnel at Delft v Model Wind Tunnel at Stuttgart
E—387 data comparison for Rn = 60,000
° Princeton
NASA Langley LTPT Low—Turbulence Tunnel at Delft Model Wind Tunnel at Stuttgart
FX60-100-PT vs FX60-100 (Althaus, 1980)
G 60,000 Princeton 0 100,000 Princeton A 200,000 Princeton s 60,000 Model W. T. at Stuttgart ® 100,000 Model W. T. at Stuttgart v 200,000 Model W. T. at Stuttgart
FX63-137B-PT vs FX63-137 (Mueller, 1985)
B 100,000 Princeton A 200,000 Princeton ш 100,000 Notre Dame
V 9ПП ODD Nntr#=> Пптр
0.00 0.01 0.02 0.03 0.04 0.05
Fig. 2.18 Comparison polars: NACA 0009-PT vs Stuttgart.


