PITCHING-MOMENT CHARACTERISTICS
The center of lift of a thin and straight foil section is theoretically at 25% of the chord. Actually, the boundary layer changes this condition somewhat and as soon as there is camber involved, the mechanism of longitudinal moment is different altogether.
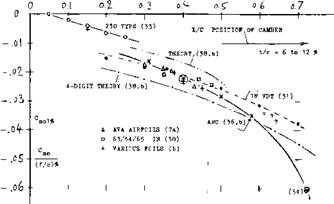
ZERO-LIFT MOMENT. For positive amounts of camber, the component Cmo (in equation 22) is always negative. This means that the bent-down trailing edge tries to lift that edge up, in a manner similar to that of a wing – or control flap. The value of Cmo increases in proportion to the camber ratio (f/c); and figure 30 shows how the coefficient per 1% of camber, varies as a function of camber position. Tested values do not agree with the theoretical functions. The deviation increases, as the thickness ratio is increased above some 12%. Results in the graph are not very consistent. After ruling out theoretical functions and the VDT data, one may say, however, that the most widely used foil sections have a zero-lift moment roughly corresponding to
Cm0 = (0.05 to 0.06) (x/c) (f/сГ/о
![]()

CENTER OF LIFT. Tiie longitudinal or pitching moment is designated to be positive when it tends to increase the angle of attack. The moment is generally made up of two components:
cm = M/q S с = Q., + CJdC^/dCL (22)
where the dots (.) indicate that the reference point is at the leading edge. The quotient C^e/Ct indicates the “center of pressure”, id est the point along the section chord at which the resultant lift force is acting. The derivative
d9«/dCL = x/c (23)
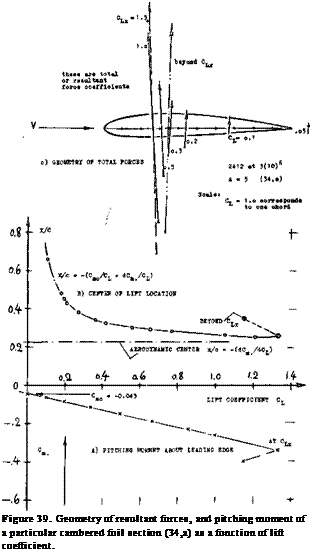
indicates the “aerodynamic center” of the foil section. When taking the moment about this point, the coefficient Cwac is equal to Cmo and constant (within the operational range of the lift coefficient). To demonstrate what equation (22) means in terms of foil and force geometry, figure 39 was prepared, showing location and direction of total forces (composed of lift and drag) of one particular cambered section. We see that the location of the resultant force is far back on the wing chord at lift coefficients below 0.1. This tendency corresponds to Cmo= —0.04 of the section used. The force then moves forward along the chord, as the lift coefficient is increased, approaching the “aerodynamic center” corresponding to dCw/dCL. The display os in part (A) of figure 39 has a practical advantage (and it was used in the early years of airplane and/or biplane design for that reason). There is a particular point (or a narrow region) below the foil section where most of the force lines shown, meet and cross each other. When placing the CG of an airplane in that point, wing moments are near zero over most of its speed range (except for very high speeds where the moment corresponding to Cmo predominates). Modem analysis of longitudinal stability and control is based upon equation (22) however.

![]()

 REFLEXED CAMBER. Any pitching moment at zero lift is undesirable because it produces structural strain in, and elastic twisting of the wings of an airplane when diving (or when at maximum speed). To reduce the value of Q*0#reflexed camber lines were thus investigated (8). The idea was, to camber the section nose into the oncoming flow, while at the same time a bent-up trailing edge would compensate for that camber, thus reducing the pitching moment to “nothing”. Experiments in various places confirmed that the moment was reduced as desired. The trailing edge is very important, however, in producing circulation. As a consequence, higher angles of attack (measured against the chord line) are required to obtain a certain lift coefficient, when bending the trailing edge up. In short, the sections developed, were not very efficient as to (L/D) and maximum lift. A better solution was found in the 23012 type sections (33) where most of the mean line is straight, while camber is concentrated near the leading edge (around 15% of the chord, see figure 8). Figure 40 proves that Cmo is reduced to roughly half of what it is in other sections having the same location of camber, and to a small fraction of that in “conventional” sections.
|
Figure 40. Pitching moment at zero lift caused by camber, as function of camber location. |
3(1o)6
HELICOPTER BLADES. Reflexed sections (without twisting moments) are of interest in the design of rotor blades. A series of 6 such sections varying in thickness and camber, are described in (4-7). Shape and characteristics of two of them are shown in figure 41- Both of them are “better” than the 0012 or 23012 sections, data for which are listed in parentheses, “for most of the flight conditions” of the helicopter considered. The fact that lift = f (angle) is not exactly linear, is the consequence of the tail shape and of the drag coefficient varying around CLopt. As intended, the pitching, moment is small, taken around the aerodynamic center. The reflexion is around 80% of the chord. Camber (near 1/3 of the chord) is between 3 and 4%. The aerodynamic center is 1% or 2% more aft than in conventional sections; more lift is produced around the leading edge.
AERODYNAMIC CENTER. In symmetrical sections, the due-to-lift component in the second term of equation ( 22) is expected to be all of the pitching moment. This moment is equal to lift times moment arm x. In a cambered section, the derivative dCm. /dCi (always negative) indicates the “aerodynamic center”, id est the point about which C^, = Cmo = constant; thus :
![]() x/c =r —dCm./dCL (25)
x/c =r —dCm./dCL (25)
where x = distance (considered to be positive) behind the leading edge. The aerodynamic center is usually evaluated (53,a) from wind-tunnel tests, and tabulated for the many foil shapes investigated. Another point about which the pitching moment can be taken, is the aerodynamic center theoretically expected for zero thickness ratio, id est the quarter point of the chord. Since this point is not necessarily the aerodynamic center, there usually remains a derivative, and the differential of the location is
Дх/с = — dCm/^/dCL (26)
where the ‘4’ indicates the quarter-chord point. Since the aerodynamic center is at that point only by coincidence, we prefer to define the pitching moment about the leading edge. This type of moment is
dCm/dCL= (dCm/Jt/dCL) – 0.25

![]()
![]()
![]()
![]()


 IN CLOSED WIND TUNNELS:
• NACA, V’DENSI TU (31)
° 4-DIGIT, 2-DIM’L (38)
I 63/64 MODIFIED A (37)
CUSPED (CLOSED) JOUKOVSKY – 63/64 2-DIM’L (38)
a AVA, JOUKOVSKY (4,b)
2o 2Г Зо
—»——- 1——– ‘——– 1—–
THICKNESS RATIO t/a % -0.1 -0.3 -0.4
SECTION THICKNESS. Theory expects the distance x in equation (25) to grow with the section thickness ratio. However, as shown in figure 32, the aerodynam ic center is in reality, usually somewhat ahead of 25%; and it does not move downstream as the thickness ratio is increased. As a consequence of momentum losses in the boundary layer, at the suction side, near the trailing edge, a high angle of attack is obviously required to obtain a certain lift coefficient. The deficient amount of lift is then produced near the leading edge, so that a positive differential of the pitching moment is obtained. Through the same mechanism, we must also expect that the aerodynamic center will be shifted further ahead when increasing skin friction (section drag coefficient) through surface roughness.
TRAILING WEDGE ANGLE. It is pointed out in section (b) of this chapter, how much shape and thickness of the trailing edge affects the lift-curve slope. The same and an even more pronounced influcence is found in regard to the pitching moment:
(a) On the basis of investigations in (53,c) it can be said:
A(dCm/dCL) = 4- 0.004 6° = 4-0.23 tan0 (60) where Є = 1/2 trailing-wedge angle.
(b) It can be concluded that
MdCmQ) ~ 4 2(tan£)(tany) « 8(tan£)(f/c) (61)
where у as in figure 27.
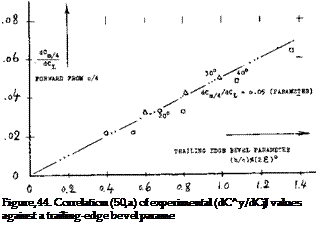
BEVELED TRAILING EDGE. Several modifications of a control flap forming the trailing edge of a foil section are illustrated in figure 43. It is seen in particular, that the aerodynamic center (represented by dC^./dC^) moves forward, when beveling the edge. Note that dCL/doc is reduced at the same time. The effect of beveling is, of course, a function not only of the bevel angle but also of the length of the beveled (chamfered) portion of the chord. Expressing this length by the “thickness’ of the edge as defined in figure 44, a very good correlation (50,a) is obtained of experimental results.
|
|
|
0009 at H0 =■ 3(10)6
|
Figure 43. Influence of trailing-edge modifications (50,a), upon the pitching moment of an 0009 section.
VERTICAL POSITION OF THE AC. As pointed out before, the aerodynamic center is a point of reference for which Cm f= constant. As explained, the location is usually somewhat ahead of 25% of the chord. Figure 45 shows that the point is also somewhat above the section’s chord line. In terms of equation (53) this means that the variation of Cm(CL) is not necessarily a straight line. It is usually possible, however, to find a point somewhat above the chord line for which dCm./dCL is constant, at least over the “useful” range of the lift coefficient, id est excluding higher angles of attack, approaching the stall. Consider in this respect the pitching moment including a component due to the tangential force:
Cno -(x/c)CN +- (z/c)CT (30)
(53) Investigation of camber and pitching moment:
a) Thompson, Aerody Center, J Aeron Sci 1938 p 138.
b) ARC, Determination of C andc, RM 1914 (1944).
c) Purser, Trail-Edge Angle, NACA W Rpt L-664
d) McCullough, 4 10% Sections, NACA TN 2177 (1950).
e) Stivers, 4 Airfoil Sections, NACA TN 3162.
(54) Loftin, 66-210 Camber, NACA TN 1633.
![]()
![]()
![]()
![]() where CN = normal-force coefficient (primarily C(J and Су = tangential-force coefficient. By differentiating this equation against C^, and setting the derivative equal to zero, the location of the aerodynamic center ‘AC’ can be obtained (53). It should be noted that Су ~ C(}5 — Cj_ sine*. Assuming that the section drag coefficient be constant, the divergence of a tested Ст(С^) function from a straight line, is found (l, b) to be C^. The height ‘z’ of the AC above the chord line (measured in the direction normal to the zero lift line) is then approximately
where CN = normal-force coefficient (primarily C(J and Су = tangential-force coefficient. By differentiating this equation against C^, and setting the derivative equal to zero, the location of the aerodynamic center ‘AC’ can be obtained (53). It should be noted that Су ~ C(}5 — Cj_ sine*. Assuming that the section drag coefficient be constant, the divergence of a tested Ст(С^) function from a straight line, is found (l, b) to be C^. The height ‘z’ of the AC above the chord line (measured in the direction normal to the zero lift line) is then approximately
z/c =. — 7 ACVCl (64)
where AC*, = deviation in the range of small and intermediate lift coefficients.
• IB TOT
. * П F8f
– ARC IB (56
z/c #
JT– 30% i/o.
Thickness Ratio
Figure 45. Vertical position of the aerodynamic center
for various types of foil sections.
![]()
|
h/t = 3 mm ACd = 0. 01 ACd = 0. 02 ACL = – 0.1 AC* – 0. 02 |


0009
ter.
THICKNESS RATIO. Since the two-dimensional testing method (38) is the only one yielding negative values or z/c, we are inclined to disregard these results (21). We can then say that according to figure 45, z/c increases with the thickness ratio. The boundary layer developing toward the trailing edge, seems to be responsible for this result. Necessarily, the height ‘z’ has to change from above to below the chord line in symmetrical sections, between CL =r plus and minus 0.1, or so. The boundary layer accumulation (and/or separation) switches accordingly, as explained before in connection with figures 17 and 18. By comparison, the variation of z/c with the camber ratio f/c, as found in
(31) is very small. It should be noted, however, that the
5- digit sections (with t/c = 12%) also listed in (31) exhibit z/c values more than twice as high as those reported for the 4-digit airfoils.
WING ICING and its aerodynamic penalties are reported in (45). Typical conditions are as follows:
(a) icing rate
(b) forh/c — 1%
(c) at C^– 0.6 loss of lift (c) pitching moment
The rate (a) is per minute of time 4t As in (b) the ice accumulates “in” the stagnation point of the ООП section (45,b) at zero angle of attack, to the thickness ‘h Thesattne can be expected for a cambered section when flying at In case (c) there is a considerable flow
around the leading edge. As a consequence, ice deposits itself not only forward, but also upward of the edge, thus forming a ridge across the high-speed flow of air. The maximum section-drag coefficient thus observed (in climbing flight condition) is in the order of 0.04, the loss of lift corresponds to ACl = — 0.2, and the pitch – up moment to &Cm -= 4- 0.04. The time used in these tests, was in the order of Y = 10 minutes, the chord of the 0011 airfoil was c = 2.1 m. With the help of these data, consequences of icing can be estimated for the wing of a real airplane. The combination of insufficient power or thrust, with reduced longitudinal stability can be dangerous.


