AIRFOILS
A considerable amount of experimental and analytical effort has been devoted to the development of airfoils. Much of this work was done by the National Advisory Committee for Aeronautics (NACA), the predecessor of the National Aeronautics and Space Administration (NASA). Reference 3.1 is an excellent summary of this effort prior to 1948. More recently NASA and others have shown a renewed interest in airfoil development, particularly for application to helicopter rotor blades, general aviation aircraft, and aircraft operating at transonic speeds of Mach 0.7 or higher.
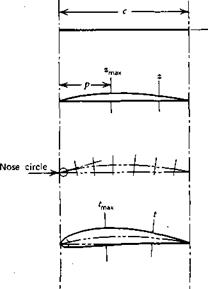
The development of an unflapped airfoil shape is illustrated in Figure 3.2. First, in Figure 3.2a, the chord line, c, is drawn. Next in Figure 3.2b, the camber line is plotted up from the chord a small distance z, which is a function of the distance from the leading edge. Next, as shown in Figure 3.2c, the semithickness is added to either side of the camber line. Also, the nose circle is centered on a tangent to the camber line at the leading edge and passes through the leading edge. Finally, an outer contour is faired around the skeleton to form the airfoil shape. Observe that the chord line is the line joining the ends of the mean camber line.
The early NACA families of airfoils were described in this way, with the camber and thickness distributions giveir as algebraic functions of the chordwise position. However, for certain combinations of maximum thick- ness-to-chord ratios, maximum camber-to-chord ratios, and chordwise posi-
|
|
|
|
|
|
|
|
|
tion of maximum camber, tabulated ordinates for the upper and lower surfaces are available (Ref. 3.1). f
Before discussing the various families of airfoils in detail, we will generally consider the aerodynamic characteristics for airfoils, all of which can be influenced by airfoil geometry.
To begin, an airfoil derives its lift from the pressure being higher on the lower surface of the airfoil than on the upper surface. If a subscript l denotes lower surface and “m” denotes upper surface, then the total lift (per unit span) on the airfoil will be [1]
mLE (l/2)pVV (3’8)
Note that lowercase subscripts are used to denote coefficients for a two-dimensional airfoil, whereas uppercase subscripts are used for the three – dimensional wing.
Writing
Pi ~ Pu Pi ~ Po Pm ~ Po (1 mpV2 (l/2)pV2 (l/2)pV2
and redefining x as the distance in chord lengths from the leading edge, Equations 3.5 and 3.6 become
G= f (CPI – CPu) dx (3.9)
JO
and
CmLE = ~ j0 ~ *^X (3.10)
where the upper and lower pressure coefficients are defined according to Equation 2.73.
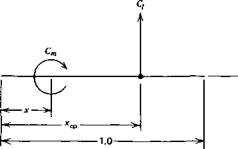
The moment calculated from Equation 3.10 can be visualized as being produced by the resultant lift acting at a particular distance back from the leading edge. As a fraction of the chord, the distance xcp to this point, known as the center of pressure, can be calculated from
-XcpCi = CmLE (3.11)
Knowing xcp, the moment coefficient about any other point, jc, along the airfoil can be written, referring to Figure 3.3, as
Cm = – (xcp – *) Cl (3.12)
|
Figure 3.3 Dimensionless moment at x produced by dimensionless lift acting at |
It will be shown later that a point exists on an airfoil called the aerodynamic center about which the moment coefficient is constant and does not depend on Q. Denoting the location of the aerodynamic center by xac, Equation 3.12 can be solved for the location of the center of pressure.
|
|
Do not confuse the aerodynamic center with the center of pressure. Again, the aerodynamic center is the location about which the moment is constant, the center of pressure is the point at which the resultant lift acts.
The progressive development of an airfoil shape is illustrated by reference to Figure 3.4a and 3.4b. Historically airfoils developed approximately in this manner. Consider first the simple shape of a thin, flat plate.
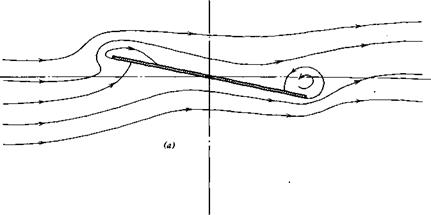
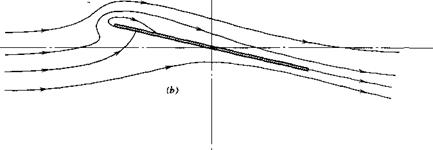
Beginning with Figure 3.4a if the angle of attack of a thin, flat plate is suddenly increased from zero, the flow will appear for a moment as shown. Because of near-symmetry, there is practically no lift produced on the plate. However, because of viscosity, the flow at the trailing edge cannot continue to turn the sharp edge to flow upstream. Instead, it quickly adjusts to the pattern shown in Figure 3.4b. Here the flow leaves nearly tangent to the trailing edge. This condition is known as the Kutta condition after the German scientist, W. M. Kutta, who in 1902 first imposed the trailing edge condition in order to predict the lift of an airfoil theoretically. In Figure 3.4b observe that there is one streamline that divides the flow that passes over the plate from that below. Along this “dividing streamline,” the flow comes to rest at the stagnation point, where it joins perpendicular to the lower surface of the plate near the leading edge. As the flow progresses forward along this line, it is unable to adhere to the surface around the sharp leading edge and separates from the plate. However, it is turned backward by the main flow and reattaches to the upper surface a short distance from the leading edge. The resulting nonsymmetrical flow pattern causes the fluid particles to accelerate over the upper surface and decelerate over the lower surface. Hence, from Bernoulli’s equation, there is a decrease in air pressure above the plate and an increase below it. This pressure difference acting on the. airfoil produces a lift.
If the angle of attack of the plate is too great, the separated flow at the leading edge will not reattach to the upper surface, as shown in Figure 3.4c. When this occurs, the large separated region of unordered flow on the upper surface produces an increase in pressure on that surface and hence a loss in lift. This behavior of the airfoil is known as stall. Thus the limit in Q, that is, Cimsx, is the result of flow separation on the upper surface of the airfoil.
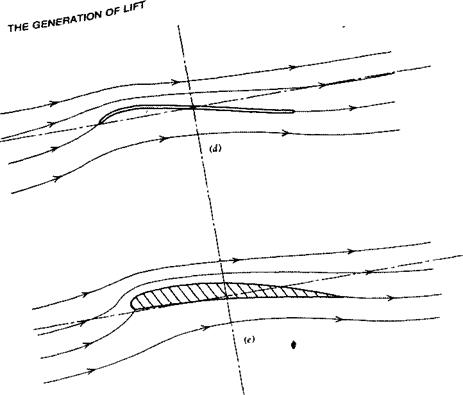
To improve this condition, one can curve the leading edge portion of the flat plate, as shown in Figure 3.4d, to be more nearly aligned with the flow in
|
|
|
|
|
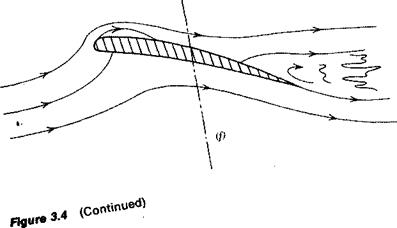
Figure 3.4 Progressive development of airfoil shapes, (a) Flat plate at sudden angle of attack—no lift, (b) Flat plate at angle of attack in steady flow and generating lift, (c) Flat plate experiencing leading edge separation and loss of lift (stall), (d) Flat plate with curved leading edge to prevent leading edge separation, (e) Airfoil with thickness and camber to delay stall, (f) Airfoil with trailing edge separation. |
|
|
|
|
that region. Such a shape is similar to that used by the Wright Brothers. This solution to the separation problem, as one might expect, is sensitive to angle of attack and only holds near a particular design angle. However, by adding thickness to the thin, cambered plate and providing a rounded leading edge, the performance of the airfoil is improved over a range of angles, with the leading edge separation being avoided altogether. Thus, in a qualitative sense, we have defined a typical airfoil shape. Camber and thickness are not needed to produce lift Gift can be produced with a flat plate) but, instead, to increase the maximum lift that a given wing area can deliver.
Even a cambered airfoil of finite thickness has its limitations, as shown in Figure 3.4f. As the angle of attack is increased, the flow can separate initially near the trailing edge, with the separation point progressively moving forward as the angle of attack continues to increase.
The degree to which the flow separates from the leading or trailing edge depends on the Reynolds number and the airfoil geometry. Thicker airfoils with more rounded leading edges tend to delay leading edge separation. This separation also improves with increasing values of the Reynolds number.
Leading edge separation results in flow separation over the entire airfoil and a sudden loss in lift. On the other hand, trailing edge separation is progressive with angle of attack and results in a more gradual stalling. The situation is illustrated in Figures 3.5 and 3.6 (taken from Ref. 3.1). In Figure 3.5 note the sharp drop in Q at an a of 12° for R = 3 x 10⁶, whereas for R = 9 x 10⁶, the lift curve is more rounded, with a gradual decrease in Q beyond an a of 14°. In Figure 3.6, for a thicker airfoil with the same camber, the lift increases up to an angle of approximately 16° for all R values tested. At this higher angle, even for R = 9 x 10⁶, it appears that leading edge separation occurs because of the sharp drop in Q for a values greater than 16°. From a flying qualities standpoint, an airfoil with a well-rounded lift curve is desirable in order to avoid a sudden loss in lift as a pilot slows down the airplane. However, other factors such as drag and Mach number effects must also be considered in selecting an airfoil. Hence, as is true with most design decisions, the aerodynamicist chooses an airfoil that represents the best compromise to conflicting requirements, including nonaerodynamic considerations such as structural efficiency.
Figures 3.5 and 3.6 illustrate other characteristics of airfoil behavior that will be considered in more detail later. Observe that the lift curve, Cj versus a, is nearly linear over a range of angles of attack. Notice also that the slope, dCJda, of the lift curve over the linear portion is unchanged by deflecting the split flap. The effect of lowering the flap or, generally, of increasing camber is to increase C( by a constant increment for each a in the linear range. Thus the angle of attack for zero lift, a0<, is negative for a cambered airfoil. In the case of the 1408 airfoil pictured in Figure 3.5, a0i equals -12.5°, with the split flap deflected 60°.
Figure 3.5 Characteristics of the NACA 1408 airfoil.
|
Section angle of attack, a0, deg Section lift coefficient, C, |
|
Figure 3.6 Characteristics of the NACA 1412 airfoil. |
|
Moment coefficient, Cf |
If a is increased beyond the stall Q will again begin to increase before dropping off to zero at an a of approximately 90°. The second peak in C, is generally not as high as that which occurs just before the airfoil stalls. S. P. Langley, in his early experiments, noted these two peaks in the Q versus a curve but chose to fair a smooth curve through them. Later, the Wright Brothers observed the same characteristics and were troubled by Langley’s smooth curve. After searching Langley’s original data and finding that he, too, had a “bump” in the data, Wilbur Wright wrote to Octave Chanute on December 1, 1901.
“If he (Langley) had followed his observations, his line would probably have been nearer the truth. I have myself sometimes found it difficult to let the lines run where they will, instead of running them where I think they ought to go. My conclusion is that it is safest to follow the observations exactly and let others do their own correcting if they wish” {Ref. 1.1).
To paraphrase the immortal Wilbur Wright, “Do not ‘fudge’ your data—it may be right.”


