Distributions of Inflow and Airloads
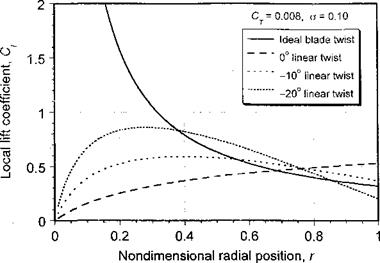
Using the numerical implementation of the BEMT, the distribution of inflow and lift on a blade with any distribution of twist (and planform) can be readily determined. Representative results for X and dCr /dr are shown in Figs. 3.7(a) and (b), respectively, for a rectangular blade with different linear twist rates and at a constant value of thrust. For reference purposes, the distribution corresponding to ideal twist is also shown, which gives a uniform inflow and a linear variation of lift from the root to the tip. Notice that the lift on the untwisted blade is parabolic. With moderate values of twist, the lift distribution becomes more linear, with an off-loading at the tip and a greater loading being produced inboard, and more closely resembles that obtained in the ideal blade twist case. For very high values of blade twist exceeding 20°, the tip is off-loaded to the point that the inflow becomes more nonuniform again and the rotor thereby becomes aerodynamically less efficient.
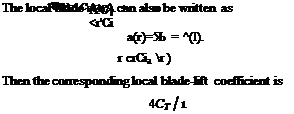
The corresponding local lift coefficient distribution over the blade is found using
with representative results being shown in Fig. 3.8 for different amounts of linear twist. For a rotor with constant blade chord and the ideal twist distribution 0 = 0tiP/r the local lift
|
As previously shown, besides uniform inflow, the ideal twist distribution also gives uniform disk loading. For the ideal rotor (with constant chord, ideal twist, uniform inflow) integration along the blade leads to
о Сі, 4 a Ci
Ct = -^- (% ~ A.) = (3.83)
 |
|
Remember that simple momentum theory gives a value of X = «JCj/2 in hover. Therefore, the blade pitch angle is 6>tjp = oftiP + A so that
which is plotted in Fig. 3.8. This result shows that for a rectangular blade with ideal twist (minimum possible induced power), the lift coefficients become very large at the root end of the blade; thus drag coefficients will increase and rotor performance will ultimately be limited by the onset of stall. Besides the fact that Q (and Cd) increases rapidly when moving inboard from the tip, there can only be one blade station on the blade operating at its best lift-to-drag ratio. Therefore, anything less than the best С/ / Cd must always result in a higher profile power consumption from the rotor than would otherwise be possible.
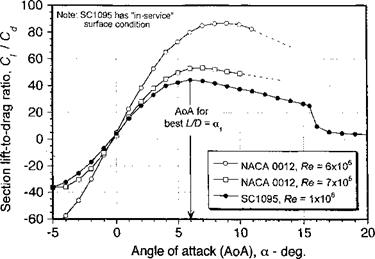
This effect can be seen more clearly if representative lift-to-drag ratios of 2-D airfoils are examined, as shown in Fig. 3.9. In this case, the best Q/Q of the airfoil sections occurs at an AoA between 5 and 10° (denoted as arj), and this operating condition should be the design goal at all blade stations to achieve minimum profile power. The AoA for the
|
Figure 3.9 Representative lift-to-drag ratio of a 2-D airfoil at low angles of attack and low Mach numbers. Data source: Loftin & Smith (1949) and Leishman (1996). |
best Сі/Cd is a function of Mach number as well as Reynolds number and surface finish (roughness) – see Chapter 7. A hovering rotor that is designed to minimize both the induced power and the profile power is called an optimum hovering rotor — see Section 3.3.7.


