Effect of Reynolds number on the CL: a curve
Reduction of Reynolds number moves the transition point of the boundary layer rearwards on the upper surface of the wing. At low values of Re this may permit a laminar boundary layer to extend into the adverse pressure gradient region of the aerofoil. As a laminar boundary layer is much less able than a turbulent boundary layer to overcome an adverse pressure gradient, the flow will separate from the surface at a lower angle of incidence. This causes a reduction of This is a problem that exists in model testing when it is always difficult to match full-scale and model Reynolds numbers. Transition can be fixed artificially on the model by roughening the model surface with carborundum powder at the calculated full-scale point.
Drag coefficient: lift coefficient
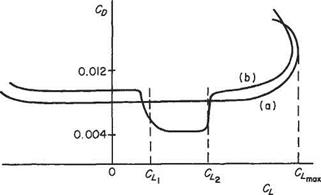
For a two-dimensional wing at low Mach numbers the drag contains no induced or wave drag, and the drag coefficient is Сд0. There are two distinct forms of variation of Cd with Cl, both illustrated in Fig. 1.26.
Curve (a) represents a typical conventional aerofoil with Сд0 fairly constant over the working range of lift coefficient, increasing rapidly towards the two extreme values of Cl- Curve (b) represents the type of variation found for low-drag aerofoil sections. Over much of the Cl range the drag coefficient is rather larger than for the conventional type of aerofoil, but within a restricted range of lift coefficient (Cl, to C^) the profile drag coefficient is considerably less. This range of CL is known as the favourable range for the section, and the low drag coefficient is due to the design of the aerofoil section, which permits a comparatively large extent of laminar boundary layer. It is for this reason that aerofoils of this type are also known as laminar-flow sections. The width and depth of this favourable range or, more graphically, low-drag bucket, is determined by the shape of the thickness distribution. The central value of the lift coefficient is known as the optimum or ideal lift coefficient, Clor Сц ■ Its value is decided by the shape of the camber line, and the degree of camber, and thus the position of the favourable range may be placed where desired by suitable design of the camber line. The favourable range may be placed to cover the most common range of lift coefficient for a particular aeroplane, e. g. may be slightly larger than the lift coefficient used on the climb, and Си may be
|
Fig. 1.26 Typical variation of sectional drag coefficient with lift coefficient |
slightly less than the cruising lift coefficient. In such a case the aeroplane will have the benefit of a low value of the drag coefficient for the wing throughout most of the flight, with obvious benefits in performance and economy. Unfortunately it is not possible to have large areas of laminar flow on swept wings at high Reynolds numbers. To maintain natural laminar flow, sweep-back angles are limited to about 15°.
The effect of a finite aspect ratio is to give rise to induced drag and this drag coefficient is proportional to C, and must be added to the curves of Fig. 1.26.
Drag coefficient: (lift coefficient)2
Since
it follows that a curve of against C will be a straight line of slope (1 + fi)/nA. If the curve Cd0 against C from Fig. 1.26 is added to the induced drag coefficient, that is to the straight line, the result is the total drag coefficient variation with C2L, as shown in Fig. 1.27 for the two types of section considered in Fig. 1.26. Taking an
|
Fig. 1.27 Variation of total wing drag coefficient with (lift coefficient)2 |
|
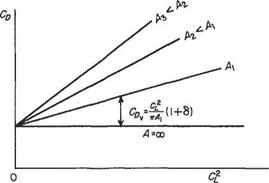
Fig. 1.28 Idealized variation of total wing drag coefficient with (lift coefficient)2 for a family of threedimensional wings of various aspect ratios |
idealized case in which Сд0 is independent of lift coefficient, the CDv:(CL)2 curve for a family of wings of various aspect ratios as is shown in Fig. 1.28.
Pitching moment coefficient
In Section 1.5.4 it was shown that
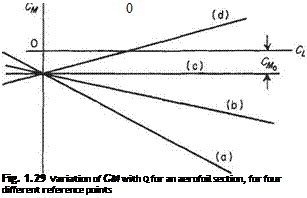
the value of the constant depending on the point of the aerofoil section about which CM is measured. Thus a curve of Cm against Cl is theoretically as shown in Fig. 1.29.
Line (a) for which dCM/dCL — -1 is for Cm measured about the leading edge. Line (c), for which the slope is zero, is for the case where Cm is measured about the aerodynamic centre. Line (b) would be obtained if Cm were measured about a point between the leading edge and the aerodynamic centre, while for (d) the reference point is behind the aerodynamic centre. These curves are straight only for moderate values of Cl – As the lift coefficient approaches C^, the Cm against Cl curve departs from the straight line. The two possibilities are sketched in Fig. 1.30.
 |
|
For curve (a) the pitching moment coefficient becomes more negative near the stall, thus tending to decrease the incidence, and unstall the wing. This is known as a stable break. Curve (b), on the other hand, shows that, near the stall, the pitching moment coefficient becomes less negative. The tendency then is for the incidence to
Fig. 1.30 The behaviour of the pitching moment coefficient in the region of the stalling point, showing stable and unstable breaks
increase, aggravating the stall. Such a characteristic is an unstable break. This type of characteristic is commonly found with highly swept wings, although measures can be taken to counteract this undesirable behaviour.
Exercises
1 Verify the dimensions and units given in Table 1.1.
2 The constant of gravitation G is defined by
![]() mM
mM
where F is the gravitational force between two masses m and M whose centres of mass are distance r apart. Find the dimensions of G, and its units in the SI system.
{Answer. MT2L-3, kg s2 m-3)
3 Assuming the period of oscillation of a simple pendulum to depend on the mass of
the bob, the length of the pendulum and the acceleration due to gravity g, use the theory of dimensional analysis to show that the mass of the bob is not, in fact, relevant and find a suitable expression for the period of oscillation in terms of the other variables. {Answer, t = cy/IJg)
4 A thin flat disc of diameter D is rotated about a spindle through its centre at a speed of u> radians per second, in a fluid of density p and kinematic viscosity v. Show that the power P needed to rotate the disc may be expressed as:
(a)
Note: for (a) solve in terms of the index of v and for (b) in terms of the index of to.
Further, show that cuD2/v, PDjpv3 and P/pu^D5 are all non-dimensional quantities. (CU)
5 Spheres of various diameters D and densities a are allowed to fall freely under gravity through various fluids (represented by their densities p and kinematic viscosities v) and their terminal velocities V are measured.
Find a rational expression connecting V with the other variables, and hence suggest a suitable form of graph in which the results could be presented.
Note: there will be 5 unknown indices, and therefore 2 must remain undetermined, which will give 2 unknown functions on the right-hand side. Make the unknown indices those of a and v.
![]()
{Answer: V = [Dg f h^ VDg’j, therefore plot curves of
6 An aeroplane weighs 60 000 N and has a wing span of 17 m. A l/10th scale model is tested, flaps down, in a compressed-air tunnel at 15 atmospheres pressure and 15 °С
at various speeds. The maximum lift on the model is measured at the various speeds, with the results as given below:
Speed (ms-1) 20 21 22 23 24
Maximum lift (N) 2960 3460 4000 4580 5200
Estimate the minimum flying speed of the aircraft at sea-level, i. e. the speed at which the maximum lift of the aircraft is equal to its weight. (Answer: 33 m s"1)
7 The pressure distribution over a section of a two-dimensional wing at 4° incidence
may be approximated as follows: Upper surface; Cp constant at —0.8 from the leading edge to 60% chord, then increasing linearly to +0.1 at the trailing edge: Lower surface; Cp constant at —0.4 from the LE to 60% chord, then increasing linearly to +0.1 at the ТЕ. Estimate the lift coefficient and the pitching moment coefficient about the leading edge due to lift. {Answer. 0.3192; —0.13)
8 The static pressure is measured at a number of points on the surface of a long circular cylinder of 150 mm diameter with its axis perpendicular to a stream of standard density at 30 ms-1. The pressure points are defined by the angle в, which is the angle subtended at the centre by the arc between the pressure point and the front stagnation point. In the table below values are given of p — po, where p is the pressure on the surface of the cylinder and po is the undisturbed pressure of the free stream, for various angles в, all pressures being in N m-2. The readings are identical for the upper and lower halves of the cylinder. Estimate the form pressure drag per metre run, and the corresponding drag coefficient.
в (degrees) 0 10 20 30 40 50 60 70 80 90 100 110 120
p-po (Nm-2) +569 +502 +301 -57 -392 -597 -721 -726 -707 -660 -626 -588 -569
For values of в between 120° and 180°, p – po is constant at -569 Nm 2.
(Answer: CD = 0.875, D = 7.25 Nm"1)
9 A sailplane has a wing of 18 m span and aspect ratio of 16. The fuselage is 0.6 m wide at the wing root, and the wing taper ratio is 0.3 with square-cut wing-tips. At a true air speed of 115 km h"1 at an altitude where the relative density is 0.7 the lift and drag are 3500 N and 145 N respectively. The wing pitching moment coefficient about the j-chord point is —0.03 based on the gross wing area and the aerodynamic mean chord. Calculate the lift and drag coefficients based on the gross wing area, and the pitching moment about the | chord point.
(Answer: Cl = 0.396, Сд = 0.0169, M = —322Nm since сд = 1.245m)
10 Describe qualitatively the results expected from the pressure plotting of a con
ventional, symmetrical, low-speed, two-dimensional aerofoil. Indicate the changes expected with incidence and discuss the processes for determining the resultant forces. Are any further tests needed to complete the determination of the overall forces of lift and drag? Include in the discussion the order of magnitude expected for the various distributions and forces described. (U of L)
11 Show that for geometrically similar aerodynamic systems the non-dimensional
force coefficients of lift and drag depend on Reynolds number and Mach number only. Discuss briefly the importance of this theorem in wind-tunnel testing and simple performance theory. (U of L)


