FREQUENCY RESPONSE
When a stable linear/invariant system has a sinusoidal input, then after some time the transients associated with the starting conditions die out, and there remains only a steady-state sinusoidal response at the same frequency as that of the input. Its amplitude and phase are generally different from those of the input, however, and the expression of these differences is embodied in the frequency-response function.
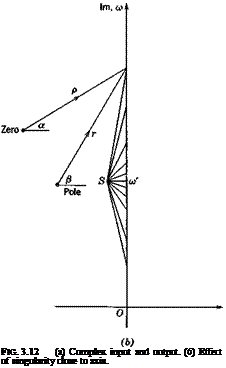
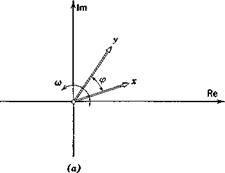
Consider a single input/output pair, and let the input be the sinusoid cos cot. We find it convenient to replace this by the complex expression x = Aof which ar cos cot is the real part. A2 is known as the complex amplitude of the wave. The output sinusoid can be respresented by a similar expression, у = A2e’mt, the real part of which is the physical output. As usual, x and у are interpreted as rotating vectors whose projections on the real axis give the relevant physical variables (see Fig. 3.12a).
|
|
 |
|
||||||||
 |
||||||||
|
||||||||
|
||||||||
|
||||||||
|
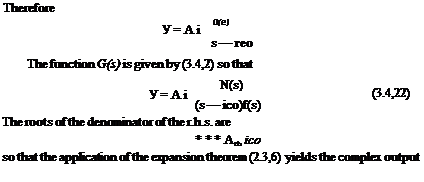
where К is the static gain (3.2,4). Then
^ = KMe* (3.4,27)
A
From (3.4,27) we see that the amplitude ratio of the steady-state output to the input is AJA-jj = KM: i. e. that the output amplitude is a2 = KMax, and that the phase relation is as shown on Fig. 3.12. The output leads the input by the angle <p. The quantity M, which is the modulus of G(ico) divided by K, we call the magnification factor, or dynamic gain, and the product KM we call the total gain. It is important to note that M and g> are frequency – dependent.
|
|
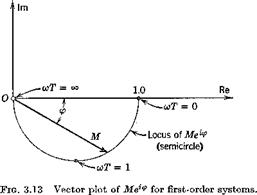
Graphical representations of the frequency response commonly take the form of either vector plots of Mei<f (Nyquist diagram) or plots of M and <p as functions of frequency (Bode diagram). Examples of these are shown in Figs. 3.13 to 3.17.


