Hysical Properties of the Atmosphere

Changes of pressure, density, and viscosity of the air with altitude z of the stationary atmosphere are important for aeronautics. These quantities depend on the vertical temperature distribution T(z) in the atmosphere. At moderate altitude (up to about 10 km), the temperature decreases with increasing altitude, the temperature gradient dT/dz varying between approximately—0.5 and —1 К per 100 m, depending on the weather conditions. At the higher altitudes, the temperature gradient varies strongly with altitude, with both positive and negative values occurring.

The data for the atmosphere given below are valid up to the boundary of the homosphere at an altitude of about 90 km. Here the gravitational acceleration is already markedly smaller than at sea level.

The pressure change for a step of vertical height dz is, after the basic hydrostatic equation,

Подпись:Подпись: (1-8 b)dp = —ggdz

ego d-H

where H is called scale height.

Table 1-1 Density q, dynamic viscosity /і, and kinematic viscosity v of air versus temperature t at constant pressure p « 1 atmosphere

Temperature

t

[°С]

Density

0

[kg/m3 ]

Viscosity

M • 106

[kg/ms]

Kinematic viscosity v • 106

[m’/s]

-20

1.39

15.6

11.3

-10

1.34

16.2

12.1

0

1.29

16.8

13.0

10

1.25

17.4

13.9

20

1.21

17.9

14.9

40

1.12

19.1

17.0

60

1.06

20.3

19.2

80

0.99

21.5

21.7

100

0.94

22.9

24.5

The decrease in the gravitational acceleration g(z) with increasing height z is

9(z)-

(1-9)

with r0 = 6370 km as the radius of the earth, and g0 =9.807 m/s2, the standard gravitational acceleration at sea level. With Eq. (1-8) we obtain by integration

Я = (9[z) іг = 2

J 9o і i z

0 1 T

(1-Ю)

For the homosphere (z < 90 km), the scale height is insignificantly different from the geometric height (see Table 1-2).

The variables of state of the atmosphere can be represented by the thermal and polytropic equations of state,

p = Q ВТ

(Mlfl)

—■ = const

e"

(1-11*)

with n as the polytropic exponent (n <7). From Eq. (1-11) differentiation and elimination of dqlq,

we obtain by

dp n dT p n— 1 T

(l-12a)

– ETiH

(1-12*)

The second relation follows from Eq. (l-8h). Finally, we have

dT _ n — 1 <70 dE n JR

(1-13)

Table 1-2 Reference values at the atmosphere layer boundaries, T

[km]

zb

[km]

Tb

[K]

Pb

[atm]

4

[kg/m3]

dT/dH

[K/km]

n

[-]

0

0

288.15

1

1.225

-6.5

1.235

11

11.019

216.65

2.234 • 10’1

3.639 • 10-1

n

1

20

20.063

216.65

5.403 • 10’2

8.803 * 10*2

4-1

0 9716

32

32.162

228.65

8.567 • 10’3

1.322 • IQ’2

+ 18

0 9242

47

47.350

270.65

1.095 • 10’3

1.427 • IO-3

П

1

52

52.429

270.65

5.823 • IO-4

7.594 • IQ’4

—2

1.062

61

61.591

252.65

1.797 • IO-4

2.511 • IQ’4

-4

1.133

79

79.994

180.65

1.024 • 10’s

2.001 • КГ5

n

1

88.743

90

180.65

1.622 – 10’6

3.170 • IQ’6

* After “U. S. Standard Atmosphere” [2].

Zfj, Tfr values at the lower boundary of the layer height; dTjdH, n values in the layers.

which shows that each polytropic exponent n belongs to a specific temperature gradient dT/dH. Note that the gas constant[1] in the homosphere, up to an altitude of H = 90 km, can be taken as a constant.

From Eq. (1-13) follows by integration:

T = T„ – (H – H„) (1-14)

Here it has been assumed that the polytropic exponent and, therefore, the temperature gradient are constant within a layer. The index b designates the values at the lower boundary of the layer. In Table 1-2 the values of Hb, zb, Tb, and dT/dH are listed according to the “U. S. Standard Atmosphere” [2].

Подпись: JL Pb Подпись: 11 П - 1 Подпись: (l-15c)

The pressure distribution with altitude of the atmosphere is obtained through integration of Eq. (1-12д) with the help of Eq. (1-14). We have

Подпись: [H ~ Hb) Подпись: (1-15b)

For the special case n = 1 (isothermal atmosphere), Eq. (1-15д) reduces to

In the older literature this relationship is called the barometric height equation. Finally, the density distribution is easily found from the polytropic relation Eq. (1 -11*)-

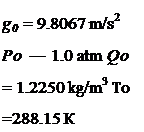
Also given in Table 1-2 are the reference values pb and ob at the layer boundaries. For the bottom layer, which reaches from sea level to H~ 11 km, Hb = H0 has to be set equal to zero in Eqs. (1-15a) and (1-15£>). The other sea level values (index 0), inclusive of those for the speed of sound and the kinematic viscosity, are, after [2],
Подпись: g0 = 9.8067 m/s2 Po — 1.0 atm Qo = 1.2250 kg/m3 To =288.15 Кt0 = 15°C a0 = 340.29 m/s vQ = 1.4607 • 10’5 m2/s (dT/dH)о = -6.5 K/km

Table 1-3 Barometric pressure p, air density q, temperature T, speed of sound a, and kinematic viscosity v versus height z*

2 [km]

TIT о

РІРч

вів 0

&I&0

”/*’o

0

1.0

1.0

1.0

1.0

1.0

2

0.9549

7.846

•10-1

8.217 • IO’1

0.9772

1.174

4

0.9097

6.085

■IO’1

6.688 • IO"1

0.9538

1.388

6

0.8647

4.660

-IO"1

5.389 • IO"1

0.9299

1.654

8

0.8197

3.518

• 10-1

4.292 • IO"1

0.9054

1.988

10

0.7747

2.615

• 10-1

3.376 • IO"1

0.8802

2.413

11.019

0.7519

2.234

■ 10-1

2.971 • IO’1

0.8671

2.674

12

0.7519

1,915

• 10-1

2.546 • IO"1

0.8671

3.120

14

0.7519

1.399

– 10-1

1.860- IO’1

0.8671

4.271

16

0.7519

1.022

• 10-1

1.359 • IO"1

0.8671

5.846

18

0.7519

7.466

• 10~2

9.930 • 10~2

0.8671

8.000

20

0.7519

5.457

• 10"2

7.258 • 10~2

0.8671

1.095 • 101

20.063

0.7519

5.403

• 10-2

7.186 ■ 10~2

0.8671

1.106 – 101

25

0.7689

2.516

• 10-2

3.272 ■ 10~2

0,8769

2.474 • 101

30

0.7861

1.181

• 10-2

1.503 • IO’2

0.8866

5.486 ■ 101

32.162

0.7935

8.567

• 10’3

1.080 • 10-2

0.8908

7.696 • 101

35

0.8208

5.671

• 10-3

6.909 • IO’3

0.9060

1.236 • 102

40

0.8688

2,834

• 10-3

3.262 – IO’3

0.9321

2.743 • 102

45

0.9168

1.472

■ 10-3

1.605 ■ IO"3

0.9575

5.819 • 102

47.350

0.9393

1.095

• 10-3

1.165 • IO"3

0.9692

8.170 -102

50

0.9393

7.874

• 10-4

8.383 • 10~4

0.9692

1.136 – 103

52.429

0.9393

5.823

• io-4

6.199 • 10~4

0.9692

1.536 • 103

55

0.9218

4.219

• io-4

4.578 – 10~4

0.9601

2.049 • 103

60

0.8876

2.217

• IO"4

2.497 > 10~4

0.9421

3.645 – 103

61.591

0.8768

1.797

• io-4

2.050 • 1Q~4

0.9364

4,397 – 103

65

0.8305

1.130

• 10-4

1.360 • 10~4

0.9113

6.340 • 103

70

0.7625

5.448

•IO"5

7.146 • IO"5

0.8732

1.125 104

75

0.6946

2.458

• 10-3

3.538 • IO"5

0.8334

2.100 • 104

79.994

0.6269

1.024

• 10-5

1.634-10-3

0.7918

4.161 – 104

80

0.6269

1.023

. 10-5

1.632 – IO"3

0,7918

4.166 – 104

85

0.6269

4.071

■ 10-6

6.494 • 10"e

0.7918

1.047 – 10s

90

0.6269

1.622

• IO’6

2.588 • IO-6

0.7918

2.627 – 10s

* After “U. S. Standard Atmosphere” [2].

The numerical values of pressure and density distribution are listed in Table 1*3, to which the values for the speed of sound and the kinematic viscosity have been added. More detailed and more accurate values are found in the comprehensive tables [2].

Finally, in Fig. 1-2, a graphic representation is given of the distributions of pressure, density, temperature, speed of sound, and kinematic viscosity versus altitude. Whereas pressure and density decrease strongly with height, kinematic viscosity increases markedly.