Pressure distribution
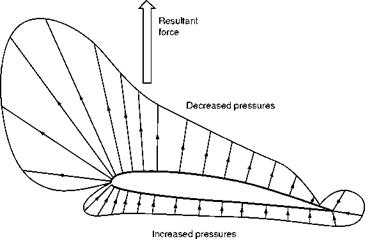
Figure 3.8 shows the pressure distribution, obtained in this manner, over an aerofoil at an angle of attack of 4°. Two points are particularly noticeable, namely –
1. The decrease in pressure on the upper surface is greater than the increase on the lower surface.
 |
 |
Part plan view of aerofoil
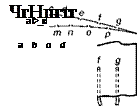
Fig 3.7 Pressure plotting
2. The pressure is not evenly distributed, both the decreased pressure on the upper surface and the increased pressure on the lower surface being most marked over the front portion of the aerofoil.
Both these discoveries are of extreme importance.
The first shows that, although both surfaces contribute, it is the upper surface, by means of its decreased pressure, which provides the greater part of the lift; at some angles as much as four-fifths.
 |
The student is at first startled by this fact, as this seems contrary to common sense; but, as so often happens, having learnt the truth, he is inclined to exaggerate it, and to refer to the area above the aerofoil as a ‘partial vacuum’ or even a ‘vacuum’. Although, by a slight stretch of imagination, we might allow the term ‘partial vacuum’, the term ‘vacuum’ is hopelessly misleading. We find that the greatest height to which water in a manometer is sucked up when air
Fig 3.8 Pressure distribution over an aerofoil
flows over an ordinary aerofoil at the ordinary speeds of flight is about 120 to 150 mm; now, if there were a ‘vacuum’ over the top surface, the water would be sucked up about 10 m, i. e. 10 000 mm. Or, looking at it another way, suppose that there were a ‘vacuum’ over the top surface of an aerofoil and that the pressure underneath was increased from 100 kN/m2 to 120 kN/m2, then we would have an average upward pressure on the aerofoil of 120 kN/m2. The actual average lift obtained from an aeroplane wing is from about 1/2 up to 5 kN/m2. Take a piece of cardboard of about 100 cm2, or l/10th of a square metre, and place a weight of 100 N on it; lift this up and it will give you some idea of the average lift provided by one-tenth of a square metre of aeroplane wing, and the type of load that has to be carried by the skin. You will not want to repeat the experiment with more than 10 000 N on the cardboard!
The reason why the pressure distribution diagram of Fig. 3.8 has not been completed round the leading edge is because the changes of pressure are very sudden in this region and cannot conveniently be represented on a diagram. The increased pressure on the underside continues until we reach a point head – on into the wind where the air is brought to rest and the increase of pressure is 1/2 pV2, or q, as recorded on a pitot tube. The point at which this happens is called the stagnation point, and its position round the leading edge varies slightly as the angle of attack of the aerofoil is changed but is always just behind the nose on the underside of positive angles of attack. After the stagnation point there is a very sudden drop to zero, followed by an equally sudden change to the decreased pressure of the upper surface, and rather surprisingly on the nose.


