Viscosity
The viscosity of pure monatomic, but also of polyatomic gases, in this case air, can be determined in the frame of the Chapman-Enskog theory with [2]
RyjMT
p = 2.6693 • 10~6-Ц,—– . (4.12)
a2Q^
The dimensions and the constants for air in the low temperature domain, [2], are: viscosity p [kg/ms], molecular weight M = 28.9644 kg/kmole, Temperature T [K], collision diameter (first Lennard-Jones parameter) a = 3.617-10-10 m. The dimensionless collision integral, [2], is a function of the quotient of the temperature and the second Lennard-Jones parameter e/k = 97 K, Appendix B.1.
An often used relation for the determination of the viscosity of air is the Sutherland equation
6 TLS
AtStttft= 1.458-10-6r+ii04. (4.13)
A simple power-law approximation is p = c^T. In [7] different values of are proposed for different temperature ranges. We find here for the temperature range T ^ 200 K the approximation—with the constant c^1 computed at T = 97 K—
p1 = c^Tu^ = 0.702 • 10-7T, (4.14)
and for T ^ 200 K—with the constant cM2 computed at T = 407.4 K—
p2 = c^2Tu^2 = 0.04644 • 10-5T°’65. (4.15)
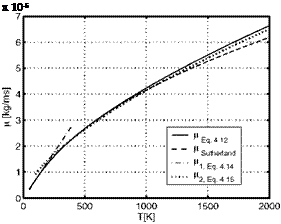
In Table 4.3 and Fig. 4.3 we compare results of the four above relations in the temperature range up to T = 2,000 K, with the understanding, that a more detailed consideration might be necessary due to possible dissociation above T « 1,500 K. The data computed with eq. (4.12) were obtained by linear interpolation of the tabulated collision integral [2], Appendix B.1.
The table shows that the data from the Sutherland relation compare well with the exact data of eq. (4.12) except for the large temperatures, where they are noticeable smaller. The power-law relation for T ^ 200 K fails above T = 200 K. The second power-law relation gives good data for T A 300 K. For T = 200 K the error is less than nine per cent. At large temperatures the exact data are better approximated by this relation than by the Sutherland relation.
|
T |
H -105 eq. (4.12) |
f-LSuth ’10 |
£ I—1 О ОТ |
P’2 TO5 |
|
50 |
0.349 |
0.321 |
0.351 |
– |
|
75 |
0.525 |
0.511 |
0.526 |
– |
|
100 |
0.702 |
0.693 |
0.702 |
0.927 |
|
200 |
1.335 |
1.328 |
1.402 |
1.454 |
|
300 |
1.846 |
1.846 |
2.106 |
1.892 |
|
400 |
2.279 |
2.285 |
2.808 |
2.281 |
|
600 |
3.016 |
3.016 |
– |
2.969 |
|
800 |
3.655 |
3.623 |
– |
3.580 |
|
1,000 |
4.226 |
4.152 |
– |
4.139 |
|
1,500 |
5.453 |
5.260 |
– |
5.387 |
|
2,000 |
6.632 |
6.179 |
– |
6.495 |
|
Table 4.3. Comparison of viscosity data p [kg/ms] of air computed with eqs. (4.12) to (4.15) for some temperatures T [K] (see also Fig. 4.3). |
 |
Fig. 4.3. Viscosity p of air, different approximations, Table 4.3, as function of the temperature T.


