INFLUENCE OF SURFACE ROUGHNESS
The consequences of increased skin friction, caused by surface roughness, as to lift-curve slope, are explained in the section on “circulation”, Chapter II. The basic influence on pitching moment is mentioned in connection with figure 32. In the following, roughness will be considered as it affects the maximum lift of airfoil sections and/or airplane wings.
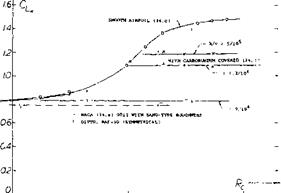
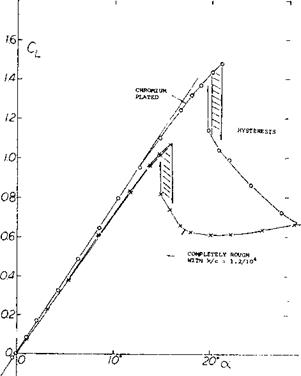
Surface roughness can be local such as at a particular chordwise station of an airfoil, or uniformly distributed over the surface, such as a rough coat of paint, for example. On the lower (pressure) side, roughness tends very slightly to increase the lift at a certain angle of attack. Roughness on the suction side on the other hand, reduces lift and maximum lift coefficient, particularly in well-rounded sections where a gentle type stalling takes place from the trailing edge. As an example of the effect of distributed roughness, figure 28 shows the lift function of an NACA 0012 airfoil tested at RN = 6(10)fe , both in the perfectly smooth condition and after coating the surface uniformly with grains of carborundum. The lift – curve slope is reduced (see figure 28) and the maximum lift is cut down from 1.48 to 1.07.
Maximum-Lift Divergence. As explained, for example in “Fluid-Dynamic Drag”, one consequence of uniformly distributed and closely packed sand-type roughness in the turbulent boundary layer is the fact that the skin-drag coefficient Cp is independent of the Reynolds number and assumes a constant value. As demonstrated in figure 29, the maximum lift coefficient of completely rough airfoil sections is also constant above a certain limiting Reynolds number. Below this Reynolds number, the airfoil behaves as though it were perfectly smooth. Figure 30 shows how the maximum lift coefficient reduces as a function of the roughness grain size. A comparatively small but permissible grain size should apply to this graph too.
|
і і
Figure 29. Maximum lift coefficient as tested on 0012 airfoils with A = 6, as a function of R’number: a) smooth wind-tunnel models, b) completely covered with carborundum grains. |
Permissible Roughness. As explained in “Fluid-Dynamic Drag”, the permissible roughness size in a turbulent boundary layer approximately corresponds to the grain Reynolds number
R* * w k/v = Rc (w/V)(k/c) ~ 120 (11)
where к = grain diameter and w = local velocity at the spot where the roughness is located. Using equation (1) we can estimate that the NACA 0012 section as in figure 28 and 29, may have a maximum local velocity (somewhere at or above the nose) corresponding to w/V^3 at CLX = 1.2 as in graph at Rc somewhat above 106 . For the grain size ratio k/c = 5/105, we thus obtain a critical Reynolds number
R = 120 (10)5/(3.5) = 8(10)5 (12)
|
Figure 28. Lift of an 0012 airfoil tested in A = 6 in the CATunnei (34,c) at R = 6(10)6, in smooth and carborundum covered condition. |
This estimate does not agree with the actual divergence Reynolds number 1.2(10)6 as in figure 29. When carrying out the calculation for the re-attachment point (at which the local velocity is lower), satisfactory agreement is expected to be found, however. Now, Extrapolating the results of figure 29 yields
к /с »1/((1 + 2Cl)Rc) (13)
and we tentatively find a permissible grain size ratio к /с below 1/105 at Rc = 4 (10)6 where C Lx = 1.45, as in figure 30.
models by dirt originating in, or “seeping” into, the tunnel. In conclusion, wherever wind-tunnel tests show maximum lift coefficients leveling off upon approaching Rc = 107, it may be suspected that surface roughness is the cause, unless influenced by compressibility.
|
|
|
I06 |
|
Ю7 |
|
lO8 |
|
|
/08 |
|
Ю7 |
![]()
![]()
![]()
Roughness in Wind Tunnels. The influence of roughness on CLX has an important implication with regard to the results obtained in either high-speed or pressurized wind tunnels. Consider in particular the NACA’s Variable Density and the British Compressed Air Tunnels operating at 20 and 25 ats, respectively, while testing standard airfoil models having but 5 and 8 inches chord length. At a maximum Reynolds number (as in the CAT of Rc = 7(10) ) the permissible roughness ratio for an airfoil section at CLX = 1.5 is found (for an assumed velocity ratio of w/V = 2) to be in the order of
k/c = 120/ (2 (7) x 10b )~1/105 (14)
The corresponding grain size к is below 1/104” inch or 0.1 mills, or in the order of ^ 2 microns. This roughly represents the surface roughness of “finished” metal. There is evidence such as in (11 ,c) where tests of NACA 63 and 64 series sections (with a chord c = 2 ft) up to Rc = 2.5(10)T show that Cj_x stops increasing in certain sections (see figure 31, a, b, c) between Rc = 104‘ and 107. While it seems to be routinely possible to produce model surfaces sufficiently smooth for this condition, there are reports from other high-speed tunnels indicating that it is a real problem to prevent “sandblasting” of the
|
|
|
20- | SHARP STALL О ROUND*D TYPE STALL SMOOTH
05- |
0_
lO5
Figure 31. a) Maximum lift coefficient of two dimensional airfoil sections, NACA 64-012, 63-009 (11), with and without standard roughness.
Figure 31. b) Maximum lift coefficient of two dimensional airfoil sections, NACA 23012 and 0012 (11), with and without standard roughness.
CL,
|
20-
ROUNDED TYPE STALL 0.5- |
oL
Ю5
Figure 31. c) Maximum Ijft coefficient of two dimensional airfoil sections, NACA 4412 and 64-418 (11), with and without standard roughness.
Roughness in Full-Scale Operation. The above method for estimating the permissible roughness grain size can also be applied to full-scale airplane operation. Consider, for example, flow conditions at the suction side near the leading edge of a wing. At lift coefficients above unity the critical local velocity at this point is increased to about 2 times the airplane’s air speed. When flying at 100 knots (for example, takeoff or landing) the maximum local speed is thus in the order of 200 knots (or 340 ft/sec). The permissible grain size of sand-type roughness is then in the order of 0.6 milli-inch, while paint in aircraft mass production may have a grain size of 1 milli-inch. If it is not the paint, dust and/or insects picked up by the airplanes or the ground or in flight can easily make the nose of the wing section sufficiently rough, so as to affect its maximum lift coefficient in the manner as shown in figures 28 and 29. Note also, that in a turbulent boundary layer the permissible grain size is a function of speed, and not of wing or aircraft dimensions.
Stimulation of Turbulence. In the practical operation of high-speed airplanes (such as fighters) it is known that the qualities of laminar-type wing sections deteriorate rapidly by picking up dust, mud and insects. To simulate this condition, the sections investigated particularly in (11) were (in addition to their smooth condition) routinely tested with a turbulence-stimulating strip of thinly spread carborundum grains placed over the first 8% of the chord (both on the upper and lower sides). The grain size used was 0.011 inch, equal to somewhat less than 5/1СИ’ of the chord. Consequences of this type of stimulation with regard to lift, are:
(a) Some reduction of the lift-curve slope (up to about 10% in higher thickness ratios).
(b) A reduction of maximum lift of as much as 25% depending on shape and thickness ratio.
Efficiency of Airfoils. The efficiency of airfoil sections can be measured by the ratio CLX /Срт/п. In high-speed sections, the Cp mm is expected to be low (say in the order of 0.005) corresponding to an appreciable percentage of laminar boundary layer flow. However, when judging the efficiency of an airplane, the drag coefficient of the complete craft should be considered rather than that of the wing only.
Type of Stalling. Maximum lift coefficients of several airfoil sections, tested with “standard” leading-edge roughness, are plotted in figure 31 as a function of the Reynolds number. Three different groups of airfoil sections were found as to the influence of the roughness strip upon the magnitude of CLX •
(a) Figure 31,a shows that in symmetrical (and comparatively sharp-nosed sections) the rise of the maximum lift coefficient above the thin-foil level is prevented by roughness. Note that in the smooth condition the two sections shown each end up at a higher but constant level, suggesting that the “natural” roughness of their “smooth” surface is dictating that level.
(b) The majority of all airfoil sections belongs to the leading-edge stalling group as in figure 31,b. Their maximum lift coefficient is considerably reduced by the roughness strip, the amount growing with the Reynolds number.
(c) The influence of nose roughness on the maximum lift of the sections shown in figure 31,c is to produce a more or less constant reduction. It seems that all sections with typical or exclusive trailing-edge stalling (highly cambered sections, with higher thickness ratios) belong to this group. It appears that the carborundum strip takes away a specific amount of momentum from the suction-side boundary layer, thus reducing pressure recovery at the trailing edge.
Airfoil Thickness. The size of the “standard” turbulence і stimulation strip used by the NACA (11) is arbitrary. All that the strip tests give in regard to maximum lift is a qualitative indication of the influence of roughness around the nose on the magnitude of CLX. Figure 24 shows that the CLX of sections below 6% or 8% or 10% may not be sensitive to roughness. Sections with thickness ratios between 12% and above 20% can, on the other hand, be very much affected by leading-edge roughness, particularly in effective camber ratios between 0% and 3% (which means all sections used in high-speed airplanes).
Cambered Sections. Figure 25 illustrates the variation of the maximum lift coefficient of the NACA 63 and 64 series sections (11) as a function of effective camber ratio and shows that:
(a) Sections up to t/c = 6% do not exhibit much of an influence of leading-edge roughness.
(b) The influence of roughness increases systematically as the thickness ratio is increased to 9%, 10% and 12%.
(c) The 12% and 15% thick sections show practically constant differentials of maximum lift due to standard roughness;
ACLX~ -0.3.
The data given in figure 25 shows little difference in the maximum lift coefficient of NACA 63 and 64 series sections in the smooth model condition.
Corrugated Surface. Early Junkers aircraft used corrugated sheet metal as a properly stiffened skin for cantilevered monoplane wings. At speeds in the order of 200 mph it was thought that drag may not be too critical while light-weight construction did provide high payload fractions and/or range. To evaluate the effects of a corrugated surface three Clark-Y wing models were tested (26,c) at Rc = 2(10)6 with the following results:
(a) smooth airfoil with A = 6; CLX = 1.22.
(b) with corrugations placed on top of contour; C LX = 1.25.
(c) with corrugations cut into the model; CLX = 1.26.
Although drag is generally somewhat increased, the maximum lift coefficient is surprisingly enough not reduced. It must, therefore, be postulated that the corrugations have some “stabilizing” effect on the flow past the suction side, reminiscent of the influence of vortex generators (see Chapter V). This effect is particularly present at angles of attack some 8 above that for C Lx °f the A = 6 airfoils tested.
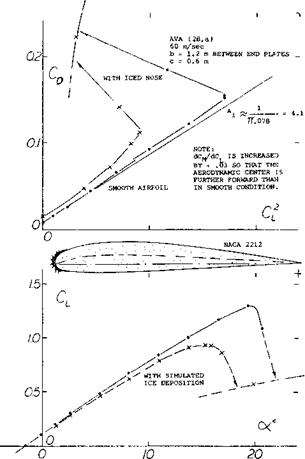
Ice Formation. When flying at temperatures below freezing, rain may be deposited, particularly on the leading edge of wings, in the form of ice. Figure 32 presents one example of such deposits, tested (28,a) at Rc =: 4(10) . In comparison to the smooth NACA 2212 section, C ^ is reduced from 1.3 to below 1.0. Not only is the maximum lift of an airplane flying in icing weather reduced but its drag and its weight also grow simultaneously so that eventually it may no longer be possible to keep the craft flying. Ice coatings may be mechanically removed by inflating rubber “boots” (28,b) placed upon (built into) the wing leading edge. Of course, such devices are bound to reduce lift (lift-curve slope) and maximum lift coefficient to a degree, even when not in operation. Naturally, all the types of roughness discussed also increase the section drag, (a) because of stimulation of turbulence and
(b) because of their own addition to skin drag (See Chapter V of “Fluid-Dynamic Drag”). [49]
|
Figure 32. Example for lift and drag of a 2212 airfoil, tested (28,a) between end plates, with and without simulated ice formation around the leading edge. |


