MAXIMUM LIFT AS A FUNCTION OF SHAPE AND REYNOLDS NUMBER
As previously noted, the airfoil shape and the operating Reynolds number strongly influence maximum obtainable lift. Also influenced is the variation of CL with angle of attack or the type of stall encountered by the airfoil. These characteristics are a function of the type of boundary layer and its thickness variation along the chord.
Principles. Analysis of boundary layer development along the suction side is very involved. The methods available for predicting the value of the maximum lift coefficient, say as a function of section shape, are lengthy and involved and require the use of high speed computers, yet are not completely reliable. For this reason, statistical information are presented in this’ section to provide an insight of the available data. Certain guiding principles can be stated, however, and it can be said that CLX depends:
a) on the sum of the momentum losses incurred along the suction side
b) on the values of the skin friction drag coefficient
c) on the location of the boundary layer transition point along the suction side
![]() Boundary layer transition and drag coefficient are both a function of Reynolds number and of surface roughness. Momentum losses are, of course, a function of shape (as explained to some degree in the “stalling” section). Transition from laminar to turbulent boundary layer flow can be strongly affected by wind-tunnel turbulence, or it can be brought about on purpose by stimulation (surface roughness around the leading edge).
Boundary layer transition and drag coefficient are both a function of Reynolds number and of surface roughness. Momentum losses are, of course, a function of shape (as explained to some degree in the “stalling” section). Transition from laminar to turbulent boundary layer flow can be strongly affected by wind-tunnel turbulence, or it can be brought about on purpose by stimulation (surface roughness around the leading edge).
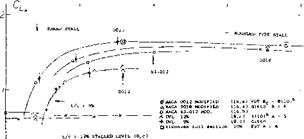
Stall Type Prediction. It is useful to determine the type of stall that will be encountered. Prior to discussing the effects of airfoil shape and Reynolds number in terms of the individual parameters. For airfoils such as the NACA four and five digit types, as well as the NACA 6 series, the type of stall encountered is a function of the Reynolds number and the vertical ordinate at the 0.0125% chord, (see figure 8). This curve applies for smooth airfoils and shows the effects of camber and leading edge radius on the type of stall. Note the importance of leading edge radius and the secondary effects of Reynolds number.
Figure 8 is a generalized curve and does not predict the stall type for all airfoils. One notable example is the NACA 23xxx series which have blunt leading edges so that the upper surface ordinate at 0.0125% chord is high, indicating trailing edge stall. However, the stall shown in figure 7 for the 23011 section is sudden and sharp, indicating leading edge stall. In spite of this problem, figure 8 is useful in the majority of cases.
(13) Airfoils with A = 6 in NACA V’Density tunnel:
a) Jacobs, 78 Related Sections, T Rpt 460 (1933)
b) Jacobs, Function of R’number, T Rpt 586 (1937).
c) Jacobs, Various Corrections, T Rpt 669 (1939); this report is the best of the series.
d) Pinkerton, Various Sections, T Rpt 628 (1938).
e) Jacobs, 23012 Type, see references (10,b, c).
CLx As a Function of Nose Shape. As previously indicated, the flow at the leading edge is critical with regard to separation, and therefore maximum lift. This is illustrated by considering symmetrical airfoils in which case the flow about the leading edge is a function of forebody shape, or in this case nose radius (see equation 1).
|
NOSE RADIUS r/c* ЛІ————— 1———————————– J—————- 1 і <5 /234 Figure 9. Maximum lift ot symmetrical airfoil sections, as a function of their nose radius ratio r/c. |
Maximum lift coefficients are plotted versus the nose radius ratio in figure 9. The optimum radius (yielding the peak maximum lift coefficient) is found to be between 1.5 and 2.0% of the chord; and it seems this size radius applies to all thickness ratios between 6 and 18%, results of which are plotted. Nose radii on this order are provided in the NACA 0012 and 63-012 airfoils. From figure 9 it would therefore appear to be advisable to double the nose radius of 4-digit foil sections having thickness ratios between 6 and 9% to improve Clx, while it might do no harm to reduce the radius in sections which are thicker than 15%. Note, however, that camber should also be considered in connection with the nose radius. An extreme example of increased nose radius is shown in figure
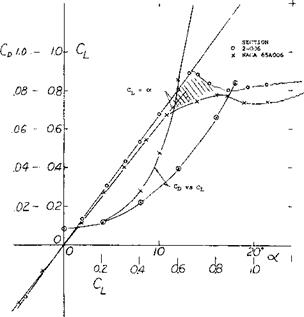
10. While Clx is duly increased, Cpminmay also be. increased, particularly in comparison with a samethickness airfoil section providing there is some laminari – zation of the flow, such as the NACA 65-006 for example. As a consequence the parameter of merit, Clx /Сотій, of the highly round-nose section is not in any way higher than a comparable 63/64/65 series section.
(14) Suppose there is a turbulence factor reported, presumably correct for the tunnel’s “cruising” speed, and the tunnel is used at 1/8 of that speed. Corresponding to v^8 = 2, the factor should then be doubled; and when the factor was 1.5, for example, it should be 3 for the low speed assumed.
(15) The Cux value in two-dimensional How can be expected to be some 6% higher than the average in a wing with A = 6. However, the boundary layer along the lateral walls in a two-dimensional tunnel can be suspected to cause some reduction of the average maximum lift tested.
(16) Influence on stalling of section nose modifications:
a) Modification of 4-Digit Sections, see (13,a,3)
b) Kelly, 63-012 Section, NACA TN 2228 (1950).
c) Doetsch, Symmetrical Sections, see (8,a).
d) Макі, 64A010 Modifications, TN 3871 (1956).
e) Racisz, Round-Nose 6% Section, NACA RM L53J29.
![]()
![]()
![]()
![]()
![]()
![]()
![]()
 r/c = .81%’
|
Figure 10. Lift and drag of two 6% thick airfoil sections differing in nose radius, tested in A = 4 tapered wings, on fuse] age body at Rc=5(10) in a closed tunnel (16,e). |
Sharp Leading Edges. As explained by the thin-airfoil stall mechanism, boundary-layer transition can be precipitated by a sharp leading edge. This is evidently so in flat, and/or cambered plates, at Reynolds numbers below 105 (see figure 11). In that range, such plates, and/or very thin and/or sharp-edged foil sections, develop much higher maximum lift coefficients than any conventional (roundnosed) airfoil shapes. This fact seems to be the reason and/or the explanation why insects and some birds do have thin and possibly sharp-edged wings (12). Birds may also have some turbulence-stimulating roughness (fuzz) which could be particularly useful along the upper side of the leading edge. The jib of a small sailboat also seems to fall into the range below the critical Reynolds number, at least in light breezes, and certainly when trying to get out of a calm. In other words, the shape of a sail stretched irom a wire or a reinforced seam, is an optimum, at least below Rc = 105. Another example where a sharp leading edge has, a beneficial effect is the circular-arc section (as frequently used in marine propeller blades) when used at lower Reynolds numbers. [48]
i1-
|
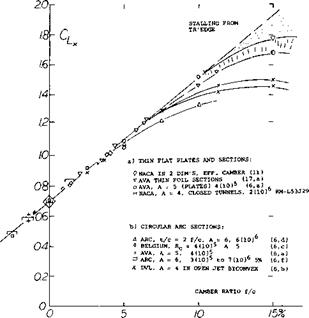
Figure 12. Maximum lift coefficient of sharp-edged sections as a function of their camber ratio: a) thin plates, tested in A = 5 b) circular-back airfoils in A = 6 c) biconvex and double-wedge sections. |
Effect of Camber. Where camber is used, stalling and Cux become a function of the section-nose curvature between the leading edge and the upper (suction) side. This curvature is related to the nose radius, r/c, and the camber ratio, f/c, and increases with f/c. The flow around the leading edge of a thin plate can obviously be facilitated by bending the section “nose” into the oncoming flow. At higher Reynolds numbers, laminar separation and the bubble-plus-re-attachment mechanism might then be minimized. For thin sharp-edge sections and airfoil sections, the C [__x increase is given as a function of camber ratio on figure 12. For practical purposes, the values reached seem to be independent of the Reynolds number, providing that the leading edge is reasonably thin (and the camber not too high).
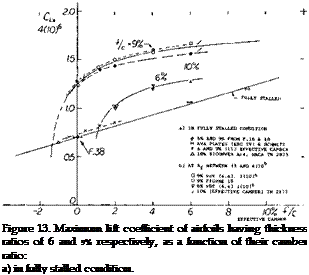
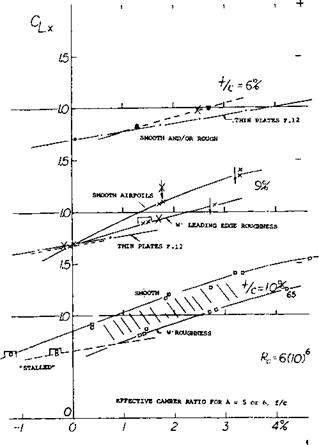
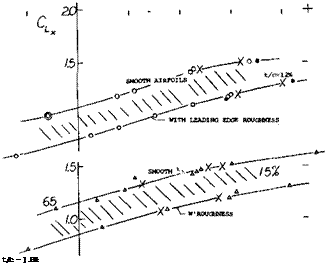
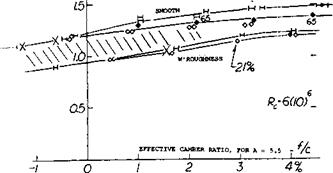
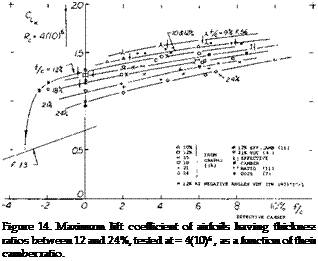 Camber Ratio. No distinction has been introduced in all graphs presented with regard to the location of maximum camber along the chord. The differences in maximum lift for airfoil sections having their maximum camber located between 30 and 50% of the chord are comparatively small. The main effect of camber is the actual amount of camber. This is illustrated by a few experimental points obtained from a two-dimensional wind-tunnel set-up (11) plotted against camber ratio figures 13 and 14. After adjustment to A = 5 or 6 according to equation (7). Characteristics of thin airfoils, with t/c = 6 and 9% are presented in figure 13. It is seen that for camber ratios between plus and minus 1% their maximum lift coefficients reduce to the fully stalled level indicated by a straight line connecting points obtained at very high angles of attack (on the order of 30°). The practical use of thin and cambered sections in airplanes is limited by structural considerations. For certain other applications, such as turning vanes in ducts or turbines, the)’ may profitably be used at lift coefficients compatible with their camber ratio. Airfoil shapes with thickness ratios of
12%, and above, represented in figure 14, fall entirely above the stalled level indicated in figure 13. Their maximum lift coefficients grow steadily as a function of camber, to the highest effective camber ratios tested, on the order of 10%.
|
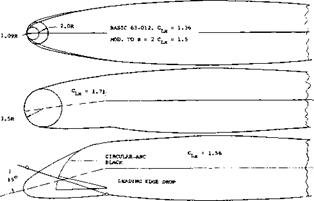
Figure 15. Several leading-edge (nose) modifications tried (16,b) on 63-012 foil section to improve maximum lift (and stalling). Rc = 4.9(10)6 . |
Nose Camber. The NACA 63-012 section as tested between walls (16,b) at Rc = 5(10)b and M = 0.18, stalls suddenly from CLx = 1.36, exhibiting violent buffeting and shaking at angles of attack beyond stalling as would be predicted from figure 8. By increasing the nose radius from 1.1% of the chord to 2%, Cue, is increased to 1.50; the sudden type of stalling still remains, however. An attempt was, made therefore, to remedy the situation by pulling down (i. e., drooping) the section nose using nose camber in the form shown in figure 15. Again, CLx is increased; but the type of stalling is still sudden, of the thin airfoil bubble bursting type. Pressure distributions show that stalling takes place on reaching Cpmm = -10. It therefore appears that behavior at and beyond CLX can only be made gentle when stalling occurs from the trailing edge; and that can be done only by camber plus thickness.
Critical Reynolds Number. The Operating Reynolds number is an important parameter affecting the maximum lift coefficient of airfoils, since it, along with the shape, is a factor which determines the position of airflow separation and thus CLx- As shown on figure 16, the maximum lift coefficients of all but very thin airfoils increase sharply in the vicinity of Rc = 105. This is the critical Reynolds number range where the boundary layer flow turns turbulent so that the laminar-type separation from the suction side disappears. Airfoils such as the NACA 0009 also have the same critical change of flow pattern, but at a higher Rc (see figure 16). Because of shape (no camber), transition from the laminar to the turbulent boundary layer is
![]()
![]()
![]() AVA JOUKOWSKY INTERPOL 9%, f = 1.2 (17,a)
AVA JOUKOWSKY INTERPOL 9%, f = 1.2 (17,a)
GO-358 (10.5/6)% BETWEEN END PLATES, f = 1.2 (4,f)
ARC-CAT (8.6/4.0)% A = 6, f = 2.5 (9,e)
DVL 2409, A = 5, f = 1.1 (8,a)
DVL 2309, A = 5, f = 1 (8,a)
0 AVA GO-622 (8/2.2)% A = 5, f = 1.5 (19)
j_ RAF-28 (907/l.8)% DUPLEX (7,c) and CAT, f = ], (4,b)
* NACA-FST 0009, A = 6, f = 1.0 & 1.2 (7,b)
C DVL 0009, A = 5, f = 1.0 & 1.1 (8,a)
-7 NACA 64-210 A = 6 WING, f = 1 (TN 2753)
A 63 and 64-009, EFF CAMBER 1.8% (11,g)
Л 0008 in 2-DIMENSIONAL FLOW 1.7% (11, f)
X DVL 9% – 0.83, 40, A = 5, f = 1 (8,c)
– DVL 9% – 0.83, 45, A = 5, f = 1 (8,c)
DVL 9% – 0.55, 40, A = 5, f = 1 (8,c)
Г FULL-SCALE T, A = 4, 10% BICONVEX (TN 2823
• RAF-34 IN ARC (10/1.5)% f = 2 (9,e)
|
|
1c7 ‘los
delayed to a Reynolds number which is roughly 10 times as high as for most of the other sections having thickness ratios and/or nose-radius ratios larger than the NACA 0009 section. The airfoil nose-radius ratio is thus an important influence with regard to the critical Reynolds number of the section, figure 17. Note that the sections with the smallest curvature tend to have the highest critical Reynolds numbers for the strong increase of CLy.
X AVA JOUKOWSKY 11.5%, A = 5, f = 1.2 (17,a)
» AVA GO-358 (10.5/6)% BETWEEN END PLATES, f = l(4,f)
V SCHMITZ N60 (12.4/4)% f = 1.1 (20,a)
A NACA-VDT 6412/4412, f = 2.9, A = 6 (13,b)
X DVL 23012, A = 5, f = 1 IN OPEN TUNNEL (8,b)
0 DVL CLARK-Y (11.7/3.9)%, A = 5, f = 1 (7,a)
» NACA-FST CLARK-Y, A = 6, f = 1 (7, a)
X 0012 IN 2-DIMENSIONAL, EFF CAMBER 3% (11,c)
▲ ARC-CAT (12.9/6)%, A = 6, f = 2 (9,e)
♦ ARC-CAT CLARK-YH (11.7/3.1)% f = 1 * (9,e)
-H – AVA GO-796 (12/3.7)% BETWEEN WALLS, f = 1.2 (19)
h NACA 23016/09 TAPERED WING (TN 1299)
H GALCIT 2412, A = 6, f = 1.2 to 2.4 (T RPT 558)(12,c)
□ DVL 2412, A = 5, f = 1 (8,a)
Г ARC RAF-34 (12.6/1.8)% f = 1.8 (17,c)&(4,b)
J_ NACA FST 0012, A = 6, f = 1.1 (7,b)
C DVL 0012, A = 5, f = 1.1 (8,a)
© DVL 12% – 1.1, 40, A = 5, f = 1.1 (8, c)
A ARC-CAT 0012, A = 6, f = 2 to 3 (4,b)
+- AVA GO-459 (12.5/0)%, A = 5, f = 1 & 1.5 (17,a)
DVL 0012 – 0.83, 35, A = 5, f = 1 (8,c)
1 DVL 1.1, 35, 11.4 – 0.55, 43, A = 5, f = 1 (8,c)
A SCHMITZ N60R (12.4/3)% A = 5 (20,a)
V DITTO, FULLY STALLED CL, f = 1 (20,a)
![]()
![]()

![]()
![]()
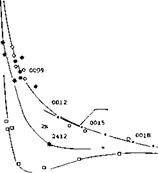
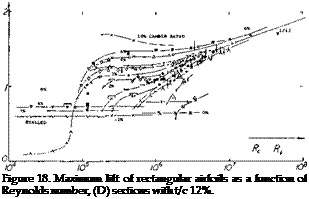
Figure 16. Maximum lift of rectangular airfoils as a function of Reynolds number, (C) sections with t/c = 8 to 10%.
/08 ri
"Lx RISES ‘STALLED
A 6% SECTIONS IN 2-DIMENSIONAL FLOW (ll, c) 1.4% CAMBER Л 9% SECTIONS AS TESTED BY DVL (8,a, c)
• A FEW OTHER FOIL SECTIONS O. SYMMETRICAL 4-DIGIT SECTIONS X from GRAPHS CLx (Rf) for f/c – 2% a FROM VARIOUS GRAPHS FOR f/c = (4 to 6)%
NOTES:
a) RESULTS FROM THE NACA LOW-TURBULENCE TUNNELS (11) TEND TO BE ON THE HIGH SIDE.
b) RESULTS FOR f/c BETWEEN 4 and 6%, TAKEN FROM THE VARIOUS GRAPHS C^ (Rf), MAY NOT BE VERY RELIABLE.
c) WHILE CAMBER BASICALLY COMBINES WITH NOSE RADIUS IN PRECIPITATING TRANSITION, ITS INFLUENCE REDUCES TO NOTHING AS THICKNESS AND NOSE RADIUS GROW TO 21 and 5%, RESPECTIVELY.
10 /0
NOSE-RADIUS RATIO
6ЙГ r/c
– gure 17. Critical Reynolds number of airfoil sections, where >w attaches to the suction side so that the maximum lift coefficient rises above the subcritical stalled level, as a function of the nose-radius ratio.
(18) Lift coefficients are rather low in insects (below 0.1).
(19) Riegels, “Aerodynamische Profile”, Munchen 1958; review of theory and experimental results over the past 30 years, a catalog of airfoil sections.
(20) Airfoils at very small R’numbers:
a) Schmitz, Aerodynamik des Flugmodells, Berlin 1942 & Duisburg 1952; Small R’Numbers, Ybk WGL 1953 p. 149.
b) Muesmann in AVA Tunnel, 1956, quoted in (19).
(21) See in Chapter II of “Fluid-Dynamic Drag”. The reduction of maximum lift observed in “well-rounded” foil sections also corresponds with the fact that the drag coefficient of a sphere increases again after the critical drop at Rj := 4 (10)^ see Chapter III of “Fluid- Dynamic Drag”.
(22) Theory and tests of Joukowsky sections:
a) Joukowsky, Zeitschr Flugtech Motorluft 1910 p. 281; also in “Aerodynaminique”, Paris 1916.
b) AVA Gottingen, 36 Sections, Erg III & IV (1927/32).
c) Glauert, Generalized Family, ARC RM 911 (1924).
d) ARC, Series Tested, RM 1241 (1929) & 1870 (1939).
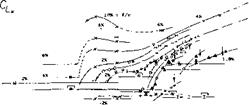
High Reynolds number. Reynolds numbers in the range of 10fe to 107 represent airplanes operating at minimum flying speed at takeoff or landing. The variation of of airfoils in this range of Reynolds number and down to 10b are given in figures 16 and 18 to 22. The principle characteristics for this range are:
(a) Thin plates and airfoil sections up to 3% thickness continue to have essentially constant maximum lift coefficients, corresponding to thin-foil type stalling.
(b) Thin airfoil sections (between t/c = 5 and 10%) display a basic increase in C Ly as their camber ratio is increased from zero to 2% (as in figure 16). Their flow pattern at the angle of attack where Cl = maximum changes from more or less separated (as in thin airfoil stalling) to almost fully attached. The Reynolds number and/or camber ratio at which the change takes place, can be very sensitive to the test conditions.
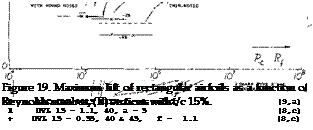
(c) As seen in figures 16 and 18, in the vicinity of Rc = 10all sections with moderate thickness (between 8 and 12%) and small camber (between 0 and 2%) have a marked tendency for increasing maximum lift coefficient as a function of Reynolds number. This is caused by an improved flow around their noses as the transition to turbulent flow within the boundary layer moves farther toward the leading edge.
(d) All highly cambered and/or thicker airfoil sections (that is, all sections with well rounded noses) do not present “any” difficulties to the flow around the leading edge. Since their maximum lift coefficient is a function of the momentum remaining within the boundary layer
when arriving at ttie trailing edge, the CL* of these thicker sections depends on the average skin-friction drag coefficient along their upper (suction) side. For Reynolds numbers approaching 107 that drag coefficient increases (21) as a consequence of boundary layer transition. As seen, particularly in figures 20 and 21, the maximum lift coefficient of this group of sections is therefore lower in the vicinity of Rc = 10 reaching a minimum somewhere between Rc = 106 and 10 7.
|
X |
GO JOUKOWSKY INTERPOLATED |
(17,a) |
|
7 |
ARC-CAT (16.8/7.6)% f = 1 |
(9, e) |
|
NACA 23018 in 2-DIMENSIONAL FLOW, f/c 5% |
(11,a) |
|
|
– |
NACA 4418 in 2 DIMENSIONS (6.3%) |
(11,a) |
|
A |
DVL Cl-Y-18 (18/6.3)%, A = 5 |
(8,b) |
|
О |
AVA GO 390 BETWEEN WALLS f = 1.2 |
(4,f) |
|
0 |
2-DIMENSIONAL 63-018, f/c 2.3% |
(11,c) |
|
И |
DVL 2418, A = 5, f = 1 |
(8,a) |
|
гл |
NACA 0018 – FULL SCALE T, f = 1.1, A= 6 |
(7,b) |
|
# |
DVL 0018, A = 5, f = 1 |
(8,a) |
|
A |
DVL 18 – 1.1, 40, A = 5, f = 1 |
(8, c) |
|
Cl. |
|
2 – |
|
CAMBER RATIO, f/c – 10X ‘rjfa ~ К
-24 f/c = -4% |
Rt Rf
icf Ю5 /0s io7 /о8
 |
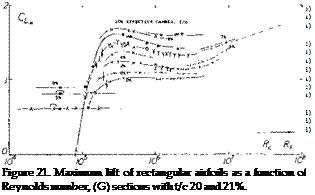 |
Figure 20. Maximum lift of rectangular airfoils as a function of Reynolds number, (F) sections with t/c 18%.
![]()
![]()

![]()
![]() -t-
-t-
Л GO JOUKOWSJCY 244 INTERPOLATED (17 a)
Д Cl-Y-24 (24/10)4 WL (8 b)
A 2-DIMENSIONAL 2424 . 4424,EFF. CAMBER (11,a)
□ ‘RAF-89 (25/1.94) f=2 CAT *=6 (7,c)(9,a)
C NACA-FST 0025 A=6 1 <7,c)
О AVA 0025-40, f = 1, A = 5, OPEN (17,c) —
D ARC-CAT 0030 A = 6, f = 1 4 2 (9a)
/ –
Oj________ ,___________ і
I04 Ю5 /06
Figure 22. Maximum lift of rectangular airfoils as a function of Reynolds number, (H) sections with t/c equal to and above 24%.
The different types of stalling discussed before also result in different trends (gradients) of CLX . Sections; exhibiting the thin-foil type of stalling have essentially constant maximum lift coefficients. The sudden leading-edge type stalling is accompanied by a usually steep increase of CLX as a function of Reynolds number. Real trailing-edge stalling grows slowly as a function of Reynolds number, so that the maximum lift coefficient reduces for higher camber ratios, as seen in most of the graphs presented. Regarding the flying qualities of an airplane near CLX > the round-top type of stalling is, of course, more desirable than a sharp stall from a high peak. It can also be argued that a gently stalling airfoil section will have a “useable” maximum lift coefficient equal to its maximum, while a thinner and/or less cambered section with a dangerous sharp type of stalling would always have to be kept sufficiently below the maximum. The various phases marked in all the graphs permit selection of airfoil sections, not only as to efficiency but as to behavior.
Theoretical Analysis. An early theory for analyzing the boundary layer around the leading edge of an airfoil is presented in (23). This theory permits calculation of the maximum lift coefficient as a function of Reynolds number and/or stream turbulence for moderately thick and cambered air-foil sections. The theory appears to be accurate, however, only at Reynolds numbers where stalling is produced by separation (bubble bursting) near the leading edge.
*2 3) Theoretical analysis of maximum lift and separation;
a) vonKarman and Millikan, Analysis of Maximum Lift, J RAS July 1935; also J Appl Mech 2,A,21 (1935).
b) Howarth, Theory, Proc Roy Soc London A.868 (1935) p. 558.
c) Math Model, Stevens, W. A. et al, NASA CR-1843.
d) Evans & Mort, Sudden Stall, NASA TND-85.
In the case where stalling is caused by trail edge separation the maximum lift coefficient is a result of a balance between the kinetic and potential energies of the boundary layer flow. The potential flow energy is represented by the pressure increase between the minimum-pressure point and the trailing edge. Thus for a section with moderate camber and a well rounded leading edge the stalling can be determined as a function of the kinetic energy in the boundary layer. Since the kinetic energy in the boundary layer is a function of Reynolds number and increases as skin friction decreases, it can be speculated that
cu -l/lcf R~£b (9)
where n = 0.5 (1/6) = 1/12, and 1/6 is equal to the average exponent when the drag coefficient is turbulent. Based on the above equation it would appear that the maximum lift coefficient should continue to increase above Rc = 107 . In making such extroplation of the test data it should be noted that any increase in Reynolds number is usually a result of an increase in speed and the following must be considered;
(a) the influence of surface roughness (see section 4)
(b) the effects of compressibility as measured by Mach number.
With the use of high speed computers the theoretical methods have been extended (23 ,c) to allow the calculation of CLX for any combination of conditions operating at low Mach numbers. Such procedures have led to the development of advanced airfoils as discussed in Chapter II with an increase of CLX equal to 20%.
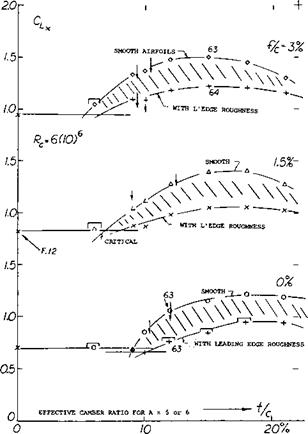
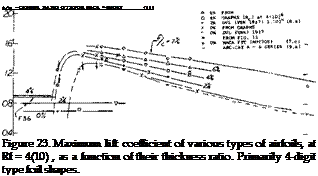
Thickness Ratio. Practical applications, with regard to maximum lift, such as airplane wings, require consideration of Reynolds numbers in the vicinity of Rc = 107 . Since only a few systematic investigations have been extended to that Reynolds number, we have rather plotted the more complete data for Rf =4(10) in figure 23, as a function of thickness ratio. The critical change of the flow pattern described for the Reynolds number of 4(10) will also apply at Reynolds Numbers in the vicinity of Rc = 107 . The maximum lift coefficient is seen to increase “suddenly” for camber ratios between 0 and 2% at t/c between 5 and 8%. Below t/c = 8 or 9%, (and below 2 or 4% camber) the sections exhibit thin-foil stalling. Peak values of the maximum lift coefficients are then obtained in sections with t/c in the vicinity of 10%. Judging by the large number of experimental results available, a thickness ratio of t/c = 12% is evidently considered to be most efficient. While somewhat thinner sections may, at full – scale Reynolds numbers, be superior in the fluid-dynamic aspect, structural considerations tend to make a 12%
 -+
-+
ct„
0—————- 1—————- 1—————- 1__________
о /0 20 30% f/c
Influence of Nose Radius. In keeping with what is said above regarding their nose radius ratio, the experimental results of 63 and 64 series airfoils are more or less different from the corresponding graphs representing 4-digit and similar foil shapes:
(a) Because of the comparatively small nose radius, the increase of CLX versus thickness ratio, as in figure 24, is considerably delayed in comparison to that in figure 23. See figure 17.
(b) For the same reason, the 63 and 64 type sections in
figure 25, exhibit values which are considerably
lower than those in figure 14, particularly in the range of smaller and smallest camber ratios.
![]()
thickness ratio more attractive, at least within the range of moderately high subsonic speeds. Sections with t/c = 0 and 10% have frequently been investigated. As a compromise between aero-dynamic and structural effectiveness. For example, the NACA 0009 has often been proposed as a shape to be used in the design of tail surfaces for higher-speed airplanes. Maximum lift characteristics of most of these sections are as described under (c) of the previous section. As the thickness ratio is increased to 18% (as sometimes used in the wing-root sections of big but low-speed airplanes) and above that ratio, the maximum lift coefficient reduces gradually. By employing proportionately higher camber ratios, it is possible, however, to keep the CLX at 1.4. Their stalling characteristics are very gentle. Unfortunately, however, thick and highly cambered sections are not suitable for high-speed applications due to their low critical Mach number. Also they have correspondingly high pitching moments, which tend to be too large with regard to structural strength and rigidity (torsion).
High-Speed Airfoil Sections. It has previously been stated that the position of the maximum camber point is not very important with regard to maximum lift, at least not between 30 and 50% of the chord. In contrast, position of maximum thickness has some influence, particularly when a nose radius change is coupled with that position. This is usually the case with laminar-type airfoil sections and/or in sections particularly designed for high-speed applications (at higher subsonic Mach numbers). In particular, the NACA 63 and 64 series sections (11) have ratios (r/t)/(t/c) = 0.75 and = 0.72, respectively, while the 4-digit (and similar lower-speed sections) have a radius parameter of 1.10. When evaluating maximum lift of the 63 and 64 series sections, the complication of effective camber is encountered again. Results taken from (11) have been transformed (using equation 7) and interpolated where necessary, so that they represent sectional conditions (24) as in wings with A between 5 and 6.
|
Figure 24. Maximum lift coefficient of 63 and 64 series airfoils as tested (11) at Rl = 6(10) , as a function of their thickness ratio, grouped as to their camber ratio effective for A between 5 and 6 (see equation 7). |
(24) The difference in effective camber (between 2-dimensional tunnel and an airplane wing having an aspect ration of, say 6,) is considerable at lift coefficients above unity. Characteristics at small lift coefficients are affected to a much lesser degree.

 In conclusion, comparison on the basis of nose radius ratio r/c (rather than thickness ratio) would bring about a more favorable correlation between the two major types of airfoil sections. Characteristics of 12% thick symmetrical sections are included in figure 9, accordingly. At the lower end of the nose-radius scale, we recognize the effect of the critical change (transition) within the boundary – layer flow around the section nose. Stalling of these high-speed sections is comparatively sudden sometimes showing large hysteresis loops. Of course, the drop of the lift coefficient is aggravated by the fact that the sections in figure 9 are all without camber (geometrically, that is).
Mach Number Effects on CLX. The operating Mach number has a large influence on the maximum lift coefficient of an airfoil. The change in CLy is caused by the formation of shock waves in those regions on the airfoil where the local Mach number exceeds 1.0. The shock wave pattern formed depends on the boundary layer type. As the pressure increases on passing through the shock wave, the lift on the suction side of the airfoil is reduced and a reduction of CLx is encountered.
Two regions are important with regard to the formation of the shock waves:
(1) the area around the nose of the airfoil and
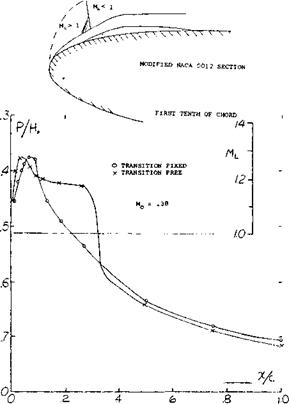
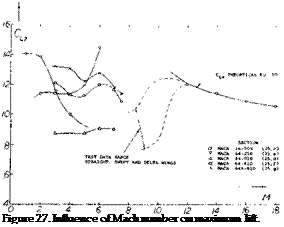
(2) the area toward the trailing edge on the suction side. On blunt nose airfoils operating at high lift coefficients the local Mach number of 1 can be exceeded at free stream as low as Mc = .25 (25,a). On the first tenth of the chord on blunt airfoils standing shock waves are formed similar to the more well known shocks on the aft section of the aifoil, except their size is an order of magnitude less. The familiar lambda type shock with a weak forward shock and pressure plateau as illustrated in figure 26 is formed with a laminar boundary layer. With a turbulent boundary layer the single shock with a strong pressure rise and an expanding bubble is formed at the nose (25,b). These shock waves interact with the boundary layer causing separation and a reduction of CLX as illustrated in figure (27).
(25) Mach Number Effects on Max. Lift.
a) Fitzpatrick, & Schneider, NACA TN2753.
b) Aerodynamics Dept. Annual Report 1971, RAE TR
72073.
c) Cleary, Complete Wings, NACA WR L-514.
d) Wilson & Horton, NACA RM L-53C20.
e) Racisz, S., NACA TN 2824.
0 Stivers, L., NACA TN 3162.
g) Summers, J. L., NACA TN 2096.
h) Hicks, et al, Forward contour modes 64-212 foil NASA
TM-3293
i) Hicks & Schairer Upper surfaces modes 63-215, NASA
TM-78503
j) Hicks, Mods to an NACA 65 – (.82) .099) airfoil, NASA
TM-85855
 |
![]() Figure 26. Pressure and local Mach number distribution at maximum lift (25,b).
Figure 26. Pressure and local Mach number distribution at maximum lift (25,b).
The variation of CLX with Mach number with the NACA 64-210, 64-410, 64A-610 airfoils are examples where separation due to leading edge shock wave reduces lift, figure 27. With an airfoil such as the NACA 64-010 where leading edge separation already takes place the formation of a shock would not influence the variation of C LX with Mach number.
At Mach numbers in the transonic range the is
influenced by the formation of shock waves at speeds above the critical. After reaching a minimum, C Lx will increase and approach the theoretical value shown on figure 27 which is described by the equation at M > 1.0
CLX = -5Ps – Pe 00)
where p9 is the stagnation point pressure and pp is the rear surface pressure corresponding to vacuum.
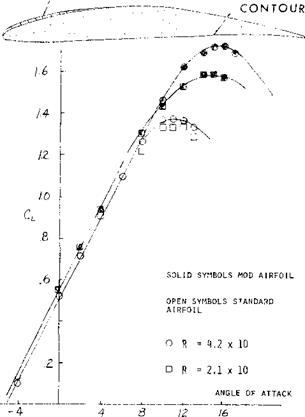
The negative peak pressure toward the leading edge of the airfoil leading to the lambda type shock wave and lift stall shown in figure 26 can be eliminated at the lower Mach numbers by recontouring the upper surface as indicated on figure 26a. This change (25,h, i,j) reduced the local Mach number below one thus eliminating separation with the result that the airfoil can operate at a much higher angle of attack and before stall occurs. This characteristic is shown on figure 26a and shows a large increase of CLfrom 1.33 to 1.6 and a stall angle increase from 10 to 15 for a NACA 65-(.82 .099) airfoil, (25 j).
REVISED CONTOUR
|
Figure 26a. Lift of an airfoil modified to eliminate shock stall relative to standard. NACA 65 (.82)( 099) airfoil. |
(26) Structural roughness (imperfections):
a) Jacobs, Protuberances, NACA T Rpt 446 (1933).
b) Hood, Surface Irregularities, TN 695 (1939).
c) Wood, Corrugated Surface, NACA Rpt 336 (1929).
d) See Also references under (27).
(27) Characteristics of practical-construction airfoils:
a) Tetervin, Helicopter Blades, NACA W Rpt L-643 (1944).
b) Doetsch, Waviness on 23012, Ybk D Lufo 1939 p. 1-88.
c) NACA, TN 428 (fabric-covered), 457 (irregularities), 461 (rivet heads), 724 (rib stitching).
d) Quinn, Practical Construction, NACA T Rpt 910.


