Results Space resolved data
|
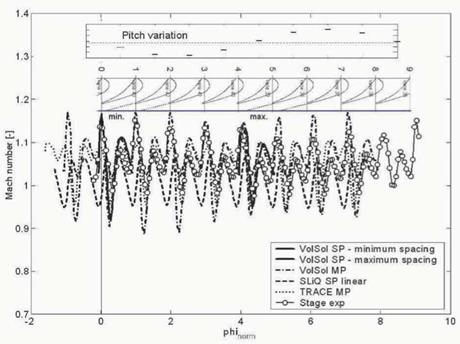
Figure 3. Space resolved stator exit Mach number at midspan at 128% of cax, atator |
Figure 3 shows the space resolved stator exit ft>w behind nine passages. The Mach number has been chosen to represent the data because it is a direct measured result, whereas the pressure is a derived result with more uncertainty. Also illustrated is the variation of the corresponding vane pitches. It is obvious that a comparison of the data sets in this form is difficult. The measured and computed domain are not exactly the same, so that the 9 passage period is only partly overlapping. The single passage approach with VolSol is of course only represented in one passage each, the result of minimum and maximum spacing shown at the corresponding locations. Each passage exit ft>w goes through two Mach number deficits, which have been described and discussed in detail in earlier work, for example Ref. [7], and (from left to right) identified as a wake and a shock deficit. This pattern is found in all of the curves. The global behavior found by all methods, and in the experiments, is that Mach number level and deficit amplitude decrease with increasing spacing. Obviously, the larger pitch leads to less acceleration of the fbw and hence reduced deficits due to the wake and shock. The VolSol single and multi-passage results fit well but small differences indicate that the exit flow variation is not purely controlled by the single passage aerodynamics. Compared to experiments, the Mach number deficits by VolSol are too large. The TRACE computation is performed with slightly different boundary conditions (stator only
the description of Strategy 1, the single passage analysis indicates that 5th EO type of variation seems to change close to the tip, as the 1st harmonic variation decreases, and instead the mean value variation increases. This information is not included in the harmonic analysis in Figs. 4 and 5.


