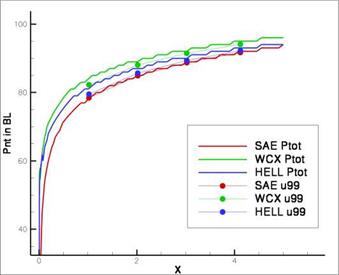
Boundary Layer
As graphical output the number of grid points in the boundary layer and the boundary layer thickness 3 in m is given in the flow solver output.
Separation
As graphical output the surface elements including characteristic points of separation and reattachment plus both surface and volume elements with stagnation areas are marked in the flow solver output. Additionally the flow solver can give number of marked elements as a textual feedback.
Shock
As graphical output the volume elements including the characteristics of a shock are marked in the flow solver output. Additionally the flow solver can give a tendential prognosis of the position of the shock depending on the choice of the turbulence model. This is based on the investigations with the 2D RAE test-case.
|
Fig. 22 Flat plate — comparison of the number of points in the boundary layer detected by the sensor and with the boundary layer defined by 99% of the farfield velocity U99 with the SAE, Wilcox k-m and Hellsten EARSM model |
|
Fig. 23 RAE 2822 case9 — characteristic points of flow separation and reattachment after the shock and near the trailing esge and the stagnation point |


