Results
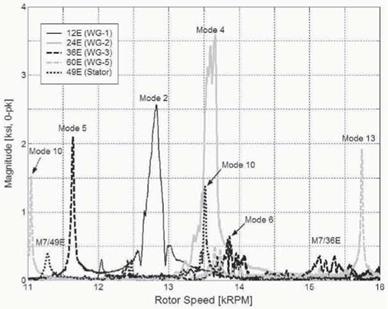
The effectiveness of the order tracking technique for measurement of synchronous vibrations is demonstrated in Fig. 5. The various lines in the figure represent selected order components, corresponding to known aerodynamic forcing functions, from a single strain gauge signal during a single speed runup at baseline (no TEB) conditions. As is the case for all forced response data presented here, stage loading was set by an exit fbw throttle to represent a design operating line. Multiple resonance crossings are clearly characterized in the figure. In conjunction with the predicted Campbell diagram and order phase tracking, modes could be readily identified, as labeled in the figure. Additionally, with data from multiple rotor blades, scatter in blade response could be quantified, and appropriate adjustments could be made to the predicted Campbell diagram.
|
Figure 5. Baseline order tracks, showing multiple modal resonances due to upstream WG and downstream stator excitations |
Basic measurement accuracy was very high, and errors added from the computed order tracking technique were found to be minimal. Measured order track amplitudes at resonance crossings from multiple gauges on the same blade, when normalized by the baseline response at that location, were found to be quite consistent with one another over the entire TEB range. This gauge – to-gauge comparison consistently yielded an error of less than one percent of the baseline response amplitude, confirming the high measurement accuracy.
Repeatability errors proved to be more significant than instrumentation errors. Thus repeatability in resonance crossing amplitude was used to quantify overall uncertainty in the rotor stress measurements. Considering multiple rotor speed sweeps, both upwards and downwards, and including widely varying sweep rates, resonance crossing amplitude was found to be repeatable within ± 3 percent for back-to-back data. However, day-to-day variability in crossing response amplitude was found to be as much as 10 percent. Since aerodynamic damping is much stronger than structural damping for the rotor blisk, variations in the atmospheric conditions and stage loading, due to poor repeatability of the throttle position, are believed to account for the increased variability. Thus, to minimize uncertainty, all data presented are from a back-to-back series of runs.
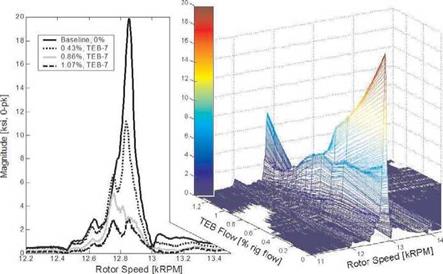
By stacking 12E order tracks for successive TEB fbwrates against the baseline data, as shown in Fig. 6, the strong effect of flow control on resonant response is demonstrated. The surface plot at right provides an overview of the entire test domain, with the baseline 1T/12E resonance dominating in the foreground. The line plot at left compares selected slices of the same data to provide a more detailed view of the local effects at resonance. Data in the figure is taken from the most responsive of the measured blades, with a peak baseline response of 39.7 ksi (274 MPa) peak-to-peak (p-p), well above the design scope limit (from [9]) for that gauge location.
|
Figure 6. Effect of TEB on critical blade response at the 1T/12E resonance crossing |
Application of increasing TEB flowrate is shown to progressively attenuate the first torsion response. Using a total of 1.07% of the rig inlet fbw at the crossing speed, the 1T response was limited to 5.8 ksi (40MPa) p-p on this blade, a reduction of 85%.
A secondary peak is also seen to emerge when TEB is applied. This peak is also attenuated, though not as sharply as the primary peak for the critical blade. A similar multi-peak characteristic was often observed for other blades and at other modal crossings, such as the labeled Modes 4 and 7/36E in Fig. 5 for a different blade. In some cases, more than two distinct peaks were noted at a crossing. This behavior, as well as the large blade-to-blade variability observed in maximum crossing amplitude, is believed to be caused by the complex coupled interaction between neighboring mistuned blades.
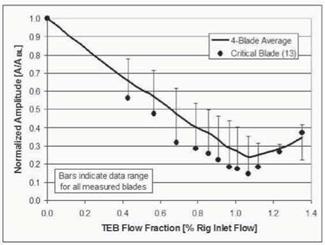
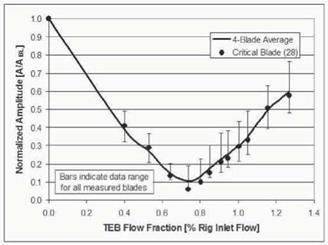
Resonant amplitude data from four blades were normalized and averaged for the 1T/12E and LE2B/24E crossings, as presented in Figs. 5 and 5, respectively. Amplitudes are normalized by the baseline crossing amplitude for each respective gauge used in the average, while TEB fbwrates are normalized by the corrected rig inlet flow for the speed at which the respective crossing occurs. In addition to the four-blade-average data, the data from the blade with the highest baseline response is shown. Bars are included to illustrate the range of responses for the measured blades. It is noted that the maximum attenuation occurs on the critical blade for both crossings.
|
Figure 7. Effect of full-span TEB ftiwrate on first-torsion resonant response |
As clearly illustrated in Figs. 6-5, the resonant response amplitude exhibits a saddle-type trend over the range of TEB ft>wrate. For increasing TEB ft>w, resonant response is attenuated until a minimum crossing response is achieved, at what is considered the optimal flowrate for that particular resonance crossing. If ft>w is further increased beyond this saddle point, referred to as overblow-
|
Figure 8. Effect of full-span TEB fbwrate on LE2B/24E resonant response |
ing, the crossing response begins to increase. In the event of substantial overblowing, the response can exceed that of the baseline case.
This infection behavior, which was generally noted for all the measured crossings, is expected. The saddle point occurs when the offending forcing function harmonic passes through a minimum amplitude. Here the forcing function harmonic experiences a phase reversal, which corresponds conceptually to the original wake velocity deficit being replaced with a surplus. A phase reversal is accordingly noted in the harmonic response, which, like the forcing function harmonic, begins to increase in amplitude for overblowing.
It is noted that substantial attenuation in resonant amplitude, roughly proportional to the TEB fewrate, is achieved at less-than-optimal fewrates. This point should not be lost on the designer seeking an appropriate compromise between forced response mitigation and engine performance.
Based on the four-blade-average data, the maximum attenuation at the1T/12E crossing was 76% using 1.07% of the rig few for TEB. A maximum average attenuation of 89% was achieved at the LE2B/24E crossing using 0.74% of the rig few. Table 1 summarizes the maximum reductions from the critical blade at these and other resonance crossings. In most cases, the 60% attenuation goal established for the National HCF Program [1] was exceeded.
Significant TEB sensitivity is only expected for resonance crossings involving excitation orders associated with the wake forcing function directly modified by TEB. Correspondingly, resonance amplitudes from crossings of the 49E order, an excitation produced by potential interaction with the 49 downstream stator vanes, were not significantly affected by the application of TEB. While
|
Table 1. Summary of maximum reductions in modal resonance amplitude by TEB.
|
this forcing function could not be attenuated by TEB, it is worth noting that the 49E potential excitation is very weak in comparison to the viscous excitation originating upstream of the rotor. It was found that the blade response to the fundamental stator excitation was generally so small as to only be comparable to that produced by the fourth (48E) or fifth (60E) harmonics of the WG excitation.
Despite close blade row spacing and the presence of strong rotor bow shocks, substantial stress reductions were achieved at multiple resonance crossings in the present study. These results also compare favorably to those previously documented. Morris et al. [6] reported stress reductions on a high – subsonic rotor of 90% for chordwise bending (1C), and 43% for the third leading edge bending mode (LE3B). While the total TEB-to-rig massfbw ratio for the Morris experiments was greater than the optimal flowrates determined in the present study, the flow ratio was similar on a per-vane basis.
2. Conclusions
The TEB flow control technique was implemented in row of wake generator (WG) vanes, placed just upstream of a modern highly loaded transonic fan stage. The WGs produced fundamental and harmonic engine order excitations that caused numerous resonance crossings in the tested range of the compressor. Rotor stress measurements confirmed that the TEB technique can be quite effective for reducing resonant rotor response, even with close blade row spacing and strong rotor bow shocks sweeping the WG trailing edge.
In most cases, the National HCF Program’s goal of 60 percent reduction in resonant response was exceeded. Reductions of as much as 85% and 94% were achieved by TEB for the first torsion and second LE bending modes, respectively, while reductions at higher modal crossings were also substantial. While resonant response sensitivity to TEB fbwrate was shown to have a saddle behavior, the characteristic was approximately linear for sub-optimal fbwrates, which may provide an appropriate design tradeoff with respect to overall system-level performance.
Acknowledgments
The authors gratefully acknowledge the support of Mr. Oral Mehmed and NASA Glenn Research Center (GRC). The authors are especially indebted to the entire staff of the Compressor Aero Research Lab for their many useful suggestions as well as patient assistance provided during experiments. The support afforded the primary author by an NSF Graduate Research Fellowship is also duly acknowledged.


