Simple Mechanics of Gliding, Forward, and Hovering Flight
1.3.1 Gliding and Soaring
Flying animals usually flap their wings to generate both lift and thrust. But if they stop flapping and keep their wings stretched out, their wings will actively produce lift, not thrust. When this happens, we call them gliders. Thrust can then be produced by gravitational force while an animal descends. In addition to bats and larger birds, gliders can also be found among fish, amphibians, reptiles, and mammals.
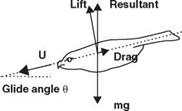
To maintain level flight, a flying animal must produce both lift and thrust to balance the gravity force, in the vertical direction, and the drag, in the horizontal direction, respectively. Because gliding occurs with no active thrust production, an animal always resorts to the gravity force to overcome the drag. In gliding, the animal tilts its direction of motion slightly downward relative to the air that it moves through. When the animal tilts downward, the resulting angle between the motion direction and the air becomes the gliding angle. The gliding angle directly controls the lift-to – drag ratio. The higher this ratio, the shallower the glide becomes. Recall from a basic fluid dynamics class that the lift-to-drag ratio increases with the Reynolds number, a parameter proportional to animal size and flight speed. Large flying animals fly at high Reynolds numbers and have a large lift-to-drag ratio. For example, a Wandering
Figure 1.21. Force balance of gliding [63].
 Albatross, with a wing span more than 3 m, has a reported lift-to-drag ratio of 19, whereas the fruit fly, which has a span of 6 mm, has a ratio of 1.8 [22]. If the animal has a low lift-to-drag ratio, it must glide (if it can) with a considerable increase in glide angle. For example, a lizard (the genus Draco) from Southeast Asia has a lift – to-drag ratio of 1.7 and glides at an angle of 30°, whereas a North American flying squirrel glides at the angle of about 18° to 26° with a lift-to-drag ratio of 2 or 3 [22].
Whereas gliding animals take a downward tilt to acquire gravity-powered flight, many birds can ascend without flapping their wings. This is called soaring. Instead of using gravity, soaring uses energy in the atmosphere, such as rising air currents [22].
Consider a gliding flyer at an angle в relative to the free-stream (see Fig. 1.21). The lift and drag are perpendicular and parallel to the flyer’s inclination axis, while the gravitational force is invariant for our purpose. It is known that good bird flyers often attain a maximum glide ratio of 10 to 15 (в about 5°), whereas Wandering Albatrosses record 23 (в = 2.5°). Using the planform area S and the lift coefficient CL,
1
L = 2 pSU2Cl = mg cos в « mg (as в is small) (1-17)
By measuring m, S, and U, the lift coefficient is found to be typically < 1. Maximum CL (about 1.5) occurs at minimum glide speed, when the bird starts to flap its wings just before they stall. One can also estimate the glide speeds as a function of flyer sizes:
Table 1.5 summarizes gliding characteristics of selected natural flyers, showing that the glide speed is indeed well correlated with the square root of the wing loading,
|
Table 1.5. Glide characteristics of selected flyers, showing that the glide speed is generally proportional to (wing loading)1/2 Wing loading (N/m2) Glide speed (m/s)
|
 |
 |
51 km/hr
Figure 1.22. Variable span gliders: wing morphing to accommodate gliding speed [29].
W/S. Furthermore, statistically, as shown in Table 1.5, for most birds, except hummingbirds, the planform area is S a m0’72 and the wing loading is W/S a m028, which result in the glide speed: U a m014.
Because lift (L) is proportional to flight speed squared, birds control their speed by varying S and hence the wing loading (W/S). This enables the bird to adjust the speed range so that the wings operate at an optimal AoA at all speeds. To complement the trends highlighted in Figure 1.13, Figure 1.22 illustrates such trends for a falcon and a pigeon under varied flight conditions.


