Turbulent Mixing Noise
The noise from a high-speed jet is intimately related to the turbulence characteristics of the jet. Both fine-scale turbulence and large-scale turbulence generate noise. It is important to note here that the terms fine – scale and large-scale turbulence noise are very imprecise and confusing. As discussed in Section 3.3, the terms are used in these notes to distinguish between different noise generation mechanisms. The fine-scale turbulence mechanism is taken to be associated with relatively compact sources and involves the propagation of the sound, once generated, through the moving, sheared mean flow. Thus mean flow/acoustic interaction effects such as refraction, described in Section 3.1, are important for this noise source. The large-scale noise mechanism is associated with a direct connection between the turbulent structures in the jet shear layer and the acoustic field. An example is given by the instability wave model discussed in Section 3.2. Both mechanisms are broadband in nature, though the large-scale noise radiation is expected to dominate at low frequencies and small angles to the jet downstream axis. The relative contributions of these two noise mechanisms depend on the jet Mach number, jet temperature, and the radiation angle. For subsonic jets, especially at low and moderate temperatures, the large turbulence structures propagate downstream at subsonic speeds relative to the ambient speed of sound. For these jets, the fine-scale turbulence is probably the dominant noise source at most angles. However, at angles close to the jet axis, including the peak noise radiation angles, the contribution from large-scale structures could be significant. For supersonic jets, and subsonic jets at high temperatures, as in practical jet engine applications, the large-scale structures convect downstream at supersonic speeds relative to the ambient speed of sound. As such, they are efficient generators of noise and constitute the dominant noise sources, especially in the downstream direction.
Jet noise depends on the jet operating conditions: Nozzle Pressure Ratio (NPR) pt/Pa and Total Temperature Ratio (TTR) Tt/Ta, the nozzle exit area (related to the fully expanded jet diameter Dj), the distance of the observer from the nozzle exit, ambient conditions, and the polar direction of radiation ф. 1 Usually, the origin of the reference coordinate system is located at the center of the nozzle exit, with the noise emission angle measured from the inlet axis. Unless otherwise stated, this convention is followed throughout this set of class notes. However, theoretical analysis usually uses the angle 9, which is the polar angle measured from the jet downstream axis. Jet noise was typically measured in 1/3-octave bands until the late nineteen eighties. The bandwidth that corresponds to a particular 1/3-octave band center frequency, increases as frequency increases. In the last few decades, high quality narrow band spectra have been measured. These narrow band data shed more light on the noise characteristics and have been used by researchers in the development of noise prediction
1For noncircular jets the noise is also a function of the azimuthal location, though this effect is generally small unless the aspect ratio of the nozzle is very large.
|
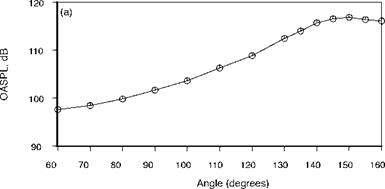
Figure 1. Overall Sound Pressure Level of typical mixing noise from a round nozzle corrected to a polar distance of 100 diameters. D = 8.79 cm, Mj = 0.86, Tt = 811K. |
methods. However, the metric for the calculation of aircraft or engine noise is the effective perceived noise level (EPNL), which is based on octave or 1/3-octave spectra. In computing the EPNL, the measured spectrum at each observer angle is converted to a single number based on a set of formulae or a table, with the octave band center frequencies weighted differently. The heaviest weighting is given to frequency bands to which the average human listener is most sensitive. For aircraft certification, the computed perceived noise level at each angle (or time) is integrated to account for the duration effect, and an effective perceived noise level is calculated. The approved procedure for noise certification has been established by the Federal Aviation Authority, see code of federal regulations, part 36. The procedure for aircraft noise certification is described by Peart et al. (1995). It is clear from the above description that these regulations have profound implications for noise reduction strategies. Though it would be desirable to reduce the noise level at all frequencies, any noise reduction concept should target those frequencies that reduce the perceived noise level.
Figure 1 shows the typical noise characteristics of a hot subsonic jet with Mj = 0.86 and Tt = 811 K at a polar distance of 100 diameters. The Overall Sound Pressure Level (OASPL) increases gradually with observer angle from the inlet and reaches a peak at approximately 150 degrees. The spectra at 90 degrees to the jet are shown in Figure 2 from Viswanathan (2004). This figure also shows the effect of increasing Mach number. It should be noticed
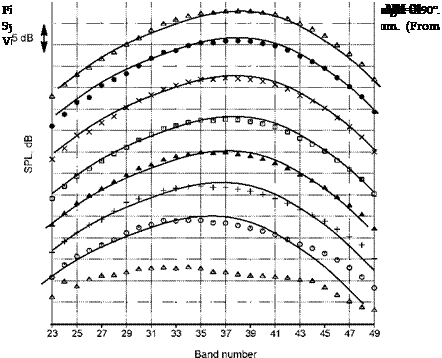
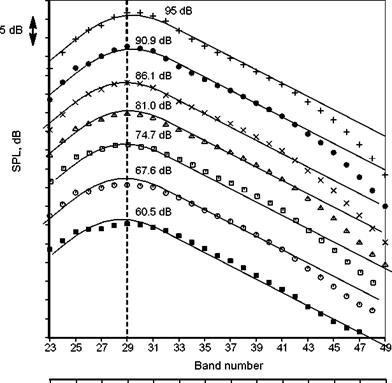
that all the spectra have the same broad, flat shape, which is characterized by the fine-scale similarity (FSS) spectrum of Tam et al. (1996). This is discussed in more detail in Section 3.3 below. At the lowest Mach number the jet noise spectra are contaminated by facility noise and do not conform to the FSS spectral shape. The spectral shape at larger inlet angles is much more peaked with a faster roll-off at both high and low frequencies. This is shown in Figure 3 from Viswanathan (2004) for several subsonic Mach numbers and an unheated jet at 160 degrees. Also shown in the figure are curves representing the Large Scale Similarity (LSS) spectrum from Tam et al. (1996): see Section 3.3. The agreement is very good. Also notice that the peak frequency is independent of jet Mach number.
The acoustic analogy by Lighthill (1954) provides a scaling formula for
|
0.2 0.5 1.25 3.15 5 12.5 20 50 80 Frequency, KHz Figure 3. Comparison of spectra from unheated jets. D = 2.45 in., inlet angle = 160°. Symbols: ■, M = 0.4; O, 0.5; □, 0.6; △, 0.7; x, 0.8; •, 0.9; +, 1.0. Lines: LSS spectrum. (From Viswanathan (2004), with permission) |
|
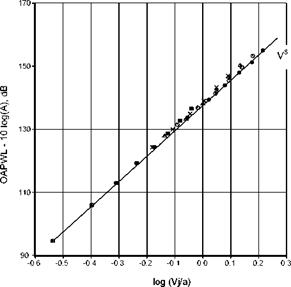
Figure 4. Comparison of spectra from unheated jets. D=2.45 in. Symbols: V8.m. ■. Tt/Ta = 1.0; x. 1.8; △ . 2.2; O, 2.7; • . 3.2. (From Viswanathan (2004), with permission) |
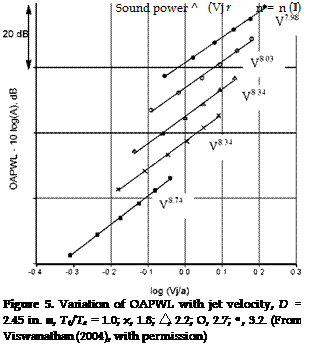
the power radiated by a low Mach number. unheated jet that varies as the eighth power of velocity (see Section 3.1). The variation of the Overall Power Level (OAPWL)for a range of jet Mach numbers from 0.5 to 1.0 and total temperature ratios of 1.0 (unheated) to 3.2 is shown in Figure 4 from Viswanathan (2004). Also shown is a line representing the V8 variation. The agreement is good. However. as shown by Viswanathan (2004) a closer look at the effect of temperature shows that each total temperature ratio follows its own power curve with a slightly different exponent for each temperature. This is shown in Figure 5 from Viswanathan (2004). Notice that the unheated jet has an exponent that is very close to the eighth power scaling.
Viswanathan (2004) also showed that the effect of heating on jet noise at a fixed jet velocity was different for lower velocity jets than at higher velocities. At lower velocities. heating at a fixed velocity increased the noise and at higher velocities. heating decreased the levels. The transition occurs
 |
|
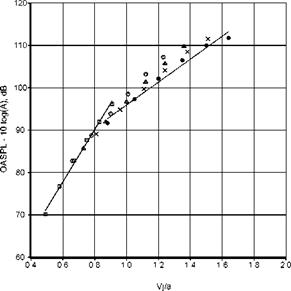
at an acoustic Mach number Vj/a of approximately 0.8. The variation of OASPL at different angles was also shown to depend differently above and below this acoustic velocity. For example, Figure 6 shows the variation of OASPL at an inlet angle of 160° for different acoustic Mach numbers and temperature ratios. The value of the velocity exponent decreases from 9.67 for the unheated case to 7.67 for the highest temperature case. Note that the data fall in clusters with the highest temperature giving the lowest level at the higher acoustic velocities. On the basis of the database generated in the Boeing Low Speed Aeroacoustic Facility (LSAF) Viswanathan (2006) developed scaling laws to identify the different components of jet noise. He argued that the jet total temperature was an important parameter and that,
|
Figure 6. Variation of OASPL with jet velocity, D = 2.45 in. Inlet angle = 160°. □, Tt/Ta = 1:0; O, 1.8; △, 2.2; x, 2.7; •, 3.2. (From Viswanathan (2004), with permission) |
In addition, the OASPL can be scaled by,
|
( |
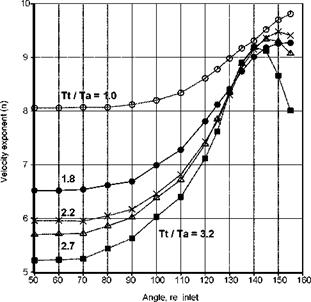
The variation of the velocity exponent with inlet angle and temperature ratio is shown in Figure 7 from Viswanathan (2006). The exponent is relatively uniform for lower inlet angles and then rises rapidly in the peak noise radiation direction. At 90° the exponent falls monotonically with increase in temperature ratio, being approximately 5.6 for the highest temperature. An example of the collapse of the spectra at 90° is shown in Figure 8 from Viswanathan (2006)). All the spectra for the subsonic cases collapse very well. The lines show the spectra for supersonic cases where broadband shock-associated noise becomes evident (See Section 2.2). If it assumed that the mixing noise spectra would also continue to collapse if the supersonic cases were ideally expanded, then the scaling laws and spectral shapes not only provide a method for noise prediction (see Viswanathan (2007)), they
|
Figure 7. Velocity exponent for various angles and jet stagnation temperature ratios. (From Viswanathan (2006)) |
also provide a means for the separation of mixing and broadband shock – associated noise. An example is shown in Figure 9 from Viswanathan (2006). The mixing noise dominates at lower frequencies and is of the same order of magnitude as the shock noise at high frequencies. In the mid-frequencies, the spectrum is dominated by broadband shock-associated noise. Shock noise is described in the next section.


