Comparison of experimental and theoretical results
More detailed, than presented above, measurements of fbw velocity behind R were executed on 75% of height of a flawing path in the same assembly of the compressor. The axial gap between R and S in the specified cylindrical section made 23mm, and lines LL settled down on distances A = 6,8,10,12,14,16mm from trailing front of a R. The mutual circumferential position of stators was fixed (v = 0), and measurements were carried out in N=20 in regular intervals located points on the S pitch. At definition of value dWyki/dx in the series (4) spline-approximation of the second order on points o was used. As one would expect parameters of time-averaged vortical wake for extreme points A = 6mm and A = 16mm appreciablly differed from their values on interval A = 8 ^ 14mm. The profile losses coefficient, received on an mean part of an axial gap, is equal Z = 0,063 and was accepted further for the theoretical description.
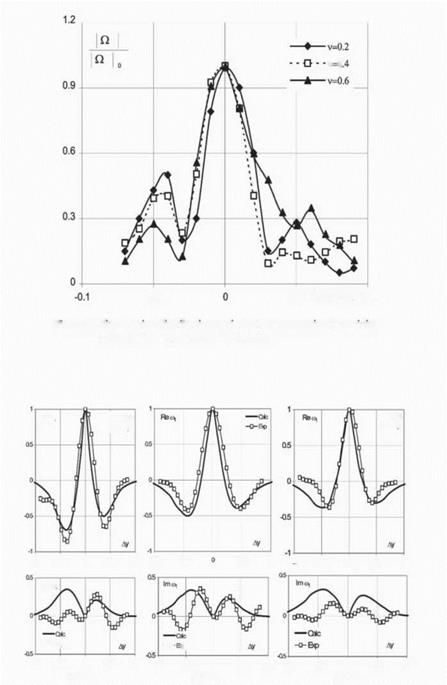
As illustration of experimental data on Fig.5 dependences from a variable n of values are presented
where complex amplitude fi1 of the first harmonic of the series (4) is determined in item 1, and yo is the ordinate of stationary vortical wake axes behind
the R blade, counted along a line LL. Dependences from Ay = y – y0 of values Re u1 and Im u1 are presented on Fig.5 for values A = 8,10,12mm.
Apparently from the received data, marked above the nonmonotonic change of free vorticity intensity at removal from an axis of a vortical wake is clearly shown in the presented experiments. It is necessary to note that the area of essential change of u1 in a vicinity of an vortical wake axis is much less than zone of a stationary vortical wake. It specifies rather small value of experimental diffusion constant of free vortexes.
For the theoretical description of dependence П| (Ay) the formula (8) was used, where the value of loss of the averaged velocity in a wake йі was accepted in the usual form for turbomachines [5]
 |
under formulas
where x and k0 are the given values.
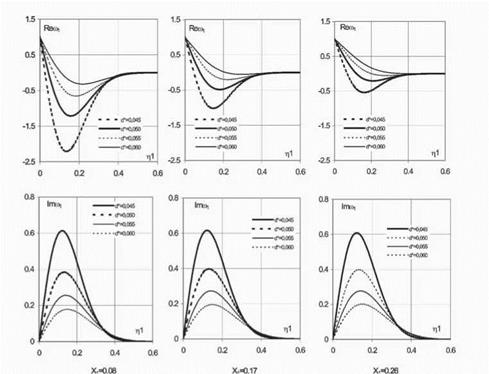
On Fig.6 dependences from n1 of values Re u1 and Im u1 are presented, calculated under formulas (10) and (11) for the following values of parameters: d* = koVd = 0, 045; 0, 050; 0, 055; 0, 060 and x = 0, 08; 0,17; 0, 26. On an abscissa axis on Fig.6 the value гц = 2коу/^/хї is put, equal to distance y from an axis of the vortical wake referred to it half-width.
Apparently from Fig.6, distribution of free vorticity at the given parameters of a stationary vortical wake in considered model of diffusion essentially depends on dimensionless diffusion constant d, which for the presented examples changes in limits d = (4,2 ^ 7,4) ■ 10-4. As a whole character of change u1 across a vortical wake qualitatively is coordinated to the features, which have
been found out in experiments. It allows to hope that the offered model of diffusion, limited to the first approach on powers of parameter x, allows to describe evolution of the first harmonic of free vortexes. As have shown similar calculations, for the second harmonic on time results are less satisfactory, that probably specifies necessity of the account of the subsequent approaches on powers x.
Calculation of function и1 = wi(Ay) has shown that at d = 4.6 ■ 10-4 values Re u1 and и11 well are coordinated to the experimental data presented on Fig.5 on character of non-monotony. However thus the calculated width of a diffusion layer appeared essentially (in 1,5 times) less, than in experiment. It is possible to assume that it is caused by application of the theory to the field of the measurements, close located to trailing edges of the R blades. Actually character of free vortexes formation in the field of trailing edges, where thickness of a boundary layer is significant, may differ from the line of contact discontinuity, accepted in the theory.
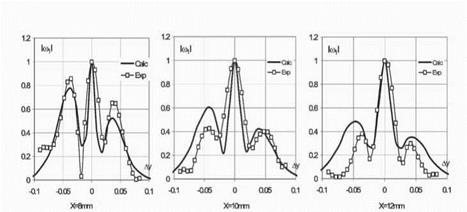
According to the specified assumption at calculation of и 1 the distance from the R trailing front was put equal to x = Д+0,13, that corresponds to presence in a trailing edge initial, = 0 thickness of a layer of free vortexes. The received calculated data in comparison to experiment are presented by continuous lines on Fig.5 and Fig.7.
Apparently calculation well enough describes results of measurements in a vicinity of an vortical wake axis on values Re u1 and u1. The greatest differences of the theory and experiment are observed in rather small value Im и1, that may be connected both with measurement errors, and with more essential inflience on Im и 1 of the subsequent approaches on powers x.
2. Conclusion
As have shown the executed in work experiments on measurement of unsteady flow velocity behind a rotor at its interaction with next stators the periodic free vortexes appear in a flow, caused by change of velocity circulation on the rotor blades.
For the description of structure of the vortical wake, containing free vortexes, the linear model of the isotropic turbulent diffusion is offered, taking into account change of velocity of free vortexes drift owing to loss of time-averaged fbw velocity in a vortical wake.
Comparison of experiment to the results of calculation, executed as a first approximation concerning intensity of a stationary vortical wake, shows that the offered model of diffusion of free vortexes correctly describes its mechanism. It is possible to expect that development of the model will allow to construct the semiempirical theory, describing evolution of unsttady vortical wakes, caused aerodynamic interaction of rows in an axial turbomachine.
References
Saren V. E., Savin N. M., Krupa V. G. (2000) Experimental and Computional Research of a Flow Structure in a Stator-Rotor-Stator System of an Axial Compressor, The 9th International Symposium on Unsteady Aerodynamics, Aeroacoustics and Aeroelasticity of Turbomachines (ISUAAAT), Lyon, France, September 4-8, pp 494-502.
Saren V. E., Savin N. M., Krupa V. G., Petrovitchev A. M. (2001) Inflience of a rotor-stator interaction on the steady and unsteady characteristics of the axial compressor, The report is adopted on XIInternational Symposium ISOABE, Bangalore, INDIA, September 2-7.
Saren V. E. and Smirnov S. A. (2003) Unsteady Vortical Wakes behind Mutually Moving Rows of Axial Turbomachine, Thermophysics and Aerodynamics, Vol.10, No.2.
Savin N. M. and Saren V. E (2003) Stator Clocking Effect in a System of Rows Stator-Rotor – Stator of the Subsonic Axial Compressor, 10th Intern. Sump. on Unsteady Aerodynamics, Aeroacoustics and Aeroelasticity of Turbomachines (ISUAAAT), Durham, North Carolina, USA, Sept. 7-11.
Samoilovich G. S. (1975) Excitation of Oscillation in Turbomachine Blades, Mashinostroe – nie, Moscow.
|
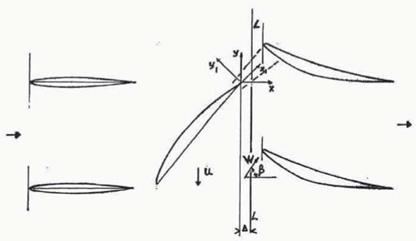
Figure 1. |
|
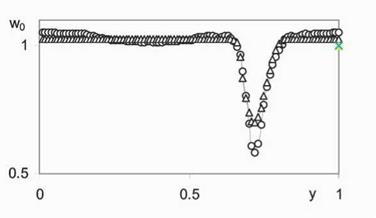
Figure 2. o-experimental distribution Wg(y), A – automodelling distribution |
|
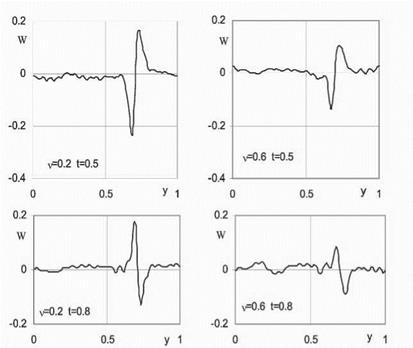
Figure 3. Experimental distributions W(y) for different values v and t, |
|
|||
|
|||
|
|||
|
|
||
|
|||

01 -0(6 0 QC6 Q1 – Q1 – ОСЬ
0Ф 01 лі 4X6 0 ОСЬ 01
Imco.
![]() -О-Бо
-О-Бо
■01 – О® 0 006 01 411 – О® 0 СКБ 01 -01 -006 0 0® 01
Figure 5. Distribution of the 1-st harmonic of free vortexes intensity along parallel front line
|
Figure 6. Teoretical distribution across vortical wake of the 1-st harmonic of free vortrxes intensity |
|
Figure 7. Distribution of amplitude of the 1-st harmonic of free vortexses intensity along parallel front line |


