Oblique Shock on Flat Plate (SWBLI)
In section 3.1 the sensor was tested for an oblique shock impinging the turbulent boundary layer of a flat plate. This case was investigated experimentally by Dus – sauge etal. [6] [7] with the corresponding configuration ofRe$1 = 19300, Ma = 2.3, and an oblique shock angle a = 8°. In the following three simulations are analyzed: A full domain RANS simulation with Spalart-Allmaras turbulence modeling was computed for the sensor application to determine the size of the computational domains for the zonal RANS-LES simulation. For comparison purposes a full LES was simulated and finally, a fully coupled zonal RANS-LES approach to validate the zonal concept. The LES domain indicated by the sensor evidenced in Fig. 1 is slightly extended since the synthetic turbulence generation needs additional space in the streamwise direction to evolve properly. Figure 9 presents the computational setup of the fully coupled RANS-LES simulation emphasizing the computational domains of RANS and LES as well as four control planes downstream of the LES inlet. The computational set up of the full LES simulation and of the LES part of the zonal RANS-LES simulation are given in Tab. 5 and Tab. 6, respectively. The number of grid points for the zonal RANS-LES simulation is more than 50 % lower compared to the number of points of the full domain LES simulation.
 |
Periodic boundary conditions are used in the spanwise direction and a no-slip, adiabatic condition is set at the wall. The top boundary uses characteristic boundary conditions to minimize spurious reflections from the other boundaries. The oblique shock is introduced at the inlet boundary applying the Rankine-Hugoniot conditions. The inflow condition of the RANS part uses the rescaling method of El-Askary et al. [8] while the inflow of the LES was set to the above described zonal SEM approach. At the LES outflow the condition of Konig et al. [15] was applied to ensure a proper transition of the turbulent flow properties from the LES to the RANS domain.
|
Table 5 Numerical details for the full LES simulation for the SWBLI case
|
|
Table 6 Numerical details for the LES domain of the zonal RANS-LES simulation of the SWBLI case
|
A sponge zone at the LES outflow ensures the damping of turbulent fluctuations. The streamwise evolution of the skin friction coefficient Cf is displayed in Fig. 10 (left). First, it is noticeable that the RANS, i. e., full RANS and zonal RANS part, and the full LES solution differ for this zero-pressure gradient boundary layer. This difference is caused by different grid resolutions of the full LES and the RANS domain. For all cases the onset of flow separation is located at about x/S0 = 4.5. The experimental results of Dussauge et al. show an increased Cf level at the inlet compared to the full LES and predict the separation point slightly more upstream. The results of the full LES and the zonal RANS-LES regarding the length of the separation bubble are in good agreement with the LES results of Garnier et al. [11]. Downstream of the interaction zone the increase of Cf is very similar between experiments, full LES and especially the zonal RANS-LES solution where the LES to RANS transition method of Konig et al. [15] proved to provide good results. One can notice that the result quality of time averaged Cf of LES and zonal LES is clearly superior to that obtained by a RANS approach in the same configuration.
Figure 10 (right) compares the van Driest velocity profiles obtained at x/S = 3.3 which is located slightly upstream of the interaction zone. All computations show the expected asymptotic near wall behavior. However, the logarithmic region of the full LES computation lies somewhat above the analytic result because the streamwise grid resolution. The corresponding profile of the zonal RANS-LES solution is located in between that of the full RANS and that of the full LES as it just passes the control planes and hence, still contains the shear stress profile of the target RANS values.
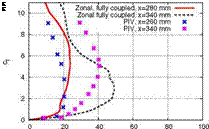
In Fig. 11 (left) the comparison of PIV results [6] with the zonal RANS-LES outcome of the wall-normal velocity fluctuations is given. At position x = 280mm (x/So = 3.2), which is about two boundary layer thicknesses downstream of the PIV measurement position, the fluctuations show a higher intensity at the middle of the boundary layer than the corresponding PIV measurements. This is due to the
 |
 |
Fig. 10 Longitudinal evolution of skin friction coefficient Cf (left) and van Driest velocity profile (right) for SWBLI flow case for different computational – and control plane configurations
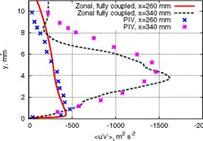
Fig. 11 Comparison between PIV [6] and zonal RANS-LES of the rms-wall-normal velocity fluctuations (left) and of the Reynolds shear stress (right)
STGM at the inlet which assigns too much energy in the outer part of the boundary layer. At position x = 340mm (x/ 8 = 9)the high energy fluctuations which were introduced by the STGM at the inlet in the outer part of the boundary layer did not survive the interaction region and the fluctuation level decreases below that of the PIV measurements.
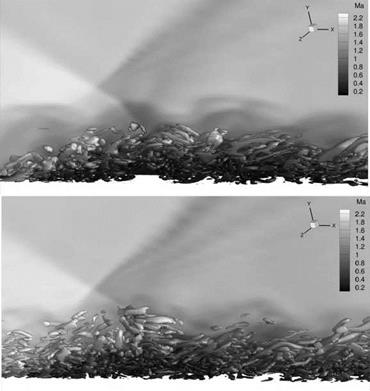
Figure 11 (right) represents a similar comparison for the Reynolds shear stress. The distribution at x = 260mm (x/8 = 1)) shows a good agreement between the zonal RANS-LES results and the PIV measurements. Downstream of the interaction zone, at x = 340mm (x/8 = 9), the results of the zonal RANS-LES agree again fairly well with the PIV measurements. The A2-structures at the interaction zone of the oblique shock and turbulent boundary layer for the full LES and the zonal RANS-LES simulation are depicted in Fig. 12. Large coherent structures are formed at the proximity of the impinging shock which transport the maximum of the turbulent kinetic energy towards the center of the boundary layer. Such turbulent features are evident in the full LES and the zonal RANS-LES solution.
|
Fig. 12 Я2 structures in the shock boundary-layer interaction zone computed by (top) a full LES and (bottom) a fully coupled zonal RANS-LES |


