Rate Effects, Two Examples
In this section two examples from computational studies of rate effects in hypersonic flows are presented and discussed. The first example is a shockwave flow in the presence of vibrational and chemical rate effects (DAM 1 = O(1)), the second a nozzle flow of a ground-simulation facility with high total enthalpy (“hot” facility) with freezing phenomena (DAM 1 ^ 0).
5.5.1 Shock-Wave Flow in the Presence of Rate Effects
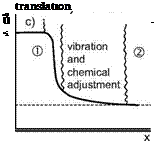
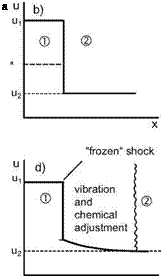
The shock wave, Section 6.1, basically is a small zone in which the velocity component normal to the wave front (vi) drops from supersonic (Mi) to subsonic speed (v2, M2). This is shown for a normal shock wave in Fig. 5.4. The velocity drop is accompanied by a rise of the density and the temperature. Translational and rotational degrees of freedom adjust through this zone to the (new) conditions behind the shock wave, Fig. 5.4 a). Because this zone is only a few mean free paths wide, the shock wave in general is considered as discontinuity, Fig. 5.4 b).
 |
 |
Fig. 5.4. Schematic of a normal shock wave in presence of rate effects (following [1]). ’1’ denotes ’ahead of the shock wave’, ’2’ is ’behind the shock wave’, a) normal shock wave, b) shock wave idealized as flow discontinuity (a*: critical speed of sound (see Sub-Section 6.3.1)), c) shock wave with all rate effects, d) situation c) idealized with “frozen” shock.
The situations changes in high-enthalpy flow. Here the temperature rise in the shock wave leads to the excitation of vibrational degrees of freedom and to dissociation. However, because of the small extent of the zone, the adjustment to the new conditions takes longer than that of translation and rotation. The result is a “relaxation” zone with non-equilibrium flow, and hence a much increased actual thickness of the shock wave, Fig. 5.4 c).
Also here we can approximate the situation. Fig. 5.4 d) assumes, that the adjustment of translation and rotation is hidden in the discontinuity like in Fig. 5.4 b), whereas vibration and chemical reactions are frozen there. Their adjustment then happens only in the relaxation zone behind the discontinuity.
Now to some selected numerical results from a study of hypersonic flow past a cylinder [12]. The flow parameters are given in Table 5.3. The computations were made with a Navier-Stokes method in thin-layer formulation with several assumptions regarding thermo-chemical non-equilibrium. The case of perfect gas is included.
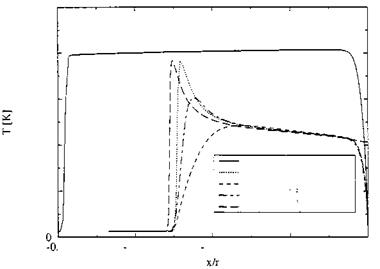
Fig. 5.5 shows for perfect gas a shock stand-off distance of x/r « —0.4, much larger than that for the non-equilibrium cases with x/r « —0.25
 (we will come back to this phenomenon in Sub-Section 6.4.1). The temperature behind the shock is nearly constant. It reaches shortly ahead of the cylinder approximately the total temperature T0 = 8,134 K and drops then in the thermal boundary layer to the prescribed wall temperature Tw = 600 K.[48]
|
Table 5.3. Parameters of the flow at the cylinder under reentry conditions at 53.5 km altitude [12].
|
The translational temperature together with the rotational temperature initially reaches in the two (one with adiabatic wall) non-equilibrium cases nearly the perfect-gas temperature. It drops then fast in the zone of thermochemical adjustment due to the processes of dissociation, Fig. 5.6, and vibrational excitation.
10000 8000 6000 4000
|
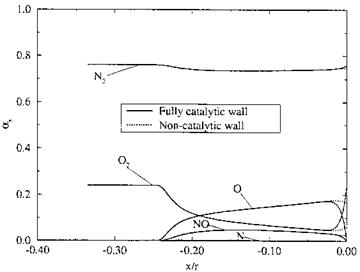
Fig. 5.6. Distributions of species mass concentrations (as = ші) along the stagnation line ahead of the cylinder between shock and cylinder surface for two different catalytic wall boundary conditions [12]. |
With the adiabatic wall case (Tr « 4,000 K) the shock stand-off distance is slightly larger than with the isothermal wall case with Tw = 600 K (see also here Sub-Section 6.4.1). The vibrational temperature of oxygen TvibrO2 adjusts clearly faster than that of nitrogen TvibrN2. Thermal equilibrium is reached at x/r « —0.17.
The distributions of the species mass concentrations are shown in Fig. 5.6 for a fully catalytic and for a non-catalytic surface. We see that the concentration of N2 does not change much. It reaches fast the equilibrium state. At the wall it rises slightly, and in the case of the fully catalytic wall it reaches the free-stream value, i. e., nitrogen atoms are no more present (the mass fraction of N anyway is very small, because the atoms combine with O to NO), and NO also disappears almost completely. The concentration of O2 decreases up to the outer edge of the thermal boundary layer at x/r « —0.025 and then increases strongly in the case of the fully catalytic case, reaching, like N2, the free-stream value. The effect of the non-catalytic wall is confined to the wall-near region.


