Datum Profiles
In this section, the results from a high speed and a low speed cascade both being the model of an existing LPT blade are compared for steady and unsteady
fbw conditions. The comparison includes Mach number (velocity) distributions, profile loss measurements and surface mounted hot-film measurements.
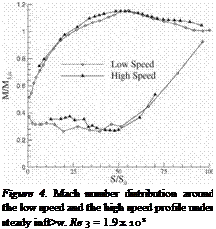
4.2.1 Mach number distribution. Figure 4 shows a plot of the distribution of isentropic Mach number for the high speed and low speed cascades under steady flow conditions. The values are non-dimensionalised by the exit isentropic Mach number. The suction peak occurs at 55% of the suction surface length for both blades. The ratio of the maximum surface isentropic Mach number to the exit isentropic Mach number is about 1.15 for both profiles. The ft>w separates at about 75% of the suction surface length for both cases. Differences are seen in the region covered by the suction side separation bubble. For a similar length of bubble in both blades, the acceleration due to the blockage of the bubble is bigger in the case of the high speed profile. This is due to compressibility effects. For both profiles, the ft>w is attached to the blade surface at the trailing edge.
 |
 |
According to Banieghbal et. al, 1995, a pressure side separation bubble occurs on both blades. The Mach number distributions show differences in this region. These could be due to errors in the measurements of the very low velocities associated to the bubble on the low speed profile. The length of the bubble is the same for t he high speed and the low speed profile. The bubble extends up to 50% of the pressure surface length. From this position, the ft>w accelerates towards the exit value.
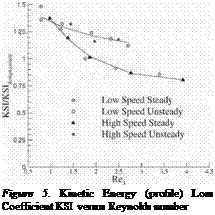
Cascade losses. Pitchwise traverses were performed at midspan behind the high speed and low speed cascade in order to measure the profile loss. Figure 5 shows a plot of the profile losses against Reynolds number for steady and unsteady inflow conditions for both cascades. The design exit Mach number of the high speed blade is 0.64. The kinetic energy loss coefficient KSI is used for the high speed cascade to allow a comparison to be made with the low speed cascade. This is because it is equal to the stagnation pressure loss coefficient when the flow is incompressible. It is seen in the figure that the same trends and the same absolute levels of losses are found for the low speed and high speed cascades. This is true for both steady and unsteady inflow conditions. Figure 5, on its own, answers the question regarding the validity of the low speed approach for the case under consideration.
The LPT blade that both cascades model was designed without considering the effect of unsteady inflow. At Re 3 = 1.90 x 10⁵, a small suction side separation bubble features on the blade under steady inflow. When wakes are present, wake induced transition always happens near the separation point. The suppression of this small bubble does not produce any benefit. Instead a penalty occurs because more surface is covered by turbulent flow thus increasing the losses. At Re3 = 0.88 x 10⁵, the size of the separation bubble increases, being more detrimental in terms of losses. Therefore, the suppression of the separation bubble by the unsteadiness at this condition produces a benefit in terms of losses. The curve of unsteady inflow conditions crosses the one for steady infbw at about Re 3 = 1.00 x 10⁵.
Hot films results. Up to this point, the comparison between the high speed and the low speed cascade has been made on the bases of profile loss measurements and Mach number distributions. A comparison of the state of the boundary layer along both profiles is also needed. Multi-element hot film anemometers were used to study the development of the blade surface boundary layer. The description of the technique and the description of the presentation of the data can be extensively found in literature (e. g. Banieghbal et. al, 1995).
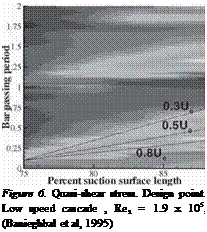
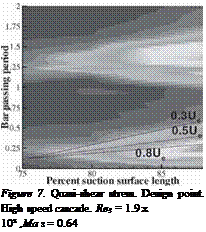
The anemometers were fitted at the mid-span of the suction surface of the blade in the central passage Figure 6 and figure 7 present distance-time, ST, diagrams of quasi-shear stress from one of the ensembles of the anemometer data, i. e., raw data. Both figures show data obtained at the design conditions. The same behavior can be identified in both cases. In the results obtained with steady inflow at the design point (not shown here), separation was seen to occur between 75% and 80% of the suction surface. The latter is true for the low speed and the high speed cascade. Figure 6 and 7 show that the onset of transition is moved upstream periodically due to the wake passing effect. Along the wake induced path, the onset of transition occurs near to the point
 |
 |
of steady separation. From the onset of transition onwards, the typical wedge shape proper of wake induced transition is seen (Schulte, 1995). This wedge shape is caused by the dissimilar velocity convections of the different characteristic trajectories of the leading and trailing edges of the turbulent spots. Between the wake trajectories, the fbw is still separated. Along these paths, transition occurs within the shear layer existing between the free stream and the separation bubble.


