INFLUENCE OF COMPRESSIBILITY ON AIRFOIL SECTIONS
In two-dimensional flow patterns, there is basically less cross-sectional area available than around three – dimensional bodies, into which air particles and stream tubes can be deflected. As a consequence, airfoil sections are particularly sensitive to compressibility.
Prandtl-Glauert Factor. As explained in Chapter XV of “Fluid-Dynamic Drag”, or in (l, a), the influence of compressibility upon the positive or negative static pressure differences along the sides of slender airfoil sections and upon the resulting load (lift) is essentially the same as that of an increase of the angle of attack. Therefore, in two – dimensional flow, pressure and lift coefficients increase (at least in good approximation) in proportion to the Prandtl-Glauert factor as in equation (2).
Pressure forces of lifting airfoil sections are plotted in figure 3. It is seen that lift coefficients, and the lift-curve slope grow in proportion to 1//9. It can also be concluded from this graph, and equation 2, that at M = 0.2, the influence of compressibility is comparatively small; the factor is 1 //З = 1.029. For example, the number of an airplane taking off or landing at sea level at 100 knots, is M = 0.15. Compressibility can, therefore, be disregarded in many realistic conditions, as it is in most of the chapters of this text. However, at M = 0.6, lift and other coefficients are expected to be 25% increased. Such increments are not found, however, in airfoil sections with thickness ratios above some 14%. For example, the 0018 section as tested in (6,f) exhibits a derivative (dCL /dec,) = 0.083, which remains constant up to M = 0.6. Increased and futher increasing viscous losses in the flow over the upper side are evidently responsible for this result.
(3) The Prandtl-Glauert rule is presented and improved:
a) Glauert, presented in ARC RM 1135 (1927); see a. so (l, c).
b) von Karman, Compressibility in Aerodynamics, J. Aeron Sci 1941 p 337.
c) Kaplan, On Lifting Elliptical Cylinder, NACA Rpt 834 (1946).
d) Kaplan, Transonic Similarity Rules, NACA Rpt 894 (1948).
e) Mathews, Pressure Distribution on Bodies, NACA Rpt 1155 (1953).
f) Goethert, Modification for Bodies, Ybk D Lufo 1941 p 1-156; NACA TM 1105.
(4) Characteristics of cambered airfoil sections:
a) See 66-Series Airfoils in (5,a) and 10% Sections in (5,e).
b) Graham, 66-210 Airfoil Section, NACA TN 1396 (1947).
c) Stack, 4412 Airfoil Pressure and Forces. NACA Rpt 646 (1939).
d) Becker, 23012 Airfoil Section, NACA W’Rpt L-357 (1941).
0 Lindsey, 24 Airfoils 16-Series to M = 0.8, NACA TN 1546 (1948).
g) Summers, 64AX10 Series Airfoils, NACA TN 2096 (1950).
h) Van Dyke, 16 Six-Series Airfoil Sections, NACA TN 2670 (1952).
do(JdCL = loVl —M^ (8)
This function is essentially confirmed in figure 4. For example, at M = 0.6, the angle of attack required to produce a certain lift coefficient is 20% smaller than at M -^-0. In both graphs, the experimental points are seen diverging from the theoretical function, at about M = 0.7, or at /l — M2 = 0.7. The critical Mach number has been reached in this case (for example by the 0012 section, at C L = 0) and the lift is higher, or the angle of attack lower, on account of a supersonic expansion along the upper side, when lifting.
The Minimum Pressure of a symmetrical airfoil section at zero lift in incompressible fluid (such as water, or in air at low speeds) is approximately
Срт, п=-2№) 0°)
where x = distance of the maximum thickness from the leading edge. Provided that the airfoil sections has proper camber, Chapter II, the negative pressure due to lift corresponds approximately to
Cpmin = — 0.7 CL (11)
These empirical functions are taken from the “hydro – dynamic” chapter of “Fluid-Dynamic Drag”. In the case of foil sections with thickness location between 30 and
in symmetrical airfoil sections exposed to incompressible fluid flow. As explained in Chapter II, the nose radius is
r/c = (r/t)(t/c) = (rc/t2 )(t/cf (15)
Л FROM LIFT DIVERGENCE О FROM DRAG DIVERGENCE X POINTS ABOVE CLi О Mcrit FROM PRESSURE (5,e)
H FROM DRAG DIVERGENCE (4Л 16-009

![]()
![]()
![]()
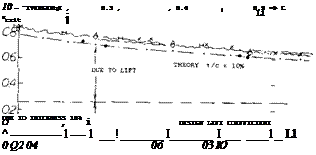
Figure 5. Experimental drag and lift divergence Mach numbers of a family of cambered 64AX 10 airfoil sections (6,g) as a function of their design lift coefficients.
Leading Edge. The correct camber for CL = 0.5 would theoretically (see the “airfoil section” chapter) be around 4% of the chord. Such a section would not be considered to be practical for high speed wings. Camber in the order of 2% was often used in airplanes, say around 19^0. Even such modest camber is not very desirable in high-speed airplanes because of pitching and wing-twisting moments. Symmetrical sections may thus be preferred. When lifting, very high peaks of velocity and minimum pressure are developing around the nose of such sections. Regardless of section thickness (within conventional limits) these pressure peaks are theoretically a function of the nose radius r. As pointed out in (11) the peak is expected to correspond to
— /(r/c) [59]
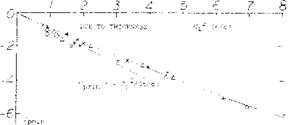
where (rc/t2) = constant in a family of similar sections. For example, (rc/t2) = 1.1 in the 4-digit series of airfoil sections, and ~ 0.07 in NACA’s 64-series. Pressure distributions are reported, for example around the 64A010 section in (5,d). At lift coefficients somewhat above 0.2, this section develops a pressure minimum above the leading edge. At higher lift coefficients, this minimum grows into a very sharp peak. For example, at Cj_ = 0.6, the coefficient is Cpm(n ^ —2. Various experimental results are plotted in figure 6, as a function of CL. This part of the theoretical prediction as in equation (14) is thus confirmed. Because of viscous losses in the flow around less rounded edges, very high pressure coefficients (proportional to 1/r, as in equation 14) do not come true, however. Rather, the minimum pressure coefficient is statistically found to be a function of CL /(t/c), as noted in (20).
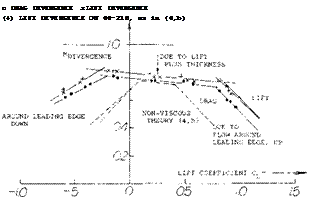
Divergence. Below C{ = 0.2, the 64A010 section mentioned above, develops two pressure minima, one due to thickness and lift (near the location of maximum thickness) and one due to lift at or above the nose. The same two minima and the subsequent divergent Mach numbers (where drag and lift diverge from their steady variation, the drag rapidly increasing and the lift decreasing) are found in figure 7. the close-to-horizontal lines correspond to those in figure 5, while the two lateral branches represent the flow around the leading edges as in figure 6. The CL level of the “bucket” corresponds to camber or design lift coefficient. The CL size in terms of upper and lower limit is larger in thicker sections, and smaller in thinner ones.
(6) Airfoil Sections as a function of Mach number:
a) Nitzberg, With 6 to 15% Thickness Ratio, NACA RM A1949G20.
b) Berggren, Leading-Edge Radius and Thickness, NACA TN 3172 (1954).
c) Wilson, 6 to 12% Sections 64-Series, NACA RM L1953C20.
d) Daley, Various Sections in Open Tunnel, NACA TN 3607 (1956).
e) Goethert, Airfoils in the DVL Tunnel, ZWB Rpt FB-1490 (1941); see Canadian Nat Res Laboratories Translation TT-31 (1947).
0 Goethert, In DVL Tunnel, Lilienthal Rpt 156 (1942); NACA TM 1240.
g) Goethert, Airfoils and Wings, Wright Field Lecture Notes 1948.
h) Loftin, 10% Thick Airfoil Sections, NACA TN 3244 (1954).
 Pitching Moment, As explained in Chapter II, the longitudinal moment consists of two components, one due to camber and one due to lift. Both of them could be expected to grow according to the Prandtl-Glauert rule, that is in proportion to the pressure differentials and the lift arising in an airfoil section. As shown in (4,h) such variation of the moment due to camber (corresponding to Cu = 0.2) may actually take place. Other sources (4,d, f,g)(12,a) show essentially constant CmQ values, particularly for the 230 series (8), while airfoils tested between wind-tunnel walls (4,g)(6,b) exhibit rather irregular variations at higher lift coefficients and higher Mach numbers. If in doubt, the Cmo values grow somewhat in negative direction (nose-down) as the M’number is increased. The growth is restricted, however, by increasing viscous losses.
Pitching Due to Lift. It is known (see figure 30, Chapter II) that contrary to theory, the longitudinal moment due to lift grows progressively more positive (or less negative) as the thickness ratio is increased. Because of viscosity (boundary layer) thicker sections lose lift on their upper side, and this loss is made up by increased suction. around the leading edge. As seen in figure 8 the “one-sided thickening of the boundary layer” evidently increases, together with the Mach number. The static stability derivative (dCm,/dCL ) increases in positive direction (particularly in thicker sections), which means a reduction of static longitudinal stability (pitching up). As a consequence of section losses around the leading edge, really
thin sections such as 0004 in (4,b) exhibit ————– Cm
values, hardly affected by the Mach number. Since CL increases at the same time, their derivatives (dCm /dCL ) reduces as the M’number is increased.
|
-8L і I! f I I I _ |
О 64A010 45° YAWED WING {5 , о ) "SWEPT " ОНА ‘:’TER
0 0015 AND 18 SECTIONS (6,e, i:)
Л ОООЭ AND 12 SECTIONS (6,e)
X 0006 AND 9 SECTIONS (6,1)
+ 64A410, 64A006 AND 10% (5,d}
Figure 6. Kvaluation of minimum pressure coefficients around the leading edge, primarily of symmetrical airfoil sections.
Figure 7. The critical and divergent Mach number of the 63-210 and 64-210 airfoil sections (6,h).
Sharp Leading Edges are used in airfoil sections intended to be flown at supersonic speeds. One and the same series of 6% thick symmetrical sections are investigated in (7,a) and (7,b). Around a’ =0, and CL = 0, the lift-curve slope is highest in the 0006-63 section. However, as listed in figure 9, at ex’ = 4 , the normal force coefficient is practically the same for all 4 sections shown. Also, the Mach number at which the maximum lift coefficient (near stalling) is obtained is essentially the same (M = 0.8) for all sections. Although CLX is lower than for rounded edges, the flow manages to get around the sharp edges. In fact, at M = 0.4, the pressure distribution is basically the same in all 4 sections. At higher Mach numbers (say above 0.6) an area of supersonic flow develops, starting near the leading edge and eventually collapsing by way of a shock (sudden compression) at a location between 40 and 60% of the chord. The minimum pressure coefficients are in the order of Cpmm “ —1.7 at M around 0.7, independent of the nose radius. The largest differences are found in the drag coefficient, which grows (at or = 4 ) from 0.010 to 0.035, as the nose radius is made smaller and smaller (reduced from round to sharp). In conclusion, in the subsonic speeds range sharp-edged sections are not very efficient. They do develop lift, however; up to and above M =0.8. The angle of attack for stalling separation from the upper side when approaching Clx reduces from 9 or Uf at M = 0.4, to 7 or 8° at M = 0.8.


