LEADING-EDGE OR NOSE FLAPS
The camber of a section, especially at the leading edge of an airfoil, improves the flow around the nose, especially from the stagnation point on the lower surface to the upper surface. Since the camber level needed to prevent separation at the higher lift coefficients is large and results in high drag at low cruise lift coefficients, o:her devices are used. Thus, instead of camber, leading edge devices similar to trailing edge flaps are used to improve the flow about the leading edge.
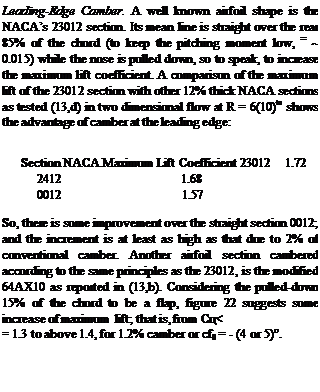
Nose Shape. In Chapter IV it was shown that in sections with little or no camber and a small radius, the flow separated at fairly low angles of attack near the leading edge causing the airfoil to stall. This is illustrated by the test data of (13,c) given on figure 32 for airfoils with various leading edge shapes.
 |
 |
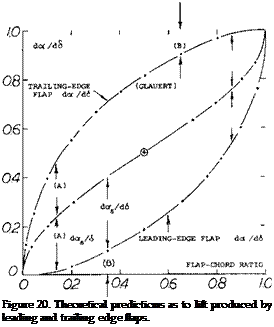
Flap Theory. The improvement in Cux obtained by leading-edge camber are limited to an increase of less than 10%. A much more effective method is to deflect the airfoil-section nose in form of a movable “flap”, as shown in figures 21 and 23, for example. An ingenious analysis encompassing both trailing – and leading-edge flaps, is presented in (14,b). Figure 20 shows the theoretical results of this study for lift variation due to nose-flap deflection, for the optimum or symmetrical lift coefficient and for the lift due to trailing-edge deflection. It is seen in the graph that lift due to deflection of nose flaps, is practically zero, for chord ratios, say up to 10%. To be sure, there is a decrease of lift (at constant angle of attack) particularly when using larger-size flaps.
Stalling Angle. As pointed out in (14,a) stalling from the nose of an airfoil section takes place when the stagnation point reaches a critical location “below” that nose. Denoting the angle of attack at which the flow comes onto the leading edge “smoothly”, meeting it in a “symmetrical” manner thus placing the stagnation point right onto the nose, by the subscript “s”, this angle approximately corresponds to
do£6 /dcf0 = – (2/tr) fc0/c;
C L6 = (dC L /doc )(2/тг) sincf0 Tc0/c (12)
where cf0 = angle of nose-flap deflection, negative when pulling the flap down (so that оCs becomes positive). In other words, оCs is naturally increased when bending down the leading edge “into” the oncoming flow. For small flap-chord ratios, the “symmetrical” angle of attack is approximately
(*5~ cf NTc0 /с (13)
Suction pressures “above” the nose vary as (at — оCsf. Assuming that there is a critical Cpmm (behind which stalling takes place) it may be expected that the maximum lift coefficient in two-dimensional flow, is
CLX =CL* + 2іГ(оС -<*s) (14)
where x indicates a maximum value, depending on parameters such as nose radius and Reynolds number. If this value is constant for a given airfoil, it can be concluded from equation (13) that
AClx =CL5^ cf n/^/c (16)
A more accurate, complete function for, is included in figure 20. It should be noted that this graph is anti – symmetrical insofar as A = A, and В = В. The physical meaning of this symmetry is that in a trailing flap as well as for a correctly deflected leading flap, the stagnation “point” is at the leading edge.
|
Figure 21. Hinged section nose; influence upon lift of airfoil section. |
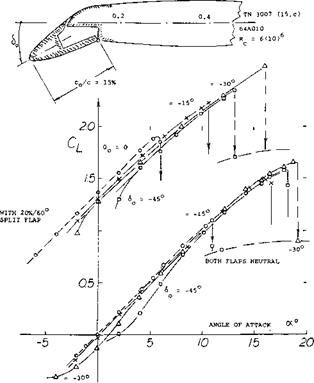
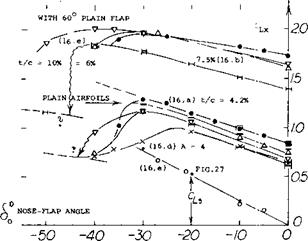
Optimum Flap Angle. In the particular configuration shown in figure 21, the maximum lift coefficient of the otherwise plain airfoil, is increased from CLX = 1.1 to a maximum of 1.66 for an optimum leading-edge deflection of cf0 = — 30 . The same and other results are plotted in figure 22, as a function of the theoretical nose-flap parameter d lc0/c as in equation (16). It is seen, indeed, that A Cu « C. Stalling takes place at higher lift coefficients, where the upper side of the airfoil is no longer able to support the flow against a strong pressure gradient.
![]()
Hinged Noses have been tested (15,a) as early as in 1920. Some more recent results are presented in figure 21. In combination with a standard 20% and 60° split f ap, some deterioration of lift can be seen in the graph, growing as the deflection of the nose flap is increased from zero to — 30 and — 45°. Since the tests were conducted between wind-tunnel walls, it can be suspected that some boundary-layer interference is involved, in the “corners” between airfoil and walls. Some of the deterioration is also likely to be genuine, caused particularly by the negative pressure gradients around the bends of the flaps, followed by positive gradients.
(15) Experimental investigation of nose flaps:
a) Harris, Biplane With Variable Camber, ARC RM 677 (1921).
b) Lemme, With Hinged Slotted Nose, ZWB 1676 (1944); NACA TM 1108 and 1117.
c) Kelly; 64A10 with Slat, Leading & Trailing Edge Flaps; NACA TN 3007 (1953).
d) Kelly, Loads on Slat and L’Edge Flap as in (c), NACA TN 3220 (1954).
e) Gambucci, 0006 With Leading and Trailing Edge Flaps, NACA TN 3797 (1956).
f) Spence, On 40 Swept Airplane Model, ARC RM 2752 (1952).
|
-03 -0.2 -0.1 ‘ 0 Figure 22. “Symmetrical” and maximum lift of (round-nosed) airfoil sections, as a function of the theoretical (14,b) le ading-edge flap parameter. |
Reynolds Number. In all leading-edge flaps, the boundary-layer flow is or can be laminar. Testing for example, an airfoil at Rc = 10*, the R’number of a 10% flap is only 105. At a number Rc = 10to, a 0009 section investigated in (15 ,b) only shows CLX =0.7 for the plain airfoil, while with optimum nose flap, CLX = 1.3 is obtained. So, there is an appreciable increment. It still seems, however, that the flow remains laminar in this case, up to and beyond the bend above the leading-edge flap and may then separate because of the positive pressure gradient necessarily aft of the bend.
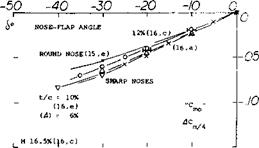
Leading and Trailing Edge Flaps. With the combination of leading and trailing edge flaps an increase in the maximum lift coefficient to a higher level is obtained. As seen in figure 22, the increment due to nose-flap deflection is approximately constant depending upon size, type and angle of the trailing-edge device. However, approaching sincf fcjc = – 0.2, which corresponds to 6C =: — 30 for a 15% nose flap, separation and stalling takes place somewhere on the upper side of the airfoil. Another consideration regarding the use of flaps, are the pitching moments necessarily produced by their deflection. Increments ЛСтд (or values of ACm^ taken at constant CL, are plotted in figure 26. By comparison, the moment due to a 20% and 60° split flap corresponds to Cmo ~ – 0.20. Deflection of a nose flap thus increases the already strong and undesirable pitching, moments of flapped wings.
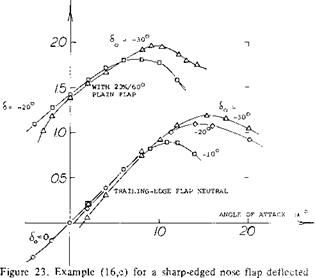
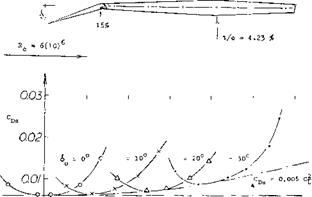
Sharp Leading Edges are as good (or possibly better than) rounded edges, as long as there is not much of a flow around them. As a consequence, deflection of such edges can lead to lift coefficients as high as those found in comparable round-nose configurations. This also means that the gain of the differential in maximum lift obtained by deflecting a sharp-edged nose flap, is greater than that for round-nosed sections. An example of a sharp-edged airfoil section is presented in figure 23. Due to separation the optimum nose-flap deflection of such sections can be expected to be more sensitive than round-nosed airfoil shapes (such as in figure 21, for example). In fact, their viscous drag plotted in figure 27, shows such pronounced minima, the best that CLS for any 6o can be determined. These values are included in figure 22. Looking closely (in figure 23), it is seen, however, that lift as a function of 6 is not very sensitive as to variations of 6©, say by + or — 10 as against the optimum (giving minimum drag).
|
|
|
from a circular-arc airfoil section. |
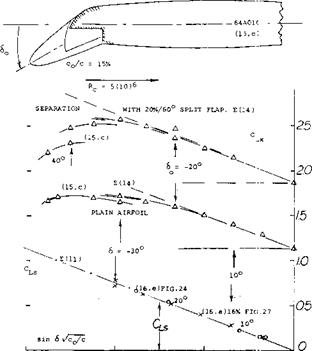
Maximum Lift. The mechanism of stalling in sharp-nosed airfoils is explained in Chapter IV and/or in (16,c). The maximum lift coefficient of sharp edge airfoils is given on figure 24. Laminar separation and turbulent reattachment of the flow over the upper side consumes some momentum. As a consequence, the CLX function of sections with sharp-edged nose flaps is no longer parallel to the Cus line (as in figure 22). It is also evident in figure 24 that in
combination with a trailing-edge flap, the increase of CLx with the nose-flap angle is still smaller. Although the differential in CLX due to the deflection of the leading edge flap is greater for a sharp edge airfoil, the actual CLX is lower than for a round nose section. CLx =: 2.0 for the sharp nose as compared with 2.5 to 2.6 for the round nose section, figure 22.
|
|
|
Figure 24. Sharp-edged airfoil sections; maximum-lift coefficients as a function of nose-flap deflection. |
(16) Investigation of sharp-edged nose flaps:
a) Rose, 4.3% Double-Wedge Airfoil with Flaps, NACA TN 1934 (1949).
b) Marshall, Double Arc Section With 17% Flap, ARC RM 2365 (1950).
c) Rose, Stalling of Sharp Airfoil With Nose Flap, NACA TN 2172 (1950). See also TN 1894 and 1923 (1949), and TN 2018 (1950) with various chord ratios.
d) Lange, Wing with A = 4 and Circular Arc Sections, NACA TN 2823 (1952).
e) Cahill, Summary Report on Forces of and Loads on Airfoils with Leading – and Trailing-Edge Flaps, NACA TRpt 1146 (1953).
f) Croom, With Leading – and Trailing-Edge Flaps, NACA RM L1957J15 (also with BL control) and L1958B05 (also with spoiler).
g) Powter, Biconvex Wing With Flaps, ARC RM 2157 (1946). [55]
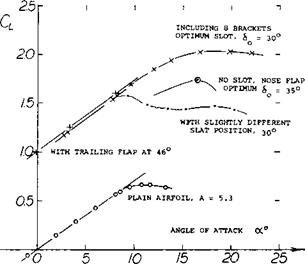
Comparison With Slat. A sharp-edged (biconvex) airfoil was investigated (I6,b) with leading – and trailing-edge devices. It is stated that “in view of the structural difficulties (of a slat) tests were also made using a simpler method”, namely a same-size nose flap. Maximum lift coefficients obtained at Rc ~ 10* with a slotted flap at 46°, are as follows;
clx =1 .55 for the airfoil with trailing-edge flap
= 2.02 with flap and optimum slat
= 1.75 with flap and 35° nose flap
The nose flap is roughly half as effective as the slat in this case.
Kruger Flap. The nose flaps presented so far, are simply portions of airfoil sections, suitably hinged so that they can be deflected. A different type is shown in figure 25, obtained by pulling out of the airfoil, or deflecting from its lower side, a comparatively thin extension of the chord. This flap is named after W. Kruger, who first investigated (17,a, b) various shapes at the AVA (Gottingen) in 1944. The Kruger flap is used in the inboard portions of some present-day swept wings (as in airliners). — Since this type of flap is extended forward of the basic airfoil chord, an increase of the lift-curve slope can be expected. This is seen to be true in figure 25, particularly when using the flap (a) on the otherwise plain airfoil. In combination with a trailing-edge split flap, lift coefficients (and pressure gradients) are evidently so high that interference (boundary-layer separation) takes place in the corners between suction side and the walls of the so-called two-dimensional wind tunnel used. Part of the deterioration can be genuine, however.
Nose Radius. As mentioned above, the gain in maximum lift obtained by the use of nose flaps, is particularly great for sharp-edged airfoil sections (where CLX is low, without any leading-edge device). The effectiveness of Kruger flaps is shown in (17,a) on various airfoil sections. Also considering the results as in figures 21, 22 and 23, the following statements can be made:
The effectiveness of nose flaps increases, as the leading-edge radius is reduced, particularly to below r/c = 1%. Maximum values of A CLX = 0.6 are obtained for supersonic-type sharp-edged airfoil sections (where Clxo = 0.6 or 0.7, only).
The increment in maximum lift can be expected to be small in round-nosed and well-cambered sections. For example, for a 12% thick airfoil with 4% reflexed camber, and r/c = 1.6%, almost no increment at all was found (17,a).
These statements may also be correct for leading-edge
slats.
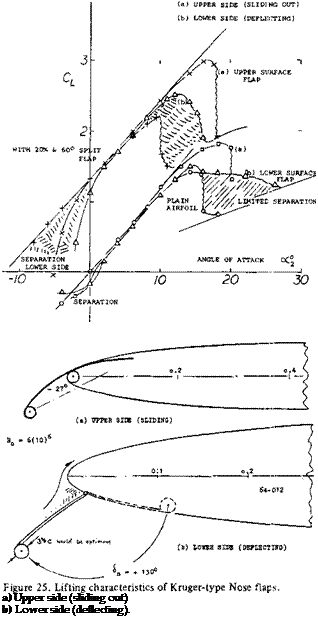 much improved. For the plain airfoil, a high lift coefficient is maintained up to оСг = 25°, which is some 10° beyond that for CLx. It seems that laminar separation first takes place at the leading edge of the flap. Subsequently, the flow reattaches in turbulent form to the upper side of the airfoil. Final separation starts near the trailing edge, gradually progressing forward. In combination with the split flap, stalling develops over a range of some 4° of the angle of attack. Thus, the lower-side Kruger flap can be used to induce gentle stalling (18). Considering practical operation of an airplane, the “permissible” maximum lift, staying away from a sudden loss of lift would thus become satisfactory.
Pitching Moments. Nose flaps represent a forward extension of the wing chord, which adds a positive tail-down component to the pitching moment. In the configurations shown in figure 25, the variation corresponds to
dCr^/dCL = +0.06 for type (a)
= + 0.05 for type (b)
Considering a flap extension in the order of 8% of the airfoil chord, a forward shift of the aerodynamic center could be expected, equal to 0.75 (0.08) = 0.06, which comes close to the experimental results. Approximately the same shifts were found when using the nose flaps in combination with a standard split flap. All these derivatives are positive (destabilizing), in a manner similar to that of slats. Kruger flaps (if not extending too far down) might help, however, to reduce the large nose-down pitching moments caused by Fowler or similar flaps.
|
R0 – 5(10)6 |
Stalling. Deflection of a leading-edge flap increases the angle of attack at which stalling takes place. For example, in figure 21, the increment is A oC between 8 and 10°. In combination with a split flap, stalling is quite sudden, however as seen on figure 25. In configuration (a) the lift coefficient drops from CLX = 3.0, to CLX = 1.9, at оC2 = 18°. Separation evidently “springs” from somewhere on or shortly aft of the nose flap. If the same flap would be used in combination with a cambered airfoil section, stalling might be more gentle (possibly beginning from the trailing edge). The (b) type Kruger flap in figure 25, can be deflected to any suitable angle. Maximum CLX is obtained for 6n = + (110 or 120) , in the definition as in the illustration. We have plotted results for 6n = + 130°, however. While the increment in maximum lift is not spectacular in this case, the quality of stalling is very
|
Figure 26. Pitching moments “C^’ of « 15% chord leading-edge flaps. |
(18) As pointed out in (10,e), damping by a positive dCL /doC in the wing tips is considered to be at least as important to prevent rolling over, as the maintenance of high lift.
Camber. The pitching moment of airfoil sections consists of two components. That due to camber or deflection of a nose flap, is plotted in figure 26 in the form of “Сюо” (defined for CL = 0) or ACmy4(taken for C L := constant), as a function of the angle of deflection. Converting the angle (25°) of the configuration as shown, into a dip ratio (y/c = (c0/c) sincfo = 6.3%) we find that the moment (АСтд = – 0.05) is of the same order of magnitude as that due to slats, in part (b) of figure 9. As mentioned in context with that illustration, the camber moment of nose flaps may also increase with their chord length.
peak at the knee is too high, so that separation occurs from some place aft of that bend in the surface. The investigation (15 ,b) indicates that a peak of the maximum lift coefficient is obtained when the flap is deflected so far, that the first peak almost disappears. In the configuration considered, that condition is found at 60 = — 45°, producing a CLXл = 1.33. A little bit of flow around the nose of the flap from the lower to the upper side is desirable, however. It seems that such a flow promotes transition to turbulence, so that separation at the knee is prevented or postponed.
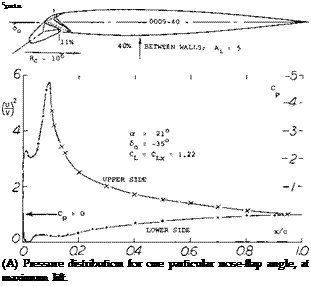
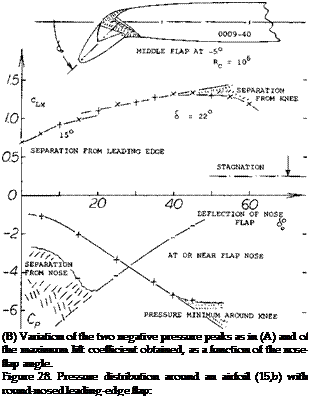
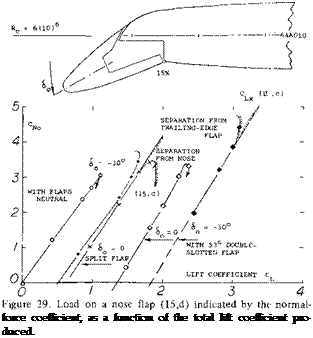
Flap Forces. Integration of a pressure distribution yields both the resultant force in a nose flap, and its hinge moment. Using the peak-pressure values as in part (B) of figure 28, as an indication for the flap load, some exchange between the two peaks evidently takes place, as the flap angle, or the angle of attack and the lift coefficient are varied. The magnitude of the normal forces is shown in figure 29, indicated by a coefficient based on chord or area of the flap. The derivative is
(dCNo/dC L) between (2.8 and 3.5) (20)
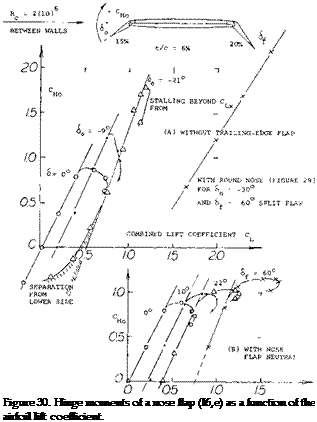
with or without trailing-edge flap deflected arid is also confirmed in (I6,e) for the round-nosed flap as in figure 30. When deflecting the nose flap and/or when using a trailing-edge flap, the load is reducing, corresponding to a lateral shift of the straight lines in the graph, by certain values of Д CL. Empirically, the load is zero:
a) when the lift coefficient CL or ACL is about half of that as in equation (12);
b) when CL or ACl is about half of the (ACt ) due to trailing flap as in Chapter V.
 Adding these two components, the lift coefficient in figure 29 is obtained.
 Hinge Moments of nose flaps consist of a component due to angle of attack and one due to deflection. For 60 = 0, the moment simply corresponds to a part of the airfoil lift or load. When deflecting a flap downward, the minimum pressure peak at or near the leading edge, reduces in magnitude, as shown in figure 28. Hinge moments “H” reduce accordingly. The coefficient
CM =H/qc0S0 = H/qc! b (21)
(where “o” refers to the chord of the nose flap) is plotted in figure ‘30, as a function of the total lift coefficient. The derivative dCH /dCL is approximately:
= 2.0 for the sharp-edged flap in the graph = 1.5 for the round-nosed flap as in figure 29.
The lateral shift in the lift coefficient is roughly:
|
Де. |
= |
CLSi equation (12) for sharp-nosed flaps. |
|
acl |
= |
1/2 CLS, for round-nosed flaps, |
|
дси |
= |
(A C’L ) as for the normal force, above |
The Kruger flaps deflected from the lower side (as in part (B) of figure 25) have loads and hinge moments different from those discussed above. As reported in (17,b) the normal-force coefficient varies between:
C^0 = -1.5 (down/back) at low lift coefficients
= + 3.7 (up/forward) at high lift coefficients
|
t/o*« 7.5 * |
|
25* ^ |
Elimination of the boundary layer by suction or restoration of its dynamic energy by blowing, are well-known means of keeping fluid flow attached. In Chapter V blowing over wing flaps is presented. The same type of control can also be used at or around the leading edge of lifting airfoils.
A. Control Through Turbulence or Vortex Generation Any of the leading-edge devices discussed in this chapter may be used to guide the flow around the leading edge. Separation (stalling) will subsequently take place, however, when and if the boundary layer remains laminar. Consideration of transition turbulence, mixing and vortex generation is, therefore, important.
Laminar Separation takes place very soon after a still laminar boundary layer is directed to flow against an adverse positive pressure gradient. Strong gradients of this kind are encountered at higher lift coefficients on and behind every flap or slat placed at the leading edge of an airfoil. The fact that those devices are effective, can be explained by reasons as follows:
a) The Reynolds number at the end of a flap or slat, is an order of magnitude larger than that “at” the not very round leading edge of a plain airfoil.
b) The mechanism of laminar separation, followed by transition and re-attachment may also be active, preventing separation from behind flap or slat.
c) Surface imperfections within a slot, or such as the gap near the hinge axis of a flap, may help or even be necessary to make these devices effective.
It is amazing that neither analysis (21,c), nor the numerous experiments with leading-edge devices, have really gone into the mechanism and/or into auxiliary means through which subsequent separation is prevented or postponed.
Transition. The optimum (out of 6) arrangements of a “leading-edge slat of rather unusual design” is presented in figure 31. It is debatable to call the “flap” a slat. Our explanation for the increase of lift from CLX == 1.74 to 2.02, due to the presence of the slot – is turbulence. The flow is likely to remain laminar to the end of the nose flap. It then separates, turns turbulent as it passes over the slot, and it meets the round nose of the main airfoil in this condition. In fact, a reduction of the maximum lift may be expected, if there were a flow through the slot.
|
16*
|
|
1.5 ft
Figure 31. Lifting characteristics of an “Unusual Design’’ of a leading-edge slat or flap (16,b). |
Vortex Generators have been investigated and are used on many aircraft primarily to improve the flow over trail – ing-edge flaps. The function of these devices is well described in (21,b). They are either ramps (or wedges) each forming a pair of trailing vortices like a little wing, or vanes (little half-span “wings” or plates) protruding from the wing surface at a lateral angle of attack thus producing each a tip vortex. When placing a number of such elements in a spanwise row within the boundary layer, a
(20) Pressure distributions, loads and hinge moments of nose flaps:
a) Kelly, Leading-Edge Flaps, as in (17,d).
b) Kruger, With Kruger Flaps, as in (20,b).
c) Lemme, Round-Nose Flap, as in (17,b).
d) Cahill, Sharp-Edge Flap, as in (18,e).
(21) Lachmann, “Boundary Layer and Flow Control’’, 2 Volumes, Pergamon Press (1961):
I) Summaries and Increase of Lift:
a) A major part of Volume I deals with trailing-edge blowing, and it is as such referenced in the “trailing-edge’’ chapter.
b) Williams, British Research (including nose suction).
c) Pleines, Slotted Wings (including Fieseler “Stork’’ and Dornier-27).
d) Basic considerations of separation control are presented in various places.
e) Wagner, Engineering Considerations of Suction and Blowing.
II) Primarily BL Control for Low Drag:
a) Most of Volume II deals with low drag, which is not part of this chapter.
b) Pearcey, Prevention of Separation by BL Control.
series of chordwise trailing vortices is formed. These heli – coidal vortices serve to exchange retarded particles of air near the surface of an airfoil with high-energy particles at the edge of the boundary layer. In short, momentum is transported toward the surface through mixing or turbulence. For vane-type generators placed on the upper side of an airfoil, in a single row the following dimensions are said (22,a) to be most effective:
|
h/c |
= i% |
for the height ratio |
|
y/h |
= 6 |
for the lateral spacing |
|
j2/h |
= 2 |
for the chord length of the vane |
|
A |
= 15° |
for the angle of yaw |
The size, height, of vortex generators “should be related to the range of surface for which they are required to be effective — rather than to any local boundary-layer conditions”. An example of the use of vortex generators is shown in figure 36, along the wing roots and ahead of the aileron.
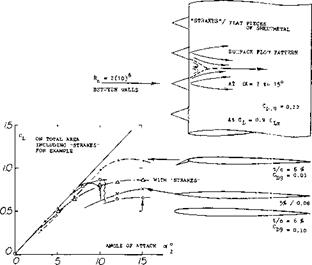
Increasing Lift. It is reported (22,c) that the maximum lift of the NACA 23012 section was increased 30% by means of turbulence generators which postpone separation from the trailing edge. The influence of leading-edge separation of a 6% thick section (22,f) was very small, however; CLx was increased from 0.8, less than 10%. When placing “generators” ahead of the section nose, the beneficial effect is of a different nature. “Strakes” as shown in figure 32, do not really increase the maximum lift. They change stalling characteristics, however; increasing the angle of maximum lift by some 5°. The pattern shows how the flow reattaches itself “immediately”, behind the protuberances as well as between them. — As far as nose flaps are concerned, it is suggested that the gap “around” the hinge axis, or the lip of the airfoil adjoining the flap, may produce transition and turbulence. In the case of slats, the
|
Figure 32. The influence of several leading-edge modifications (13,c) on the lift of a thin airfoil section. |
converging (nozzle-like) slot formed when extending the slat, must be expected to stabilize laminar flow. It is, therefore, suggested that turbulence generators placed within the slot might improve the effectiveness of the slat. In fact, the Messerschmitt slat as in figure 8(b) shows a sheet-metal step (into which the slat is intended to fit, when retracted); and this step may very well act as a transition trip. See also figure 4.
B. Boundary-Layer Control by Suction Around the leading edge of a conventional airfoil shape, the boundary layer is thin and laminar. Suction directly at the nose would, therefore, not make sense. There are some arrangements, however, whereby suction will guide the flow around the leading edge, subsequently preventing or postponing separation.
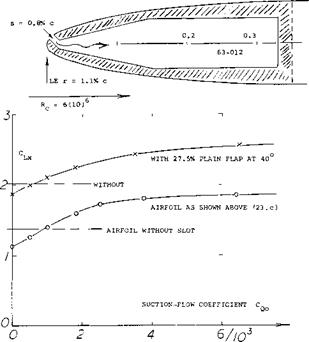
A Nose Shape, specially designed to be combined with boundary-layer control is shown in figure 33. Flow around the leading edge is accomplished by suction through a narrow slot as indicated. After most of the turning has been done, the flow is then directed against a comparatively modest pressure gradient along the upper side of the airfoil. As reported in (23,a): “unexpectedly, the increments in Clx correlated excellently in terms of the momentum sucked through the slot, not the Quantity” (25). The increase of maximum lift shown in the graph is impressive, however such nose shape would not be practical for high-speed flight.
(22) Mechanism of and experiments with vortex generators:
a) Pearcey, Prevention of Separation, last contribution in (28,11).
b) Bruynes (United Aircraft) Mixing Device, US Patent 2,558,816 (1951).
c) There is a number of unpublished reports, listed in (a). Other such reports by United Aircraft Corporation (1947/1954) are mentioned in (e) & (f).
d) Schubauer, Forced Mixing, J Fluid Mechs 8 (1960) Part I.
e) Spangler, Influence on Skin Friction, NASA Contractor RptCR-145 (1964).
f) Bursnall, Maximum Lift of 6% Section, NACA RM L1952G24.
g) As reported by McFadden in NACA TN 3523 (1955), “vortex generators (at 35-percent chord) were found to be effective in both the wing-dropping and pitch-up problems” of the North American F-86 swept-wing airplane, at Mach numbers around 0.9.
(23) High lift through leading-edge slot suction:
a) Williams, High-Lift Boundary-Layer Control, in Volume I of (28).
b) Williams, Theoretical Investigations (RM 2693) and Tunnel Tests (RM 2876) of Nose-Slot Suction, ARC Rpts (1950/52); see also (28,1).
c) McCullough, 63-012 Airfoil, NACA TN 1683 & 2041 (1948/50).
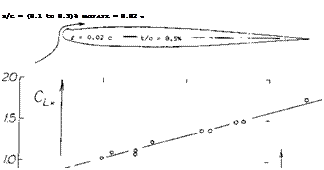 figure 40 of Chapter V, suction distributed over a certain chordwise area, therefore, seems to be more practical. Tests (24,f) on a 0006 airfoil section, with suction through perforated sheet metal backed with felt, show the following near-optimum situation:
|
Llx |
0.87 |
for the plain airfoil |
|
C« = |
0.69 |
with perforated nose |
|
CL ~ |
1.30 |
with suction, at beginning stall |
|
Cux |
1.40 |
with tunnel-wall interference |
|
x/c |
1% |
required area, from nose point |
|
Cq = |
.001 |
required for up to C u = 1.3 |
5 –
————————————– _j___________________________________________ і______________________
0 01 Q2 Q5
Figure 33. Boundary-layer control around the nose of a specially designed airfoil section (24,a, b) by suction through a narrow slot.
Because of severe tunnel-wall interference (3-dimensional flow pattern) stalling takes place over an interval of up to 8° of the angle of attack (whereby CL increases from 1.3 to 1.4). This type of stall is not typical for boundary-layer control by suction.
Leading-Edge Slot. The NACA 63-012 airfoil section was investigated (23 ,c) with various suction slots. Optimum dimensions (with or without a 40° plain trailing flap) were found to be as follows:
s/c = 0.06% for the width of the slot
x/c = 0.8% for the chordwise location
The maximum lift coefficient was increased as shown in figure 34. Up to Cq = 0.004 (or somewhat higher) separation from the leading edge is evidently being; eliminated, thus increasing lift by ДСи = 0.7 for a plain airfoil, or =
0. 6 (with trailing flap). Although “the abruptness of the stall was reduced” by suction, a margin of some 2 or 3 degrees in the two-dimensional angle of attack may not be considered to be satisfactory in the practical operation of an airplane. In the second phase of the investigation, another slot was added at 51% of the chord. Lift was further increased to CLX =2.4, and = 2.9 (with trailing flap). Stalling returned to being really abrupt, however. The drop from Cl = 2.4, is estimated to be down to CL =
0. 8 (as in NACA Rpt 824, without flap and without suction). In conclusion, this type of suction boundary layer control to increase of maximum lift, does not seem to have a practical value. It should also be noted that without suction, the presence of the slot reduces the maximum lift noticeably.
Distributed Suction. A slot such as in figure 33, for example, also has a sink effect (thus also drawing some air from upstream). Since this effect is comparatively small, the location of a slot having a width between 0.1 and
0. 6% of the chord, can be expected to be critical. As in suction applied to the nose of trailing edge flaps, see
|
Figure 34. Maximum lift of the 63-012 airfoil section, as a function of suction (23,c) through a narrow slot near the leading edge. |
(24) Area Suction around the airfoil nose:
a) Gregory, 63A009 Section With Nose Suction, ARC RM 2900 (1952).
b) Pankhurst, Stalling Properties, ARC RM 2666 (195 3).
c) Nuber, 64A212 Airfoil, NACA TN 1741 (1948).
d) Dannenberg, 10.5% Section, NACA TN 2847 & 3093 (1952/53).
e) Hunter, Flight Investigation, NACA TN 3062 (1954).
f) Weiberg, 0006 Airfoil, NACA TN 3285 (1954).
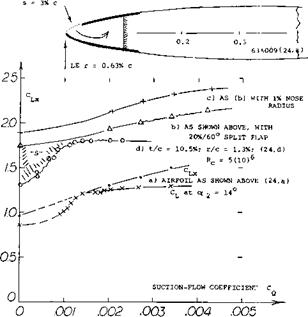
Lift Increments. Two other airfoil sections with area suction near the nose, are shown in figure 35. The maximum lift coefficient increases with the chordwise extent of the porous area (indicated by the flow coefficient CQ) in a manner similar to that due to slot suction, in figure 34. That is, leading-edge separation is more and more postponed, until at constant angle of attack (shown for a: = 14°) a certain plateau of lift is reached. The fact that the maximum lift continues to increase as the suction flow increases, can be explained by a general improvement of the boundary-layer flow along the upper side of the airfoils tested. The behavior of the 10.5% airfoil is different, however. Separation from the leading edge (indicated by the area “S”) is first eliminated. As above at constant angle of attack, a constant lift level is then reached, at CQ = 0.0015. Further increased nose suction does not postpone further stalling then taking place from the trailing edge. — The “most economical” extent of nose suction in the 63A009 section, is around 3% of the upper surface. When using a trailing flap, the increments in figure 35 may be slightly smaller (ACl = 0.4 or 0.5) than those for the plain airfoils (ACl = 0.5). In other words, more suction is required to handle increased BL losses and pressure gradients.
|
Rc = 1.2(10)6
Figure 35. Maximum lift of symmetrical airfoil sections, as a function of the flow coefficient indicating boundary-layer control by suction through a porous area near the leading edge. |
Porous Materials are needed to form the surface of an airfoil where boundary-layer control by suction is used. Various materials are listed (24,d) such as perforated sheet metal, paper, sintered metal, felt, wood, ceramic. Since the outside pressure is not constant in chordwise direction, suitable combinations (in layers) are selected in such a manner that any return flow across the porous area is avoided, and the suction velocity is kept reasonably uniform. The permeability of any porous material is reduced when wetted. As reported in (24,b) sintered bronze becomes “saturated” in a rain fall of 1 inch/hour, within 3 minutes, so that the suction velocity (at constant pump power) reduces to 40%.
The Pressure Required to move air particles from outside, into the hollow nose of the airfoil, primarily corresponds to the local static pressure coefficient at the surface. It should be noted that theoretically the total pressure (p + q) is to be considered. Within the boundary layer, the dynamic pressure q is low, however. For the 0006 suction discussed above, at Cu = 1.3, the coefficient of the static pressure differential is between Cp = — 30, directly at the nose point, and Cp == — 10, at the end of the 1% suction area. With a standard (20% and 60°) split flap deflected from the trailing edge, the Cp values are – 55, and – 20, respectively. As mentioned above, there can thus be a “circulation” of flow in and out across the suction area. — When sucking through a slot, there is some loss (due to sharp edges). Across a porous material, the loss is likely to be appTecIable. Approximately, the differential is д p — w, where w = Q/Sa = average velocity through the porous area. In the tests discussed (24,f), the suction velocity was in the order of w = 0.1V. For example, for w = 10 ft/sec, the pressure differential through the particular material used, is some 270 lb/ft2 . Considering this and a similar composition (of wire “cloth” and sheet metal) used in flight tests (24,e) a corresponding coefficient in the order of A CP =: 10 may be assumed. Summing up, a static pressure differential corresponding to A CP between 20 and 60, would thus be required to operate the 0006 suction system as needed. If including half of the potential dynamic pressure at the location of suction, we are left with a coefficient between 15 and 35. Static pressure coefficients of the 10.5% thick section in figure 35, are appreciably lower than those of the 0006 section. When approaching CLX, the minimum pressure peak reaches Cp = — 12, reducing to about half of this value at the end (at 3.5% of the chord) of the most effective suction area.
Stalling. The quality of the stall of the airfoils in figure 35, is similar to that in typical tunnel-tested symmetrical sections, with little margin some 2° of the angle of attack and a drop, for example from CL =1.8 or 1.7, probably down to 0.8 (as for the plain airfoil, in NACA Rpt 824). Although there is an improvement in stalling quality over the really abrupt type as in airfoils with slot suction, distributed suction (from near the leading edge) does not seem to be perfect either. Regarding other aspects of this subject, are covered in Chapter V.
(25) For definitions of CU. and CQ et cetera, see under “blowing” in the chapter on “trailing-edge high-lift devices”. Including losses in a blowing slot, the flow coefficient obtained, may only be 50% of (s/c) /Cp.
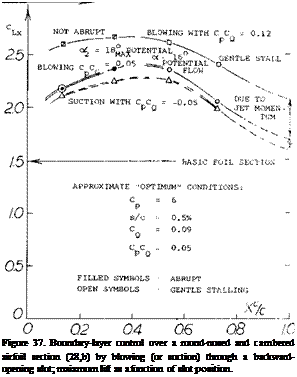
 In a Cambered Airfoil section, with a well-rounded upper side, separation (stalling) starts from the trailing edge. Boundary-layer control at or from near the leading edge is, therefore, not of very great value, as illustrated in (28,b), in comparison to blowing, the influence of suction is also more or less limited to the elimination of the boundary layer arriving at the slot. — The cambered section 64A212 was investigated (24,c) between wind – tunnel walls. A 2412 wing was flight-tested (24,e) on a small airplane. Principal results are as follows:
NACA 64A212 airfoil @C* = 0.002 CLX increased from 1.28 to 1.59 NACA 2412 wing @ Cq = 0.001 CLX increased from 1.30 to 1.62
Other results of the flight tests are:
a) With porous area, but without suction, CLX – 1.2 only.
b) Suction power may have been too small.
c) Some 60% inboard suction was as effective as full-span.
d) With small wing flaps down, CLX = 1.6, increased to 1.8.
e) With power and propeller on, there was hardly any increment.
f) In heavy rain, the suction power is doubled.
A Nose Flap. With a nose similar in shape to those in figures 21 and 22 a large increase in CLX is obtained when the boundary-layer material is removed around the knee.
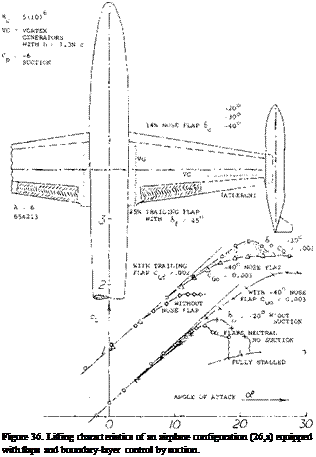
As shown in figure 36, C^x is increased from around 1.4 to 2.2. In fact, this type of flap is only effective when used in combination with suction. It is possible that without suction (and with a sealed surface) laminar separation takes place at or behind the bend of the flap. With a deflection 6C = — 40° rather than 20° the quality of stalling seems to be good, particularly in view of the 65-series foil section involved.
Trailing Flap. In combination with a part-span suction controlled trailing-edge flap, the lift coefficient of the airplane configuration as in figure 36, is increased from CLX = 1.86 without nose flap to 2.00 with 6 = 30° to
2.42 and with 60 = 40°, CQO = 0.003 to 2.65 (when adding vortex generators “VG” as shown). These values may not look as impressive as those likely to be found as the result of two-dimensional airfoil investigations. Including part-span effect and fuselage interference, they are close to reality, however. [56]
Power Required. As stated under i4pressure required”, directly at the nose, the external pressure coefficients of the 10.5% thick airfoil (figure 35) are considerably lower in magnitude than those of the 0006 section. The chord – wise dimension of the suction area required, is threefold, however. Roughly, the same internal suction power may thus be needed. This power can be determined, using the methods as presented in Chapter V. In doing so, inlet and outlet pressures of pump or blower have to be considered. Near the leading edge, the dynamic pressure (0.5 p Ua) of the potential outside flow can be very high, say 20 times the ambient dynamic pressure. Since primarily boundary-layer material is sucked into the wing, only some fraction of that pressure is recovered. When considering the outlet pressure (against which the pump is working) there are two possibilities:
a) discharge at some place, say into ambient pressure,
b)  blowing over a trailing-edge flap.

![]()


 Since the static pressure is low around the bend of a deflected flap, such a combination would be comparatively efficient. – Disregarding dynamic pressure, and when blowing into ambient pressure, the equivalent drag coefficient for a boundary-layer control system at or near the leading edge, would be in the order of
ACd = CQ Cp = 0.001 (20 to 60) ^ 0.04 (24)
where the numerical values are those of the 0006 section discussed above. Taking into account an internal efficiency of 50% (in ducts, blower, engine transmission) we may have a &CD = 0.08. This would be as much as the drag of an average airplane at CL ~ 1.1, or 50% of that at CL ^ 1.6.
Takeoff. Theoretically, all the engine power of an airplane would be available for bo’undary-layer control purposes, when landing. Takeoff might be equally important, however, and the estimate above implies that drag and engine power required during takeoff, would possibly by 50% increased when using leading-edge suction. One must also consider cost, weight and complexity of the system. After discussing and referencing these drawbacks, Wagner (21,e) therefore comes to the conclusion that suction in chord – wise or spanwise combination with blowing (.also using new principles of pumping and powering) would be a more acceptable proposition.


