LIFT ABOVE THE CRITICAL MACH NUMBER
Deliberately, or in emergency situations, airplanes designed for subcritical conditions may be flown at, and get into, speeds appreciably higher than the “‘critical”. Characteristics of straight wings up to M = 1 are therefore, presented as follows.
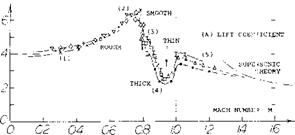
Shock Stall Considering again the expanding flow in a Laval nozzle, that flow breaks down when the geometric expansion is too long or too steep. In the case of an airfoil at some angle of attack, this means that the boundary layer separates from the trailing edge and recompression takes place across a stronger shock (phase 3). When all of this happens suddenly, the drop in the lift coefficient is equally sudden. Such a drop is seen in figure 16(A) at M =
0. 8. As reported in (6,g) shock and separation may also fluctuate back and forth; in other words, the flow pattern is not stable. In region (3), there is a discontinuity recognized in the variation of the longitudinal moment (to be discussed later).
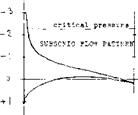
 Flow Around the Leading Edge. As pointed out, particularly in the first section of this chapter, upon exceeding the “critical” Mach number, forces and moments usually do not break down at once. In fact, in lifting symmetrical sections a strongly negative pressure gradient developing around the leading edge favors the boundary layer flow, leading it around the edge. To understand the flow pattern and the development of forces and moments, a selected number of chordwise pressure distributions is presented in figure 15. In what is called phase (1), the pressure distribution is essentially as in incompressible fluid flow, with a pressure peak and a continuous increase of the upperside pressure toward a slightly positive value at the trailing edge.
Supersonic Expansion. In figure 15, horizontal lines indicate the critical pressure level, as calculated using equation
7. It is evident that in phase (2) speeds are present appreciably above the local velocity of sound. An expansion takes place around the leading edge, similar to the Prandtl-Meyer type as in supersonic flow (l, a) extending to almost 50% of the chord. The average pressure coefficient is Cp = —1.3, in the example shown. It is this negative pressure obtained by expansion, rather than the Prandtl-Glauert mechanism, which produces the peak of the lift coefficient in figure 16. Recompression from Cp = — 1.3, first to —0.3, takes place through a mild shock. It must be noted that a further subsonic recompression develops in much the same manner as at lower Mach numbers, ending in a positive Cp = 0.3, at the trailing edge. As shown in Chapter XV of “Fluid-Dynamic Drag”, divergence of the drag coefficient may be delayed over an interval of AM = +0.1 or 0.2. While such delays may at first be harmless, less desirable changes take place in the phases described next. [61] [62] [63] [64]
|
Figure 14. Pitching moment due to deflection of a control flap, tested (14,b) on the half-span model of a wing having an aspect ratio of 4.5. |
(11) Minimum pressure peaks on airfoil-section noses (theory):
a) Kochanowsky, Pressure Distributions, Yearbk D Lufo 1940 p 1-72.
b) Weber, Suction Peak on Sheared Wings, RAF, TN Aero – 2587 (1958).
(12) Small aspect ratio wings as a function of M’number:
a) Nelson, 65-210 Wings With A = 1 to 6, NACA RM A1949K18.
b) Allen, In Combination With Bodies, NACA RM A1953C19.
c) See references (9,a, e) with A’ratios of 0.5 to 6.
d) Smith, Delta Wing With Body, NACA RM 1950K20 & K21.
e) Squire, Ogee Wing With Body, RAE ARC C’Paper 585 (1959).
![]()
![]()
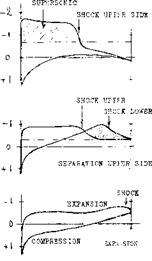 Minimum Lift. While on the upper side circulation is lost as a consequence of separation, a flow pattern similar to that on the upper side as in phase (2) develops along the lower side. An expansion takes place from the stagnation “point” toward the trailing edge. Negative pressure and negative lift grow considerably, thus reducing the resultant lift coefficient. The coefficient drops to less than half its peak value in this phase (4). In thicker sections (with well rounded lower side, not included in figure 16) the negative lift component can be such that the resultant lift is zero, at the constant angle of attack shown.
PHASE (1) "SUBSONIC"
64АОЮ (16,e) M = o.5
CL = 0.63
PHASE (2) LIFT PEAK
64A010 (16,e)
M = 0.75 CL = o.77
PHASE (5) "SUPERSONIC" 16-009 M =1.0 CL = 0.6
“Supersonic" Pattern (phase 5). As the Mach number is further increased, the shock at the upper side moves rapidly toward the trailing edge. The lift-reducing “loop” as in phase (4) of figure 15 disappears; and the lift recovers to some extent. At and above M = 1, a supersonic type of pressure distribution is obtained. As shown in figure 16, the lift coefficient approaches from there on, the function as indicated by supersonic theory. Expansion (on the upper side) and compression (on the lower side) also mean a considerable increase of the drag.
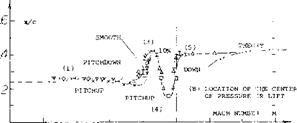
Center of Lift. The pitching moment can be presented in the form of the location x = distance from the leading edge of the center of lift (or normal force):
x/c = 0.25 — (С т/ц /CL ) (21)
Within the completely subsonic phase, nothing happens to the moment, excepting the increase of Cmo due to camber as stated in the second section of this chapter. Within the still “subsonic” phase (1) part (B) of figure 16 indicates a modest pitchup tendency. At a Mach number somewhat below that where the lift coefficient reaches its peak, the center of lift has moved forward from x/c = 26% to some 23%.
Pitching Down. In phase (2) as in figure 15, the center of lift is evidently farther back than in (1). Figure 16(B) shows that this movement continues into phase (3) where the center is at x/c = 40%. The corresponding nose-down pitching moment could lead an airplane into a dive from where recovery is no longer possible.
Pitchup. The negative lift developing at the lower side, as in phase (4) of figure 15, evidently causes the far-forward locations, as indicated in figure 16(B), around M = 0.95. In an airplane with a straight wing, this change may mean not only pitching up, but also a dangerous loss of longitudinal stability (stalling). It is particularly in thicker sections (such as 0015, which is not shown in the graph) that negative pressures near the trailing edge of the lower side cause and/or aggravate the pitchup.
Q3) Lifting characteristics of slender bodies:
a) Taylor, Parabolic Blunt-Base Bodies, NASA TN D-14 (1959).
b) Stivers, Various Elliptical Cones, NASA TN D-1149 (1961). [65]
(16) Airfoil characteristics at transonic Mach numbers:
a) Ladson, Several 64-Series Airfoils, NACA RM L1957F05.
b) Spreiter, Transonic Similarity Laws, NACA TN 2273 (1951).
c) Ladson, 16-Series Pressure Distributions, NASA Memo 6-1-1959L.
d) Crane, Wings With Aspect Ratio of 8, NACA RM L195 lD24a.
e) Stivers, Pressure & Forces 64A Series, NACA TN 3162 (1954).
Approaching M – 1, the flow pattern assumes a. character similar to that at supersonic speeds. That is, expansion and attached flow are restored at the upper side, in this phase (5). As seen in figure 16(B), the center of pressure moves to the rear, ending up in a stable position slightly aft of x/c = 40%.
|
V |
64-008 |
(6, c ) |
и 64-010 |
(6,h) |
|
4- |
64-010 |
(6, c ) |
I 65-010 |
(16,d) |
|
0 64-012 |
(6,c) |
Q 64A009 |
(6,d) |
|
|
X |
0 0 09 |
(6,e) |
Д 65A009 |
(16,a) |
|
0 |
0 0 12 |
(6,e) |
• 0 0 12 |
(16,a) |
|
64A010 |
(5, d) |
– 63A010 |
(9, c) |
|
63A009 AIRFOIL SECTION |
|
|
|
C Q2 04 06 08 Ю!2 14 16
Figure 16. Lift and center of pressure of various symmetrical foil sections from subsonic through transonic M’numbers, at constant angle of attack o( =4°. |
Transonic Flight. The graphs in figure 16 were prepared for ol = constant := 4 .In actual flight, the lift (in lb or newtons) would remain constant, when advancing in steady horizontal flight toward the sonic speed. The lift coefficient would thus vary roughly as C L ^ 1/M2. Qualitatively, however, the changes of lift and pitching moment would remain as described, including the up-down-up variations as in figure 16. These variations are undesirable and dangerous. The conclusion might thus be that conventional “subsonic” wing sections are not suitable at all to be used at transonic speeds. It is possible, however, to reduce the up-down-up variations through the use of
wings with small aspect ratios,
wing sweep in combination with area rule applied to the fuselage,
airfoil shape (thickness ratio, nose radius, trailing edge angle).
It is shown in (9,f) for example, how in small aspect ratios, the lift drop may reduce to nothing, as the thickness ratio is reduced from 12 to 4%. It is also shown, for example in (9,c, e)> how a wing with A = 4 and t/c = 6%, gets comparatively smoothly through the sonic speed range. There is one change, however, which cannot be avoided in ordinary wings; that is the transfer of the center of pressure or lift, from x/c ~ 25%, at least to some 40% as at supersonic speeds. The planform most perfect in this respect (theoretically not exhibiting any difference at all) is the delta shape; see Chapter XVIII.
(18) Aereas of supersonic flow are investigated or stated:
a)  In Chapter XV of “Fluid-Dynamic Drag”.
b) By Goethert as in Reference (6,g).
c) von Karman, Transonic Similarity Law, J. Math Phys 1947
p 182.
d) The maximum local Mach number obtained, before the flow over the upper side breaks down (separates), is stated (b) to be in the order of 1.4 or 1.5.


