Numerical Results
For the validation of the implemented iterated defect correction method exhaustive studies have been made for 1D, 2D and 3D Euler and Navier-Stokes problems. All simulations have been carried out with a standard finite volume scheme using ghost cells to impose boundary conditions. Depending on the test case a first or a second order basic scheme was used, whereas for the defect correction a polynomial WENO reconstruction up to 6th order was applied with the standard choice for the reconstruction parameters shown in section 3. In this section we first show some of the convergence studies of those validation cases and we end up with application test cases.
1.1 Convergence Studies
To validate our proposed iterated defect correction method for inhomogeneous problems we took as a first example in 1D the nonlinear Euler equations where a source term s(u, A), depending on the solution u and a given geometry A, was added. The equations in (29) are derived from the homogeneous Euler equations in three dimensions with the assumption of a continuous area variation (see also [20]).
1 ( PuAx
u,+F(u).x- = s(u) with s = —— I p/rA. v (29)
u(e + p)AxJ
This gives an approximation of a 2D axi-symmetric nozzle flow with the x-axis as nozzle symmetry and A(x) as cross-sectional area along the nozzle. In our case we took a smooth sinus function
( 2, — 1 < x < — 2
A(x) = < 2 — sin4 (я(х+ ^)), — ^ < x < ^ (30)
1 2, 2 < x < 1
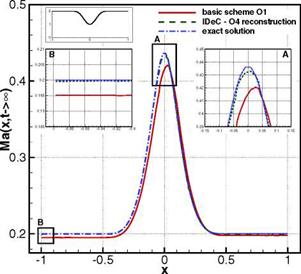
for the cross-sectional area which is illustrated in the upper left corner of Fig. 1. We took a subsonic expansion with inflow and outflow pressure p = 1 and an inflow velocity u = 0.2 with an inflow mass flow pu = 0.28. We obtain then an inflow Mach number of Ma = 0.2 which can be introduced into the 1D nozzle theory to evaluate the exact state at the inflow and outflow section. This is imposed during the simulations which result into a symmetrical distribution of the state variables (see Fig. 1). We can clearly see the difference between the first order basic method and the corrected solution in both amplitude and location of the peak which is expected to be in the nozzle throat at x = 0. In this case a cubic polynomial reconstruction was chosen to compute the local defect.
To measure the exact error between the approximated solution uh and the exact solution ue we use continuous Lp norms
|
Fig. 1 Mach number distribution of a axi-symmetric nozzle flow simulated with a first order basic method and corrected by a fourth order polynomial reconstruction for the local defect |
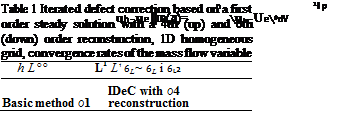
whereas the L“-norm gives the maximum absolute error arising in the whole domain. We compute the integral with the Gaussian quadrature algorithm with twice the number of Gauss points compared to the numerical scheme. For the defect correction it is important to make this analysis with the high order polynomials and, respectively, with the high order integration and not with the accuracy of the basic method. Table 1 shows the convergence tables of the nozzle test case for five successively refined grids. In addition to the fourth order defect reconstruction we show a convergence table for a first order basic method corrected with a 6th order reconstruction to determine the local defect.
The validation of the 2D and 3D implementation has been carried out by using the method of manufactured solutions, i. e. we insert an analytical function
pe(x) = sin(nx) ■ sin(ny) + 2
for the exact density distribution in 2D and respectively
pe(x) = sin(nx) ■ sin(ny) ■ sin(nz) + 1
in 3D into the Euler equations and solve the inhomogeneous two-, respectively three-dimensional Euler equations
 |
U + V ■ F(u)= s(x). (32)
|
0.080 7.69E-03 2.17E-03 2.64E-03 |
– |
– |
– |
|
0.040 6.34E-04 1.26E-04 1.78E-04 |
3.6 |
4.1 |
3.9 |
|
0.020 3.46E-05 6.08E-05 9.69E-05 |
4.2 |
4.4 |
4.2 |
|
0.010 2.14E-06 3.19E-06 5.63E-06 |
4.0 |
4.3 |
4.1 |
|
0.005 1.35E-07 1.83E-07 3.44E-07 |
4.0 |
4.1 |
4.0 |
|
Basic method 61 —t IDeC with 66 |
reconstruction |
||
|
0.100 8.80E-03 2.22E-03 2.49E-03 |
– |
– |
– |
|
0.067 1.92E-03 2.95E-04 4.19E-04 |
3.8 |
5.0 |
4.4 |
|
0.033 6.66E-05 8.94E-06 1.54E-05 |
4.9 |
5.0 |
4.8 |
|
0.017 1.54E-06 1.80E-07 3.28E-07 |
5.4 |
5.6 |
5.6 |
|
0.008 2.63E-08 3.02E-09 5.58E-09 |
5.9 |
5.9 |
5.9 |
The remaining state variables like the velocity and the pressure were set to a constant value greater zero. For our choice we obtain source terms which in contrast to the one dimensional analysis depend only on the space
Si = n ■ sin(nx) ■ cos(ny) + n – cos(nx) ■ sin(ny) for i = 1…4 (33)
in two dimensions and respectively
si = п■ sin(nx) ■ sin(ny) ■ cos(nz) + п ■ sin(nx) ■ cos(ny) ■ sin(nz)
+ п ■ cos(nx) ■ sin(ny) ■ sin(nz) for i = 1…4
3п 3п
Ss = — • sin(jtx) ■ sin(jty) ■ cos(jtz) + — ■ sin(jtx) ■ cos(jty) ■ sin(jtz)
3п
+ — ■ cos(jtx) ■ sin(jty) ■ sin(jtz) (34)
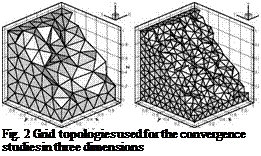
in three dimensions. For the simulations we initialized the domain Q2D = [0; 1]x[0; 1] in 2D and respectively Q3D = [0; 1]3 in 3D with the exact solution and iterated the basic scheme to a steady state with the exact solution imposed on the boundaries. The same convergence study as in one dimension based on the L^-norms was carried out on four successively adapted grids. In all our computations we used fully unstructured grids with irregular triangles in two dimensions and tetrahedrons in three dimensions. Each adaptation is performed globally, i. e. we applied the so – called red-refinement in each cell of the domain per adaptation step. An example of two adaptation steps is shown for the three dimensional case in Fig. 2.
 |
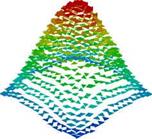
Again we can see the difference between the solution of the basic method and the corrected one. This is demonstrated for the two dimensional case for the density distribution in Fig. 3. We have to mention that for the visualization of the higher order solutions we subdivide the numerical grid and write out the value of the polynomial distribution at each barycenter center of the subdivided grid. In this way we can see the Godunov approach of constant values in the cell for the first order solution (Fig. 3, left) and the continuous fourth order solution with vanishing jumps between the cells (Fig. 3, right). A quantitative analysis can be done by determining the convergence rates for the corrected solutions as it was done in the one dimensional case. In Tab. 2 we show the experimental convergence order for the two – and
Z
![]()
![]() —
—
X Y
p: 1.9 2.1 2.3 2.5 2.7 2.9
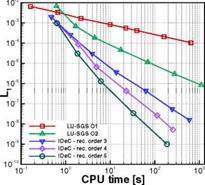
Fig. 3 Solution of the first order basic scheme (left) and the corrected solution of an IDeC with a 4th order polynomial reconstruction for the local defect (right) three dimensional simulations where we used a first order basic scheme with a cubic polynomial reconstruction for the defect correction. In both cases we reach the optimal theoretical convergence order of M + 1 when iterated defect correctionis applied. The convergence rates can approve that with the mesh step size h ^ 0 the error tends towards zero with the potential power of M + 1, M being the polynomial degree of the reconstruction basis polynomials W (see chapter 3). However, nothing can be said about the real simulation time needed by the employed numerical scheme and with it the real gain of using a higher order reconstruction. Therefore we show in Fig. 4 the L1-norm of the errors for the one and two dimensional computations described above over the total CPU-time in seconds needed
Table 2 Density convergence rates for IDeC with a first order basic scheme and a cubic polynomial reconstruction on 2D (up) and 3D (down) irregular unstructured grids)
h U° Iі Lr 6L~ 6Li ^7
2D Basic scheme O1 ^ IDeC with O4 reconstruction 0.191 7.55E-02 1.06E-02 1.45E-02 – – –
0.096 5.78E-03 4.68E-04 7.12E-04 3.7 4.5 4.4
0.048 7.07E-04 2.95E-05 4.91E-05 3.0 4.0 3.9
0.024 4.97E-05 1.69E-06 3.17E-06 3.8 4.1 3.9
3D Basic scheme &Л —t IDeC with 6‘4 reconstruction 0.182 5.67E-02 9.49E-03 1.22E-02 – – –
0.127 9.69E-03 1.87E-03 2.39E-03 5.0 4.6 4.6
0.068 8.71E-04 1.01E-04 1.32E-04 3.8 4.6 4.6
0.035 8.38E-05 7.09E-06 9.54E-06 3.6 4.1 4.0
 |
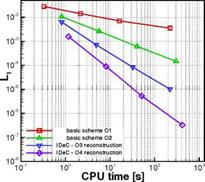 |
Fig. 4 Convergence rates over total CPU time for first and second order methods compared to iterated defect correction with higher order reconstruction in 1D (left) and 2D (right)
for a converged iterated defect correction and the basic schemes of first and second order. The simulations were all performed on one single AMD Athlon 5200+ processor with 3GB of RAM. So we can compare directly the computational effort to reach the same given accuracy of the L1-norm. To give an example, if we want to reach an error norm of L1 = 10-4 in the one dimensional case (Fig.4, left), we obtain a speed up of factor 4 comparing a second order scheme with a third order corrected solution based on a first order basic scheme. The same comparison for the two dimensional case leads even to a speed up of factor 20 which is due to higher computational cost for the 2D simulations concerning for example the integration (Fig.4, right). This results for the speed up are surely dependent on the test case, nevertheless they give an idea of the potential of higher order schemes. However, in the one dimensional test case we can see, that the speed up of a higher order scheme starts to be significant for very low accuracy levels.
A more demanding test case for the stability and the convergence of the iterated defect correction for the steady nonlinear Euler equations is the Ringleb’s flow [2]. It is one of the few continuous transonic flows of a blunt obstacle which can be solved analytically with the Hodograph method in a transformed (V – 9) plane, with V as the velocity magnitude and 9 the angle of the velocity with respect to x-axis. More details on the Hodograph method and the analytical solution can be found in [2]. In our case the flow direction is upwards with the wall boundaries left and right. Their topology is derived from the analytical solution where the chosen boundaries of our test case represent two stream lines. The inflow and outflow boundaries are circles also given by the exact solution. The chosen geometry leans on th article [21].
In spite of being a transonic flow, it is smooth in the whole domain and since we can compute an exact solution at each grid point there is also a quantitative analysis possible. In addition the flow is supposed to be irrotational and isentropic. We performed the simulations on three successively adapted regular triangular grids imposing the exact solution on every boundary. Starting from the exact solution as
 |
 |
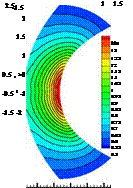 |
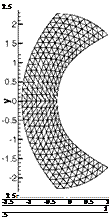
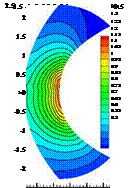
Fig. 5 One of the used triangular grids, steady solution of the first order basic method (middle) and defect correction solution with 4th order reconstruction (right)
the initial condition we use a first order scheme as the basic method for the iteration to a steady solution. In Fig. 5 the middle fine grid is depicted together with the steady solution of the basic method and the solution corrected with IDeC. We expect a complete symmetrical solution with a defined circular sonic line. The first order basic method clearly failures in these flow topologies. There are small instabilities, nevertheless the method is stable and converges perfectly, which is important for the method of iterated defect correction. For the defect correction we applied a 4th order accurate WENO reconstruction with the parameters ne = 2L, r = 6, є = 10“14 and Xc = 105.
With the IDeC we get a good solution which is near to the exact one in spite of the unsymmetrical solution of the basic method. With this setup we reach the theoretical convergence order of the reconstruction, proving the possibilities of the iterated defect correction method. If we compare the absolute error Lp-norms (Tab. 3) of both solutions this means a correction of the basic scheme from one up to four orders of magnitude for the finest grid.
Beside the nonlinear Euler equations we applied the method of iterated defect correction on the Navier-Stokes equations as well. Similar to the convergence studies shown before, we used the method of manufactured solution and solved
ut + V • F(u, Vu) = s(x) (35)
with F(u, Vu) =Fc(u) — Fd (u, Vu), where Fc and Fd denote the convective respectively the diffusive flux. The defect correction formulation in (11) does not change in the case of solving the Navier-Stokes equation, but is just extended by the diffusive flux what results in
|
N |
L°° |
z7 |
Lr |
6l~ |
6Li |
6L2 |
|
Basic method 6‘ 1 |
||||||
|
32 |
5.55E-02 |
5.89E-02 |
3.68E-02 |
– |
– |
– |
|
64 |
3.56E-02 |
3.14E-02 |
2.01E-02 |
0.9 |
0.9 |
0.6 |
|
128 |
2.20E-02 |
1.64E-02 |
E06E-02 |
0.9 |
0.9 |
0.7 |
|
Basic method |
61 —г IDeC with 64 reconstruction |
|||||
|
32 |
4.17E-03 |
9.55E-04 |
8.10E-04 |
– |
– |
– |
|
64 |
3.23E-04 |
4.10E-05 |
4.04E-05 |
3.7 |
4.5 |
4.3 |
|
128 |
1.90E-05 |
2.07E-06 |
2.04E-06 |
4.1 |
4.3 |
4.3 |
|
Table 3 Convergence rates for the first order basic method (up) and the corrected solution with 4th order reconstruction (down) |
with Qi still acting as a placeholder for uf «f+1] and wf]. Similar to the Euler equations the local defect is now computed for both fluxes, the convective and the diffusive flux. A high order formulation for the diffusive flux is therefore necessary. We have chosen the approximation suggested by Gassner et al. in [8]. It enables a one-step numerical method of high order accuracy in space and time using the same data as for the convection flux. Based on the idea of Godunov for advection problems not with constant initial data but with a linear initial distribution, it results in the so-called diffusive generalized Riemann problem (dGRP). Solving this Riemann problem yields two parts, the one containing the arithmetic mean value of the first derivative, whereas the second contains a physically motivated limiting term composed of the jump in the state of two adjacent cells. In 2D and 3D this leads to
a numerical approximation for the diffusion flux, d/dn denoting the derivative in normal direction. The characteristic length h is taken as twice the distance from the barycenter of the cell Ci to the barycenter of the edge K of the computed flux. The integration is again done by Gaussian quadrature with o)K the weights on the edge K using a total number nGP of integration points. The jump in the state of two neighboring cells is multiplied by the parameter n
П = —)= (39)
hJ n
which can also be interpreted as a penalty term for the jump. With the chosen WENO reconstruction we obtain the derivative directly from the reconstructed polynomial distribution. However, the theoretical convergence order for this flux is limited to M, the degree of the reconstruction polynomials, in the case of a finite volume method. This is due to the fact that we use the first derivation of our polynomials losing hence one order of accuracy (see also [8]).
As an exact solution for the iterated defect correction applied on the Navier – Stokes equations simulated in two dimensions we took
![]()
![]() sin(nx)sin(ny) + 4 sin(nx)sin(ny) + 4 sin(nx)sin(ny) + 4 (sin(nx)sin(ny) + 4)2
sin(nx)sin(ny) + 4 sin(nx)sin(ny) + 4 sin(nx)sin(ny) + 4 (sin(nx)sin(ny) + 4)2
with u = (p, pu, pv, pe)T denoting the vector of the conservative state. By inserting (40) into (35) we can again compute the source term s, which is only a function of the space x. To test the method of iterated defect correction for rather viscous flows we chose a viscosity д = 10~ which results in a very low Reynolds number of Re = 80. As the temperatures are very low and do not take effect on the viscosity, we performed these computations with the assumption of a constant д. The simulations were all carried out on a fully periodic domain Q = [0;2]x[0;2] with periodic boundaries on successively adapted regular triangular grids.
As we use the derivative of the polynomial distribution for the flux approximation we have to take a basis scheme with at least second order of accuracy for the defect correction. In Tab. 4 we show the convergence rates of the test case above computed with a second order basis method and corrected by a local defect using a 4th order reconstruction. Motivated by several assumptions found in the literature on the numerical error which is supposed to be dominated by the convection part we could think of dividing the local defect into an convective and a diffusive part. As both can be computed independent from another we performed the same simulation
Table 4 Convergence rates computed for the pressure for a second order basic method and a defect correction with 4th order reconstruction
h LT L1 Zr 6’if 6Li 6L2
Basic method O2 ^ IDeC with O4 reconstruction 0.200 2.05E-01 1.95E-01 1.23E-01 – – ~
0.100 1.40E-02 1.36E-02 8.63E-03 3.9 3.8 3.8 0.050 8.87E-04 8.84E-04 5.54E-04 4.0 3.9 4.0 0.025 5.81E-05 5.49E-05 3.46E-05 3.9 4.0 4.0
Table 5 Convergence rates for the second order basic method (up) and the corrected solution with 4th order reconstruction (down) and a local defect computed only from the convection flux
h U° Z1 Lr б if 6Li 6L 2
Basic method 62
0.200 6.69E-01 6.27E-01 3.99E-01 – – ~
0.100 1.78E-01 9.66E-02 1.51E-01 1.9 2.0 2.0 0.050 4.66E-02 3.85E-02 2.44E-02 1.9 2.0 2.0 0.250 1.42E-02 1.04E-02 6.50E-03 1.9 1.9 1.9
Basic method O2 ^ IDeC with O4 reconstruction 0.200 2.01E-01 1.94E-01 1.22E-01 – – ~
0.100 2.15E-02 2.33E-02 1.41E-02 3.2 3.1 3.1 0.050 7.08E-03 8.00E-03 4.77E-03 1.6 1.5 1.6 0.250 2.91E-03 3.70E-03 2.18E-03 1.3 1.1 1.1
as before, with a local defect defined only in the convection flux setting the local defect of the diffusion to zero.
From the convergence rates in Tab. 5 one can see that for low Reynolds numbers,
i. e. for flows dominated by the viscosity, it is indispensable to compute the local defect also for the diffusive fluxes to reach the optimal order of convergence. However, the absolute error norms of the corrected solution are lower than the ones of the basic method computed with second order accuracy. That means, by taking into account only the local defect of the convective flux we can not reach the full optimal convergence order but we obtain a slightly better solution than that computed with the basic method.


