Defect Integrals and Thicknesses
As a first step, it’s useful to identify important overall properties of the boundary layer at any streamwise location s. As in Chapter 3, u, v will denote the s, n axis velocity components, which for a turbulent boundary layer represent the mean flow (e. g. time-averaged flow). The Equivalent Inviscid Flow (EIF) concept, first introduced in Section 3.1, will also be invoked here. Here we will assume that the EIF exactly matches the actual flow outside the boundary layer, and that it’s constant through the boundary layer thickness, so that
ui(s, n) = ue(s) , pi{s, n) = pe{s) (4.1)
at every streamwise station s. The assumption is equivalent to assuming that the boundary layer is very thin compared to the streamwise radius of curvature. This curvature is accounted for in higher-order boundary layer theory, as for example by Lock and Williams [9]. It will not be addressed here.
4.2.1 Mass flow comparison
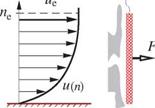
Figure 4.2 shows the mass flow per unit span passing through the streamtube of height ne, for the real flow and the corresponding EIF. These mass flows might be needed for a control-volume analysis for example.
|
Defect 8*———- A m |
 |
|||
The EIF mass flow is greater than the actual mass flow, the difference being the mass defect m. This is seen to be the fictitious mass flow between the real and displacement bodies locally spaced a distance An = 5* apart. This result is closely related to the viscous displacement models shown in Figure 3.3. Those were also based on mass conservation, and hence also depended on the m(s) and 5*(s) of the boundary layer.
Figure 4.2: Comparison of actual and EIF mass flows.
4.2.2 Momentum and kinetic energy flow comparisons
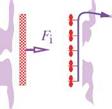
Momentum flow is carried by mass flow, and was already treated in the momentum control volume flow analysis in Section 1.3. Here it will be viewed as the force which acts on a hypothetical barrier which captures the mass flow and brings the fluid’s velocity to zero. Similarly, the kinetic energy flow carried by a mass flow will be viewed as the power obtained from an ideal turbine array which brings the fluid to rest
momentum kinetic energy extractor extractor (barrier) (turbine array)

![]()
![]()

![]()
![]()
 r
r
I
Figure 4.3: Comparison of actual and EIF’s momentum flow and kinetic energy flow, for the same mass flow. Momentum flow is equal to the force on a hypothetical barrier which brings the fluid stream’s s-velocity to zero. Kinetic energy flow is equal to the power from an ideal turbine array which brings the fluid stream’s velocity to zero reversibly.
reversibly. Figure 4.3 compares the barriers and turbine arrays between the actual flow and the EIF. The comparison is done at the same mass flow for all cases, which requires the EIF’s barrier and turbine array to be shorter by the displacement thickness height 5*.
The force and power are obtained by integrating the momentum and kinetic energy fluxes across the profile. The EIF flow case in Figure 4.3 on the right gives the following.
From the final results (4.7) and (4.8) we see that the actual flow has momentum and kinetic energy flows which are less than the EIF’s values by the corresponding defects P and K.
The momentum defect P has also appeared in the airfoil far-field profile drag analysis in Appendix C. The kinetic energy defect K will be seen to be related to the viscous dissipation in the boundary layer, and to the profile drag as well. The associated thicknesses 9 and 9* will also appear in the formulation of integral boundary layer calculation methods considered later in this chapter.


