Propeller Charts and Empirical Methods
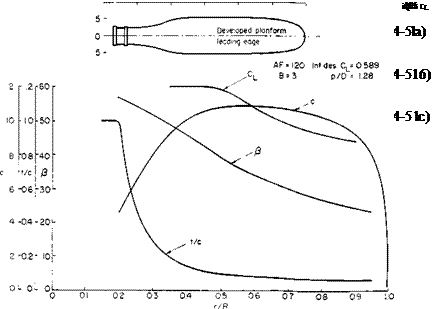
A large majority of propeller analyses, designs, and selections are based on empiricism. Propeller designs are identified by their geometry: in particular, by the number of blades, integrated design lift coefficient, blade activity factor, and pitch-diameter ratio.
The integrated design lift coefficient is obtained from
and represents the average of the design section C,’s weighted by the radius squared.
The blade activity factor is defined by
 (4-48)
The blade activity factor is simply another measure of the solidity. In a constant chord blade the solidity and activity factor are related by
128B(AF)
100,000л
|
|
Aircraft propellers have activity factors of approximately 100 to 150. It is often stated that the activity factor is a measure of a blade’s capacity to absorb power.
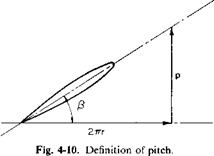
The pitch of a propeller blade is the distance it would advance in one revolution if there were no slip. Hence in Fig. 4-10 the pitch p is given by
p = 2nr tan /?.
For a constant pitch propeller the section pitch angles are calculated from
ft = tan -1 (4-49)
roc
where p/D is the pitch-diameter ratio.
|
|
Standardized propeller data, that is, thrust and power coefficients and efficiency, are usually presented as a function of the propeller advance ratio J defined by
Thrust, power, and torque coefficients for propellers are usually defined in terms of the product nD (for a characteristic velocity) and D2 (for reference
area).
 |
Hence
Because the symbols CT, CQ, and C,. throughout the literature define the thrust, torque, and power coefficients in different ways, we must be careful in the use of any graphs that present these quantities.
In terms of CT, CP, and J, the efficiency is
![]() JCT
JCT
Cp
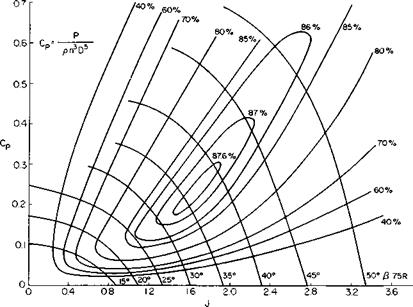
One method of presenting propeller data is given in Fig. 4-11, reproduced from Ref. 7. This is a map of CP versus J with contours of constant t] and P drawn. The values of P are for the 0.75R station. The geometry of this particular propeller is given in Fig. 4-12. A method for correcting data such as these to other propellers of similar geometry but different numbers of blades or activity factors is presented in Ref. 7.
In Fig. 4-11 it is seen that a propeller can be a very efficient device. For this particular propeller there is a large area of operating conditions for which the efficiency is better than 85%.


