Two-Dimensional Airfoil Behavior
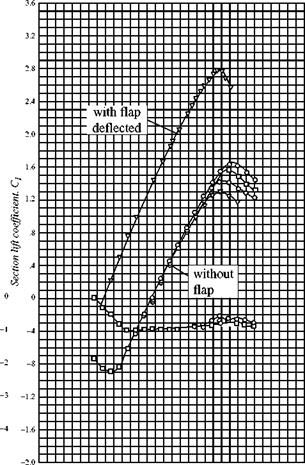
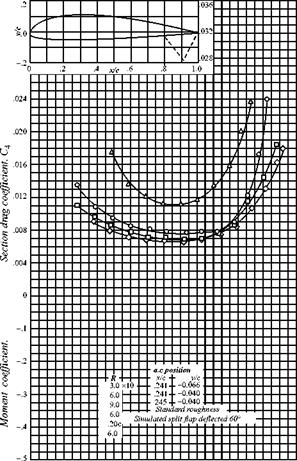
Figure 5.3 shows the behavior of a typical cambered, two-dimensional airfoil as a function of geometric angle of attack (i. e., the angle between the freestream and the chord line). The data presented in this figure, and other similar figures, are from experiments. The nomenclature that specifies the shape of the airfoil illustrated in this figure is defined later. In Fig. 5.3(a), notice that up to an angle of attack of about 10 degrees, the lift increases linearly with angle of attack. Above 10 degrees, the lift begins to drop off and, at about 16 degrees (depending on the Reynolds number), the loss in lift is catastrophic; that is, the airfoil stalls. The upper lift curve shows the
|
|
|
|
|
|
|
|

effect of a deflected flap. The lift curve does not maintain a constant slope because viscous effects begin to dominate. As the angle of attack increases, the adverse pressure gradient over the aft-upper surface of the airfoil becomes larger and the boundary-layer separation point begins to move upstream from near the trailing edge. As a result, a loss in lift occurs over the rear portion of the airfoil. Suddenly, the separation point jumps to near the leading edge, the aerodynamic shape as “seen” by the flow changes dramatically, and the airfoil stalls. The maximum lift coefficient, Qmax, is obtained immediately before the stall. Notice how Q max for the airfoil depends on the Reynolds number (Re), which indicates that the airfoil boundary – layer behavior is varying with the Reynolds number. Of course, the inviscid theory considered here predicts neither stall nor Q max; rather, it predicts the lift curve slope for moderate angles of attack.
Figure 5.3(a) shows that at zero lift, the angle of attack for this airfoil is negative because the airfoil has positive camber. The negative angle of attack required for zero lift is called the angle of zero lift. If the airfoil is symmetric, the angle of zero lift is zero.
The pitching-moment coefficient also is shown in Fig. 5.3(a). Here, it is taken about the aerodynamic center, which is that point on the airfoil about which the pitching moment is independent of angle of attack. Do not confuse this with the center of pressure, which is the point about which the total moment is zero. The location of the aerodynamic center and the moment about the aerodynamic center can be found from testing and also predicted from inviscid theory (for moderate angles of attack). Because the pitching moment is defined as positive clockwise (i. e., nose up), the negative pitching-moment coefficient shown in Fig. 5.3(a) implies a nose-down (i. e., counterclockwise) sense and, hence, a restoring (i. e., stable) moment.
Fig. 5.3(b) shows experimental data expressing the drag behavior of the same airfoil. This curve, called the drag polar, presents drag coefficient versus lift coefficient rather than drag coefficient versus angle of attack. The drag in these two-dimensional tests is called the profile drag. This is the part of the drag due to the action of viscosity. It is the sum of two drag contributions—namely, skin-friction drag and pressure drag due to flow separation. Notice how the drag increases dramatically as boundary-layer separation begins to dominate the flow field. Airfoil drag is predicted to be zero for two-dimensional inviscid flow. The subject of drag appears in many places in the text because it originates in several ways. Detailed discussions are in Chapter 9, in which the subject of compressible wave drag is set forth.
5.2 The Joukowski Airfoil
To illustrate what can be accomplished with an analytical technique, we consider representing an airfoil as a mapping of a known flow solution. In particular, we consider the circular cylinder with a superposed vortex flow studied in Chapter 4. This model was used to demonstrate the connection between lift and the creation of circulation. If we could distort the coordinates correctly, perhaps we could use this known solution to understand the flow around actual airfoils.


