Measurements of Chordwise Pressure
Representative measurements of chordwise pressure distributions about an airfoil at various angles of attack below stall in a subsonic flow are shown in Fig. 7.12. Although there is a stagnation region over the lower leading edge region where Cp is positive, over most of the airfoil Cp is negative. Note that as the AoA is increased from zero, the pressure reduction on the upper surface increases both in intensity and extent. The high adverse pressure gradients downstream of the leading edge make the boundary layer thicker, and ultimately when the adverse pressure gradients become too large, the boundary layer will separate from the surface causing stall.
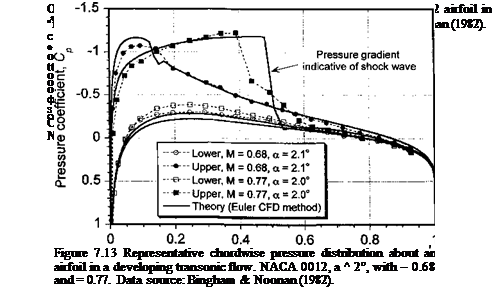
With the formation of regions of supercritical (locally supersonic) flow, such as found toward the tip of a rotor blade, the airfoil pressure distribution changes considerably. Measurements of the pressure distribution about an airfoil in a developing transonic flow are
 |
plotted in Fig. 7.13 for a condition where the flow is just supercritical (M^ = 0.68) and also for a supercritical condition (M^ = 0.77). The large adverse pressure gradients found near the leading edge in the subsonic case now move further aft to near the mid-chord of the airfoil, which is a result of the formation of a supersonic flow region and a shock wave. The adverse pressure gradients near the shock wave make the boundary layer on the surface – more susceptible to thickening and separation, resulting in higher drag. When the shock wave becomes stronger, flow separation will occur at the foot of the shock and the airfoil will ultimately stall if the AoA is increased any further.
Chord position, x/c
|
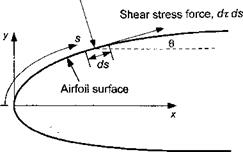
Pressure force, dp ds
Figure 7.14 Pressure and shear forces acting on an element of the airfoil surface. |


