ROBUST PERFORMANCE (P5)
![]() Transport aircraft – robust stability inside a truncated sector (P5) – the
Transport aircraft – robust stability inside a truncated sector (P5) – the
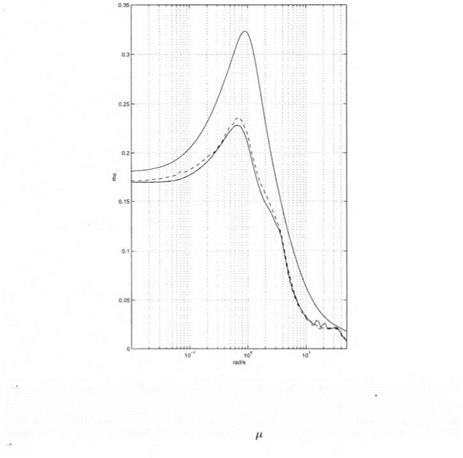
mixed /і upper bound by Fan et al is represented in solid line – the star represents the fi lower bound of section 3. of chapter 5.
Robust stability inside a truncated sector is now studied. The minimal degree of stability (resp. the minimal damping ratio) is chosen as 0.4
 (resp. 0.5). The nominal degree of stability (resp. the nominal damping ratio) is 0.7 (resp. 0.61). The results of Figure 6.8 are of the same type as those obtained in the previous subsection.
The maximal value of the mixed p upper bound is 0.648 at и = 0.79 rctd/s. The corresponding uncertainties in the stability derivatives are 10%/0.648 « 15%. The robust performance properties of the flight control system are thus quite satisfactory.
![]() Transport aircraft – robust stability (P4) – the mixed a upper bound
Transport aircraft – robust stability (P4) – the mixed a upper bound
by Fan et al is represented in dashed line (/i Analysis and Synthesis Toolbox) and solid line (LMI Control Toolbox) – the mixed fi upper bound by Safonov and Lee is
![]() represented in dash-dotted line – the complex
represented in dash-dotted line – the complex
line.
The star on Figure 6.8 represents the ^ lower bound of section 3. of chapter 5. When computing this p lower bound as a function of frequency, two different peaks are obtained: the first one is 0.579 at u> = 0 (the corresponding value of the p upper bound is 0.58 at w = 0), while the second one is 0.564 at u> = 0.76 rad/s. The lower bound of
the maximal s. s.v. over the frequency range is thus obtained as 0.579 at o> = 0, while the upper bound is obtained as 0.648 at ш = 0.79 rad/s. The gap between the bounds of the maximal s. s.v. over the frequency range is thus about 10.6 %, which is quite reasonable.


