The Change of the Unit Reynolds Number across Shock Waves
We have seen that the shock angle в of a bow-shock surface decreases from 90° at its normal shock portion asymptotically to the Mach angle pTO, which corresponds to the free-stream Mach number MTO. At a two-dimensional supersonic compression ramp, which represents either a hypersonic inlet ramp, or is the approximation of a trim or control surface, we have—if we neglect viscous effects—shock angles, which for perfect gas are functions of the onset or free-stream Mach number Mi (= MTO), the ratio of specific heats 7, and the ramp angle S only. Eq. (6.114) connects these entities.
We consider a plane oblique shock surface at shock angles 90° > в > рж regardless of the geometry that is inducing it. We ask how the unit Reynolds number Reu is changing across the shock wave, Fig. 6.28. The unit Reynolds number governs the properties of a boundary layer. If it increases across the shock wave, behind it the thickness of the boundary layer, the displacement thickness and the other ones, are reduced, the heat flux in the gas at the wall, the radiation-cooling temperature and the skin friction are increased, see Section 7.2.
We observe in Fig. 6.28 first, that for в = 90° at all Mach numbers M1 > 1 the unit Reynolds number Reu behind the shock (2) is smaller than ahead of it (1):
в = 90° : Reu/Reu < 1. (6.142)
This is obvious, because p2u2 = p1u1, and T2 > T1, and hence the viscosity
p2 > p1.
If we now reduce with a given Mach number M1 the shock angle в, we find that the ratio Reu/Reu increases, and that a shock angle exists, below which Reu/Reu > 1. This holds for all Mach numbers and ratios of specific heat [35].
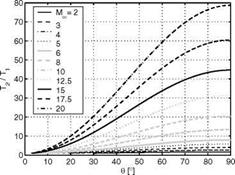
This behavior is due to the fact that u2/u1 increases with decreasing shock angle в, that the density ratio p2/p1 decreases first weakly and then strongly with decreasing в, Fig. 6.29, whereas the temperature ratio T/T decreases first weakly and for small в weakly again, Fig. 6.30.
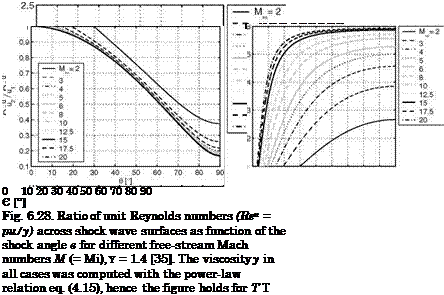 |
Fig. 6.29. Behavior of u2 /u1 (left) and of p2/p1 (right) as function of the shock angle в and the Mach number Мж (= M1), y = 1.4 [35]. Note that u2 /u1 = V2/V1 in Fig. 6.9.
The behavior of the ratio of the unit Reynolds numbers across shock surfaces is of interest insofar as the development of the boundary layer behind an oblique shock wave, induced for instance by an inlet ramp or a trim or control surface, to a large degree is governed by it [2].
This holds for attached boundary layers, but in principle also at the foot of the shock surface, where strong-interaction phenomena may occur. We understand now that an increase of, for instance, the radiation-adiabatic temperature of the body surface behind an oblique shock surface happens only, if the shock angle в is below a certain value, which causes an increase of the unit Reynolds number. Otherwise a decrease will be observed.
|
Fig. 6.30. Behavior of T2/T1 as function of the shock angle в and the Mach number Moo (= Ml), 7 = 1.4 [35]. |
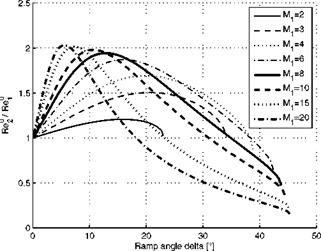
For application purposes it is useful to connect the changes of the unit Reynolds number directly with the ramp angle S. The result is shown in Fig. 6.31. It was made with the same assumptions as the previous figures.
|
Fig. 6.31. Ratio of the unit Reynolds numbers Ref/Ref across the shock wave of a flat-plate (1)/ramp (2) configuration as function of the ramp angle S for different flat-plate Mach numbers M1 and the ratio of the specific heats 7 =1.4 [36]. |
Look for instance at the curve with the Mach number Mi = 8. For 0° < S < 35° we have ReU 2 > ReU 1, with a maximum around S « 12°. This means that in this interval all boundary layer thicknesses on the ramp (2) will be smaller than those on the flat plate (1). For S > 35°, the opposite is true. For smaller Mach numbers Mi, smaller maximum ramp angles with weaker shock waves are reached, the Reynolds-number ratios and their maxima become smaller, too. Interesting is that for larger Mach numbers the ramp angles decrease, for which the unit Reynolds number ratios become < 1. Then also the maxima are more pronounced, lying around two. High-temperature real gas effects in general increase the maxima of the unit Reynolds number ratios and shift the ratios smaller than one to larger ramp angles [2].
The behavior of the ratio Re^/Re™ is of practical interest. Regarding an aerodynamic trim or control surface, we see that this ratio as function of the deflection angle 5 always has a maximum. The location of this maximum depends on the Mach number Mi. The result is that—for a given Mach number Mi—the surface pressure on the ramp increases with increasing 5, but the ratio ReU/Reu first increases and then decreases, hence thermal loads and skin-friction behave in the same way. They have their maximum at the angle where the ratio has its maximum. This means that thermal and friction loads have a maximum at a certain 5, but that a larger deflection angle not necessarily increases them.
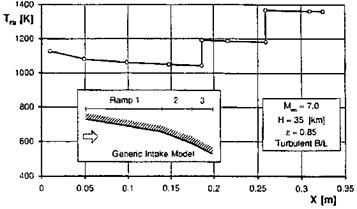
In reality the relevant ratio ReU/Re™ depends on the location on the flight vehicle. In particular we note that ReU is not ReU, but a local one. The behavior of the ratio explains also the always observed stepwise increase of the thermal loads—for instance the radiation-adiabatic temperature Tra—on ramp inlets.
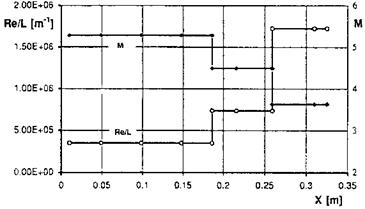
We illustrate this in Figs. 6.32 and 6.33 with results from a study with an approximate method of the flow past a generic three-ramp inlet [37]. The free – stream Mach-number is M^ = 7, the altitude H = 35 km, and the emissivity of the radiation-cooled ramp surfaces £ = 0.85. The flow is considered to be two-dimensional and fully turbulent.
|
Fig. 6.32. Generic two-dimensional inlet model with three outer ramps (for the ramp geometry see Fig. 6.33) [37]: Mach number (M) and unit Reynolds number (Re/L = Reu) on the ramps. |
|
Fig. 6.33. Generic two-dimensional inlet model with three outer ramps [37]: radiation-adiabatic temperature Tra on the ramps. |
We find in Fig. 6.32 a stepwise reduction of the Mach number, and a stepwise increase of the unit Reynolds number.[74] With the increase of the unit Reynolds number on each ramp the thickness of the boundary layer decreases. Therefore the radiation-adiabatic temperature on each ramp rises stepwise by almost 200 K to a higher level, Fig. 6.33, and then always decreases slightly with the boundary-layer growth, see Sub-Section 3.2.1, on each ramp.


