Case study 1. Moderate-resolution LES and DNS
We begin by performing a Large Eddy Simulation of a Mach 0.9, isothermal jet, with nominal Reynolds number, Re = 400000. The details of the computation can be found in Cavalieri et al. (2010a). An image of the flow solution is shown in figure 17, where the first stage in the analysis methodology is illustrated. We, of course, verify that the simulation shows good agreement with experimental results: at peak sound radiation frequencies
|
the LES is within 2dB of experimentally observed values.
Figure 17. First stage of analysis: obtain Navier Stokes solution, q, which contains the acoustic observable, q^. |
The next stage is to analyse the observable, q^. To do so we implement the following signal processing: azimuthal Fourier decomposition is performed on the acoustic data on a cylindrical surface of radius, r = 9D, and which extends from x/D = 0 to x/D = 20; wavelet transforms are applied in the time direction, for each azimuthal Fourier mode. The reasons for this choice of data-processing can be found in the previous section: we saw in the experiment that the sound field is dominated by only three azimuthal Fourier modes; this being the case, it is legitimate and useful to break the sound field down into these building blocks. This will allow us to simplify the analysis. Also, we saw that coherent structures in jets display intermittency, and in peak radiation directions much of the overall sound energy arrives in temporally localised bursts. This suggests a link between the intermittency of coherent structures and peak sound radiation, and the models developed in the previous section illustrate how such source behaviour can indeed enhance the sound radiation efficiency of organised flow structures.
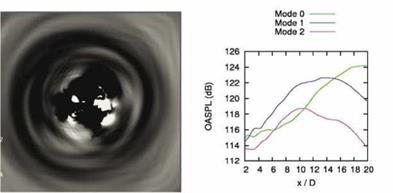
We can see in figure 18 that the downstream direction is, in agreement with what was observed experimentally, dominated by axisymmetric sound radiation. We will therefore focus on this component of the sound field, and see if we can ascertain the associated flow kinematics. Note the procedure that is being followed here: we are gradually eliminating flow information, thereby homing in progressively on the dominant aspects of the flow with regard to the acoustic observable. By doing so we simplify the task of analysing and later modelling the jet as a source of sound.
We now consider the temporal structure of the axisymmetric component of the sound field. Application of a wavelet transform[17] to the time history
|
Figure 18. Left: instantaneous image of the jet, taken in a cross-section at x/D = 7; note the azimuthal organisation of the radiating pressure wave. Right: jet directivity as a function of azimuthal Fourier mode; note, consistent with image on the left, dominance of the axisymmetric mode in the downstream direction. |
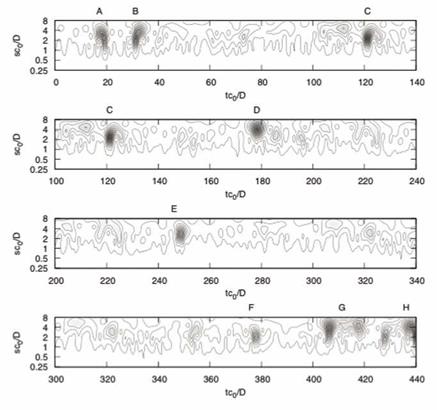
of the axisymmetric mode of the sound field at each axial station provides a corresponding scalogram. Figure 19 shows an example for the axial station, x/D = 17 (i. e. at low emission angle, в « 30°). A series of high-amplitude events, labelled A – H, stand out. By setting a threshold the scalogram can be filtered and the time signal reconstructed such that only the said events are retained. In what follows we concentrate on the first high-amplitude event. This filtering procedure is applied to the sensors at all axial stations and the result is shown in figure 20. We have here isolated one particular piece of the observable, ц_л(т = 0 ; 19 < tc0/D < 30), and from this filtered information we will now work our way back into the flow, qD, in order to analyse and understand the flow events that caused the high-amplitude sound pressure fluctuation.
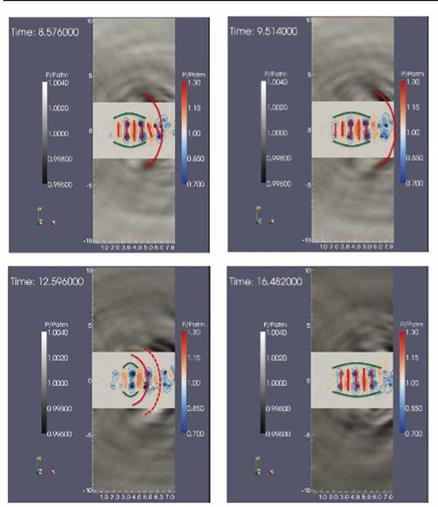
Figure 21 shows the flow at four consecutive times during the production of the said fluctuation. The following behaviour is observed. At t = 8.576 (top left) we see an axisymmetric wavepacket extending out to about x/D = 5, downstream of which the structures are tilted into something closer to mode 1. As far as the axisymmetric component of the flow is concerned we therefore have a truncated wavepacket. We saw in section §3 how such behaviour can lead to enhanced acoustic efficiency, and, indeed, consistent with this, a high-amplitude depression is emitted from the flow
|
Figure 19. Scalogram computed from the time history of the axisymmetric acoustic mode at r/D = 9, x/D = 17 |
at this time. This propagating wave is the same observed in figure 20 at (tc0/D « 20; 15 < x/D < 20). After the emission of this wavefront the axisymmetric wavepacket extends axially, as seen in figure 21 at t = 9.514, and then undergoes a second truncation, at both the upstream and downstream ends (t = 12.596), at which point a second wavefront is released from the flow: this corresponds to the second depression observed, after wavelet transform, in figure 20, at (tc0/D « 25; 15 < x/D < 20). Finally, the axisymmetric wavepacket increases in both intensity and axial extent, as seen in figure 21 at t = 16.48, before collapsing a third time (not shown)
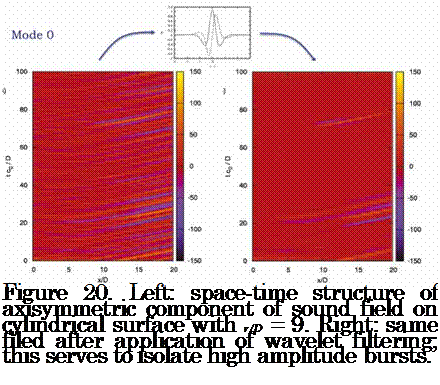 |
and thereby releasing the third wavefront observed in figure 20.
The flow kinematics associated with the high-amplitude axisymmetric acoustic wavepacket is thus seen to comprise a drifting of the flow in and out of axially-extended axisymmetry; i. e. we have space-time modulation, or ‘jitter’ of an axisymmetric wavepacket. This behaviour is reminiscent of the observation of Crow and Champagne (1971) cited earlier: “three or four puffs form and induct themselves downstream, an interval of confused flow ensues, several more puffs form, and so on”. The third wavepacket ansatz proposed in section §3 would therefore appear to be appropriate. We recall the source model
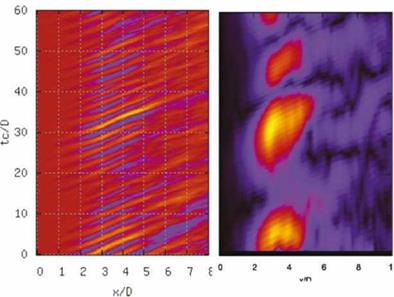
By application of a short-time Fourier series (figure 22), followed by the fitting of a Gaussian envelope function (figure 23), values of A(t) and L(t) are obtained. Inserting these into equation 109 and then solving the wave equation with this as source allows us to assess to what degree our kinematic
|
Figure 21. Visualisation of the hydrodynamic pressure within the jet at times corresponding to the acoustic wavepacket identified by wavelet transform in figure 20 |
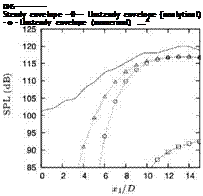
source model, s(q, o), reproduces a result, q^, which is close to the acoustic observable q^- The result is shown in figure 24 , where the result of the model is compared with both the OASPL of the axisymmetric mode of
|
Figure 22. Left: space-time structure of axisymmetric component of axial velocity fluctuation at r/D = 0.5; right: short-time Fourier transform of the data in figure on the left. |
|
Figure 23. Gaussian functions are fitted to the result of projecting the flow data on the short-time Fourier series. In this way, values for the instantaneous wavepacket envelope amplitude, A(t) and length scale, L(t) can be obtained. |
the LES, and a result obtained using a wavepacket ansatz where the time – averaged values of the A(t) and L(t) are used, i. e. a wavepacket that does not jitter. Whereas the non-jittering wavepacket shows a 12dB discrepancy
 |
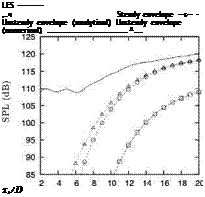 |
Figure 24. Comparison of the DNS and LES sound fields, left and right, respectively, with those obtained using simplified, jittering source models.
with the LES, showing it to be clearly incorrect, the jittering wavepacket is within 1.5dB, suggesting that this kinematic description is physically pertinent: this confirms that this behaviour comprises flow directions that are aligned with the propagation operator. The same procedure applied to the DNS database produced similar agreement, as can be seen in figure 24.
The next stage in the analysis methodology, which is work in progress, is to repeat the above analysis with respect to the other azimuthal Fourier modes of the sound field, in that way building up a composite, simplified kinematic description of the jet as a sound source, at which point it will be possible to address the question of the associated simplified dynamic law. Tools for reduced order dynamical modelling are outlined briefly in section §6.


