Gated Intensity Ratio Method
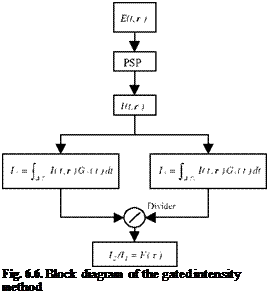
The gated intensity ratio method, as illustrated in Fig. 6.6, gates the modulated luminescent signal by applying two gain functions over two different intervals, i. e.,
I1 = f I(t)G1(t)dt and I2 = f I(t)G2(t)dt, (6.23)
A T1 A T2
where the gain functions G1(t) and G2(t) are certain time-varying functions. A ratio between the gated intensity integrals, I2 /11, is a function of the luminescent lifetime for given modulation parameters. In the simplest case, the gain function is a top-hat function or a square function where G1(t) = G2(t) = 1 in the time intervals AT1 and AT2 and G1(t) = G2(t) = 0 elsewhere. In this case, the square waveform of G1(t) and G2(t) serves as an ‘on-off’ gating function. The functional form for the excitation light and gain function can be selected to meet the requirements for a specific test. Common combinations are a pulse excitation with a square gain function (pulse-square), a sine-waveform excitation with a square gain function (sine-square), a square-waveform excitation with a square gain function (square-square), and a sine-waveform excitation with a sine – waveform gain function (sine-sine) (Goss et al. 2000).
 |
The modulated luminescent intensity is integrated over a gate time interval from 0 to 1/2f (0 to nin m t) and over a gate time interval from 1/2f to 1/f (nto 2nin m t) relative to a modulated excitation light. For the Fourier-series-form of the modulated excitation light Eq. (6.4), a ratio between the two integrals is
|
|||
|
|
||
|
|||
|
|||
|
|||
|
|||
|
|||
|
|||
|
|||
|
|||

![]()
|
|
|
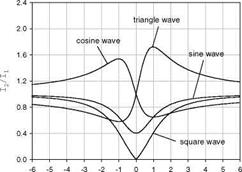
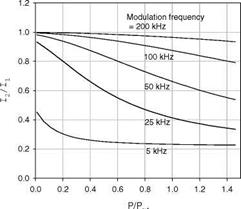
For the sinusoidal excitation light, the non-dimensional modulation frequency and modulation depth can be selected to achieve the greatest sensitivity of the gated intensity ratio to pressure defined as
The optimal modulation frequency for the maximum sensitivity is
(ai)0p _{3 «1.732 . (6.27)
For Ru(dpp) in GE RTV 118 that has the lifetime of 4.7 p. s at the ambient conditions, the optimal modulation frequency is 59 kHz.
The appropriate modulation depth H can also be selected according to certain criteria for a balance between the pressure sensitivity and SNR. It is noted that the off-phase intensity I2 _ (Am x/2f)[1 -(2H/ж)(1 + m2x2)- ] decreases as H increases and the normalized off-phase intensity at the optimal modulation frequency is I2/(I2)H_0 _ 1 – H / 2rn. Since the SNR is proportional to
[I2/(I2 )H_0]1/2 _ (1 – H/2n)1/2, the SNR is a decreasing function of H in a range of 0 < H < 1. On the other hand, the normalized sensitivity Sp at the
optimal modulation frequency, which is proportional to H /(2n+ H )2, is an increasing function of H in a range of 0 < H < 1 . Therefore, the appropriate
modulation depth H of about 0.5 is chosen to achieve both a high SNR and good pressure sensitivity.
The gated intensity integrals I2 and I2 are taken over the intervals from 0 to 1/2f (0 to n in m t) and 1/2f to 1/f (n to 2n in m t). The time variable t in these integrals is relative to the modulated excitation light. The integration is carried out immediately after the measurement system receives a trigger signal that is synchronized with the modulated excitation light. The trigger signal can be provided by a photodiode sensing the excitation light or a driver for the modulator. In practice, however, the trigger signal may have a time delay relative to the excitation light. The time delay, although small, may significantly alter the relation between I2 / I1 and pressure especially when the modulation frequency is high. For the sinusoidally modulated excitation light E(t) _ Am[ 1 + H sin( m t)] , if the trigger signal has a time delay At, the gated intensity ratio is
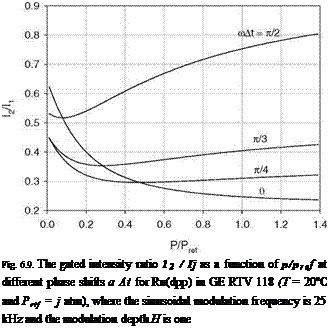
where cos( y)_ 1/^1 + (mx)2 . For a typical PSP, Ru(dpp) in GE RTV 118, Figure 6.9 shows the relation between I2 / I1 and p/pref for different phase shifts mAt, where the sinusoidal modulation frequency is 25 kHz and the modulation depth is H = 1. It is clear that the behavior of the relation is significantly affected
 |
by the phase shifts a At and the curve is even no longer monotonous when the phase shift is large. The similar change also occurs for the excitation light having other waveforms like the square waveform. This change due to the trigger signal delay was observed in experiments.
Furthermore, the gated intensity ratio method can be applied to the pulse excitation light; in this case, the luminescent intensity signal is I(t) = Amexp( -1/t ). For two gating intervals [t0,tj] and [t2,t3] where
t3 > t2 > tj > t0 is assumed, the gated intensity ratio is
For the given gating intervals, the ratio I2 / I1 is only related to the lifetime. This integration approach was used as an alternative to the time-resolved pulse approach, which was called the time-resolved multiple-gate method by Goss et al. (2000). Bell (2001) discussed an optimization problem of the gating parameters (t0, t1, t2, t3) to achieve the maximum sensitivity in an ICCD camera system. In
 a limiting but representative case where the time t g intervals [0, tg ] and [tg, ] (t0 = 0 , t3 , t1 = t2
 exp(- tg/T)
1 – exp( – t /t )
Although the above methods utilize two gating intervals, three gating intervals can be similarly used and therefore two gated intensity ratios like Il /12 and Il /13 can be obtained. If the two gated intensity ratios have sufficiently different dependencies to pressure and temperature for certain PSP, the surface pressure and temperature distributions can be determined simultaneously from the gated intensity ratio images.


