High Angle of Attack Range
An understanding of the aerodynamic behavior of airfoils in the high AoA regime is important for predicting the adverse effects produced in the reverse flow regime on the rotor. In the reverse flow region, the AoA increases through stall beyond 90° as the direction of the relative flow vector now changes from the trailing edge toward the leading edge of the airfoil. Although the velocities and dynamic pressure are low in this region, the low maximum lift coefficients and high drag coefficients associated with flow separation may result in a higher overall parasitic power penalty (see also Section 5.5.10).
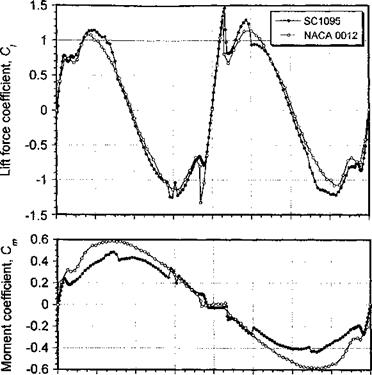
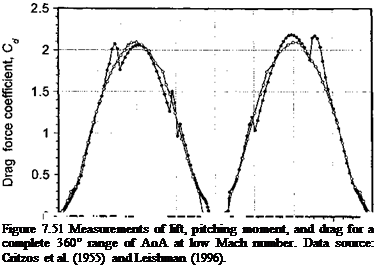
The aerodynamics of airfoils at extreme angles of attack beyond the normal static stall angle and in reversed flow have been measured by Lock & Townend (1925), Anderson (1931), Naumann (1942), Critzos et al. (1955), and Leishman (1996). All measurements are at low Mach numbers. Representative results are reproduced in Fig. 7.51, which shows the lift, pitching moment, and drag characteristics as a function of AoA. Although the airfoil shape makes some difference to the nature of the stall characteristic at positive and negative angles of attack and in reverse flow, when the flow becomes fully separated the results become mostly independent of airfoil shape and are close to the values for a flat-plate.
In the high AoA range, the quasi-steady lift coefficient can be modeled using
Ci = A sin2(o! — «о), (7.109) where A = 1.1 for the NACA 0012 and A = 1.25 for the SC 1095 when determined in a least-squares sense, with a being measured in degrees. An average value of 1.175 would seem reasonable for use with an arbitrary airfoil where the force coefficients are not known. For either airfoil, the center of pressure in the post stall regime moves close to mid-chord when or = 90° (i. e., xcp = 0.5). For the ranges 20° < (a — ccq) < 160° and —160° < (a — q? q) < —20° the center of pressure varies approximately linearly with a and can be represented by
xCp = 0.33 + 0.0019(a – or0) for 20° < (a – a0) < 160°, (7.110)
xcp = 0.33 – 0.0019(a – a0) for -160° < (a – a0) < -20°. (7.111)
Alternatively, the pitching moment in the post stall regime can be modeled directly using Cm — В sin(o: — «о) + C sin 2(ar — a0), (7.112)
 |
 0 F-i ■ – T–I ■’ ‘-і … ………………………………………… І ■ іЧфг-ч І… і, т-^
-180 -135 -90 -45 0 45 90 135 180
Angie of attack-deg.
where В = —0.5 and C = 0.11 are the averages for the two airfoils, which would seem appropriate choices for an arbitrary airfoil. Finally, the drag can be modeled using
Cd = D + E cos 2(a — «о), (7.113)
with D = 1.135 and E = —1.05 for both airfoils.
Angle of attack – deg.
 |
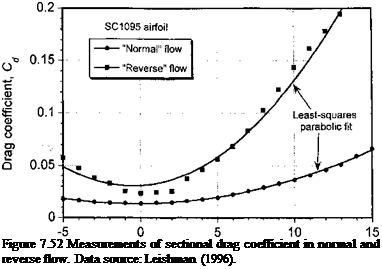
It becomes harder to model empirically the aerodynamic characteristics in the reverse flow regime. This can be seen if the drag coefficient in “normal” and “reverse” flow is examined in detail, as shown in Fig. 7.52. While the drag in normal flow is accurately represented by a simple parabolic fit, this is less applicable for the case of reverse flow. Notice that in this case the minimum drag is approximately double the minimum drag in normal flow’. Also, notice that the drag increases much more rapidly as the AoA is increased to either positive or negative values. Because the drag in reverse flow exhibits a “bucket” region, it is apparent that a parabolic fit to the measured data is less accurate in this case.
The forgoing discussion is based on the assumption that the flow in the reverse flow region is quasi-steady, but this may not necessarily be representative of the actual flow state on the rotor. This is because the flow in the reverse flow region is actually dynamic (unsteady) in nature, and the flow may not have time to adjust to the quasi-steady values. For a typical helicopter it can be shown that the aerodynamic time scales are between 2 and 6 semi-chords of airfoil travel through the flow in the reverse flow region. Based on known results from unsteady airfoil measurements [see Green (1995) and the results in Chapter 8], these time scales are short to allow the flow to readjust, even if the angles of attack were to become low enough to promote flow reattachment with reverse flow. For this reason, it is more accurate to calculate the airloads in the reverse flow region by means of a dynamic stall model (see Section 9.5.1). However, in the absence of such a model or other information then if the flow is stalled it would be sufficient to assume that Q = 0, xcp — 0.5, and Cd = 2.05 in the reverse flow region when using the blade element method. (Note: Cd ^ 2 for a flat-plate at a — 90°.)


