High-lift effects
4.7 The lift force on any lifting body, as defined in Fig. 4.14 as the component of the resultant air force which is normal to the mainstream direction, must always have a maximum value with respect to the angle of incidence, since it is zero at about a – 0 and again zero at about о = 90°, where only drag forces occur. But on classical aerofoils and wings, a maximum lift coefficient, Cj, usually occurs much before this is reached, as a result of flow separation: classical aerofoils and wings stall.
a b c
|
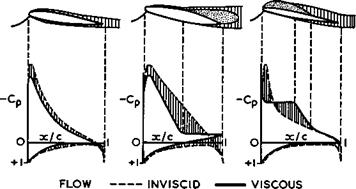
Fig. 4.38 Various types of flow on twodimensional aerofoils (schematic) |
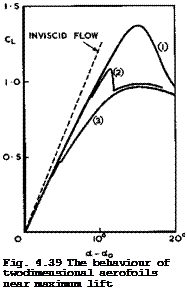
It is convenient to distinguish between several different types of flow over twodimensional aerofoils to describe the behaviour at and near maximum lift. These are sketched in Fig. 4.38, and Fig. 4.39 indicates how these manifest themselves in the shapes of the function Ct (a). The flow (a) in Fig. 4.38 is meant to illustrate how an attached boundary layer and a wake affect the pressure distribution and hence reduce the lift, as discussed in Section 4.5. Thus the actual initial lift slopes, such as those in Fig. 4.39, are always lower than those estimated for inviscid flow. Flow separation in such a twodimensional flow leads to separation surfaces which take the form of bubbles, as discussed in Section 2.4. The flow separation may start near the trailing edge and then move forward with increasing angle of incidence. The separation bubble may then extend beyond the trailing edge into the wake, as indicated in case (b) of Fig. 4.38. This rear separation leads to a smoothly-rounded lift curve (1) in Fig. 4.39, where the maximum occurs when the bubble has already been established and is large enough. On other aerofoils, the flow separation may start near the leading edge and lead to the formation of a long separation bubble which reattaches to the surface upstream of the trailing edge, as indicated in case (c) of Fig. 4.38. This leading-edge separation leads to a slight
kink in the lift curve (3) in Fig. 4.39, when the bubble first appears, and then again to a smoothly-rounded lift curve where the maximum occurs when the bubble is long enough and extends over about half the chord. Curve (2) obtains
 LIVE GRAPH
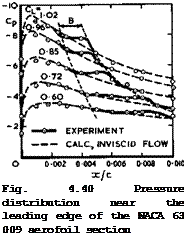
Click here to view when, under certain conditions discussed in Section 2.4, leading-edge separation occurs and leads first to the formation of a short ЪиЬЪЪе which reattaches to the surface within J% or 1% of the aerofoil chord and causes very little deviation from the pressure distribution given by the approximation for invis-
 LIVE GRAPH
Click here to view
cid flow. A typical example from the classical test by G В McCullough & D E Gault (1951) is shown in Fig. 4.40. The region over which boundary-layer traverses indicated that a bubble existed is marked "B". This bubble length fits in quite well with the concepts and estimates proposed by M Gas ter (1966). The bubble clearly exhibits all the features discussed in Section 2.4: some upstream influence, increasing the pressure above that in inviscid flow; a nearly – constant pressure over the front part of the bubble; and a pressure rise where
The Aerodynamic Design of Aircraft
the bubble reattaches to the surface, so that the pressures downstream of the bubble are nearly the same again as those in inviscid flow: a very localised phenomenon, then, set up and completed well within the first 1% of the chord. The pressure-rise coefficient through turbulent mixing, defined by (2,39), must then be just large enough to bring the pressure back to that required in attached flow. Such a short bubble may also be the mechanism for the transition to a turbulent boundary layer after reattachment to the aerofoil. This remarkable flow element is hard to detect but very useful in practice as a means for achieving some pressure rise. The aerofoil stalls when the bubble bursts9 that is to say, when the external flowfield demands a pressure-rise coefficient greater than about 0,35, which mixing cannot supply (see L F Crabtree (1957), I Tani (1964), M Gaster (1966), D S Woodward (1967), H P Horton
(1967) ). The flow breaks down and reattachment occurs very much further downstream, if at all. The lift curve (2) in Fig. 4.39 then has a sudden break
at CLmax *
|
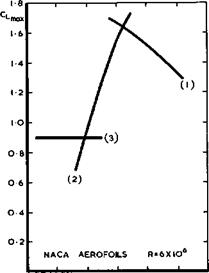
O 0 02 0 04 0 06 0 08 О IO 012 t/c AT x/c =0 05 Fig. 4.41 Maximum lift obtained on various twodimensional aerofoils |
This classification into three basic types of stall can be used to bring some order into the mass of existing empirical data. Following H Multhopp (1948) and plotting measured values of CLmax against some aerofoil shape parameter such as the thickness at 5% of the chord (the nose radius is often used as an obvious but not so trenchant an alternative), we can discern three envelopes as upper bounds to the lift obtainable from this particular set of aerofoils, according to the three types of stall in Fig. 4.39. Fig. 4.41 shows the envelopes which may be roughly designated as: (1) rear stall on thick aerofoils (overall t/c – 0.12 or more); (2) leading-edge stall with short bubbles (roughly, t/c about 0.09); and (3) leading-edge stall with long bubbles on thin aerofoils (roughly, t/c « 0.08 or less). In the latter case, does not depend much on the aerofoil shape, provided the type of flow occurs.
In view of the complexity of these flows, it is not surprising that the available methods for calculating them and for predicting CLmax are rather poor
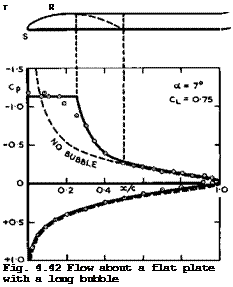
(see e. g. D KUchemann (1953), L F Crabtree (1957), and more recent papers in AGARD CP-102 (1972)). How a long bubble can be incorporated into the complete twodimensional flowfield of an inclined flat plate has been shown by E C Haskell (1956, unpublished; see L F Crabtree (1957)), which gives a useful insight into the flow mechanisms which are likely to be involved. In Maskell’s inviscid-flow model, Fig. 4.42, the lower surface of the plate is regarded as
 LIVE GRAPH
Click here to view a solid surface whereas a free streamline at a constant pressure issues from the separation line S at the leading edge, leans over, and becomes parallel to the plate at the top T of the bubble. The reattachment process then begins and is assumed to be completed at the point R. In the simplest model, the mixing is taken to lead to a displacement thickness which remains constant and equal to the height of the bubble at T. The pressure along the displacement surface between T and R must then rise. Downstream of R , the displacement thickness may also be assumed constant over the plate as well as in the wake, although this cannot be strictly true. The wake then turns back into the mainstream direction. This flow model, where either velocities or flow directions are specified, lends itself to treatment by the hodograph method.
An infinite number of solutions is obtained for different bubble lengths, the pressure being the lower the shorter the bubble, in accordance with the physical picture we have in mind. Very short bubbles, which cause only a local perturbation, are also included. The solutions all have another physically significant feature in that the pressure downstream of the reattachment point R approaches that of the inviscid flow past the flat plate without a bubble, as can be seen from the example in Fig. 4.42: after a while, the flow "forgets" what it has been through further upstream and reverts to the attached flow which has the same direction along the displacement surface as the plate itself. We note that this is a general feature of many flows, even when there has been a shockwave in the outer flow and a bubble in the inner flow (see below, Section 4.8). We can make use of this feature by selecting that particular solution which requires the value of the pressure-rise coefficient to be the largest available, probably about о – 0.35, i. e. we assume that Nature tends to go to the limit of what can physically be done. This has been assu-
med in the example in Fig. 4.42, and it can be seen that this flow model represents the main features of the experimental results (circles) quite well (these results have been taken from G В McCullough 4 D E Gault (1951) for the NACA 64 006 aerofoil section, with the pressures for a ■ 0 subtracted, a * 7° and CL *» 0.75 for both the theoretical and experimental results).
Another method by H C Kao (1974) correlates the pressure distributions over long bubbles by using reduced coordinates originally intended for separated base flows (see also Section 5.9), together with a pressure-recovery coefficient similar to that of (2.39). It is then possible to predict the allowable angle of attack for maximum lift of moderately thick aerofoils. While these theories explain the physical phenomena fairly well, it is still a long way to go to a routine method which will predict CLmax in practical threedimensional flows. This is why it is so important to have good experimental means for determining the stalling characteristics of wings. A special technique has been developed by H Werl£ & E Erlich (1973), which allows the flow around large models of leading edges to be studied in detail.
 LIVE GRAPH
Click here to view
Other theoretical attempts have been concerned with bubble separations which extend beyond the traibing edge. Beginning with G Kirchhoff (1869), who applied Helmholtz’s concept of surfaces of discontinuity to the flow past a flat plate at right angles to the stream and obtained a solution for a bubble extending to infinity downstream with a constant pressure inside it and along its boundary, equal to the undisturbed mainstream pressure, many have provided solutions for a variety of cases (see e. g. L C Woods (1961)). One of the latest, which has been developed for aerofoils, is that of К W Jacob (1969). This
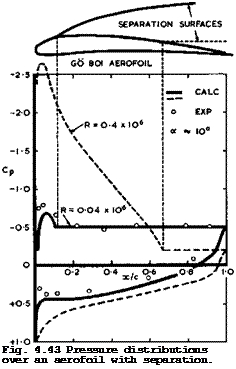
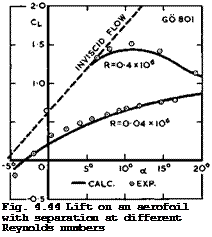
is based on the concept of A Betz & I Lotz (1932), already mentioned in Section 4.5, where a flow with two separation lines from the surface is simulated by a distribution of sources between the separation points. The bubble is then infinitely long and the pressure along its contour is nearly constant over the front part and then approaches the undisturbed pressure further downstream. In a complete and consistent iteration procedure, the inviscid flow with specified separation points is calculated first; in the second step, the boundary layer is determined and the angle of incidence varied until the boundary-layer separation points coincide with those specified in the first place. Such a method is well-suited for computers, applying distributions of singularities along the surface throughout, but the physics of the flow is only crudely represented. Nevertheless, the examples shown in Fig. 4.43 illustrate the main features of this type of flow quite well and bring out differences which arise from different locations of the separation point on the upper surface at different Reynolds numbers. Also, as shown in Fig. 4.44, the different lift cur-
 LIVE GRAPH
Click here to view
ves C^(a) and – values can be predicted reasonably well by Jacob’s method, in this particular case where the Reynolds numbers are very low and the effects very pronounced. On the other hand, more detailed investigations by
|
Fig. 4.45 Measured and calculated pressure distributions over an aerofoil |
LIVE GRAPH
Click here to view
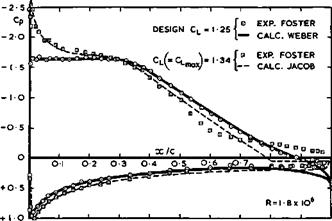
D N Foster (1968, unpublished) have shown that this flow model is not quite adequate to represent the upstream influence of the rear separation: an aerofoil designed by J Weber (1968, unpublished) to have a roof-top pressure distribution at a relatively high C^-value (1.25) does indeed produce that pressure distribution at the design point, Fig. 4.45, but, at the low Reynolds number of the test, rear separation sets in at only slightly higher angles of incidence. This has a snowballing effect in that it makes the adverse pressure gradient even steeper and thus causes the separation point to move forward and the bubble to grow even bigger, but Jacob’s theory predicts only part of this fundamental effect.
The example in Fig. 4.45 and the general limiting curves in Fig. 4.41 show that we cannot expect to obtain significantly more lift from a single aerofoil of fixed geometry than between about CL – 1.0 and 1.6 . But we have also seen, in Section 4.1, how great the incentive is to make the wings of classical aircraft small and light. This leads to a fundamental conflict between the design aims for high-speed cruise and for low-speed take-off and landing, which is peculiar to classical aircraft (see Fig. 4.10). The same wing cannot serve both purposes well, and something must be done to resolve this conflict. The type of flow may remain the same under all flight conditions, but it may have to be achieved by different geometric configurations. We have already anticipated in Fig. 4.1 that it is indeed possible to find a series of configurations which can be operated satisfactorily.
On the aerodynamic side, one aim is to achieve usable C^-values at low speeds which are significantly higher than those which a plain wing can produce. To achieve this, we must either vary the geometry of the wing; or control the development of the boundary layer in some beneficial way; or move wings relative to the flight path; or use the propulsive engines to give some powered lift. In the course of time, therefore, a great multitude of high-lift devices has been proposed and developed. A recent assessment of such lift-augmentation devices may be found in AGARD LS-43 (1971).
|
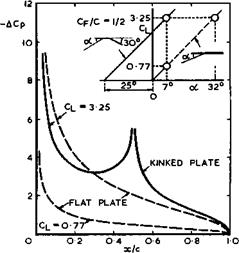
Fig. 4.46 Load distributions along the chords of twodimensional flat plates and a kinked plate |
Variable geometry is particularly suited for the concept of the classical air-
CL = 86 ^|c^ when Cp « 1 . (4.125)
These results may be compared with what is obtained when the same procedure is applied to an aerofoil which is continuously cambered like a parabolic arc:
z = 4fx(l – x) ; dz/dx = 4f(l – 2x) . (4.126)
In that case,
Cl – 4 it f. (4.127)
If Op * I and the maximum camber f = J6 , then the lift of the kinked aerofoil is only 82% of that of the cambered aerofoil. But this is achieved when the slope at the trailing edge of the kinked aerofoil is only 1/4 of that of the candbered aerofoil. Deflected flaps thus appear to be quite an effective means for generating lift by variable camber.
To find the spanwise loading, (4.56) can be used. In this approximation, the lift slope C-^/a of cambered or flapped aerofoils remains the same as for flat wings (namely, 2ir), and the effect of camber or flap deflection appears as an angle of twist
Ла = " 2ЇГ CL *
with Cl taken from (4.124) or (4.127). This has to be added to the geometric angle of incidence a(y). However, threedimensional effects on swept wings introduce further complications, as will be seen below.
It is not immediately apparent from the results in Fig. 4.46 why it should be easier to realise the flow past a kinked plate in a viscous medium than that past a straight plate. Obviously, the regions near the leading edge and near the hinge require attention before a satisfactory practical high-lift device emerges.
Although simple hinged flaps have some use in practical applications, realistic high-lift flows can be achieved only by more complicated devices. One such device which involves only shaping the aerofoil in a suitable manner is the incorporation of one or several slots, that is, ducts which allow air to pass through the aerofoil from the lower surface to the upper surface. If applied properly, this flow of air may help to delay the onset of separation of the boundary layer from the upper surface in the regions of high adverse pressure gradients, which are so clearly apparent in Fig. 4.46. F Handley Page and G V Lachmann proposed the application of slots in 1921 and measured a value of Сцпах as high as 3.9 at a Reynolds number as low as 10^ on a multiple aerofoil consisting of no less than eight parts separated by seven slots, arranged like a cascade on a highly-cambered chordline (at an angle of incidence of 45°) – a convincing demonstration of the principle!
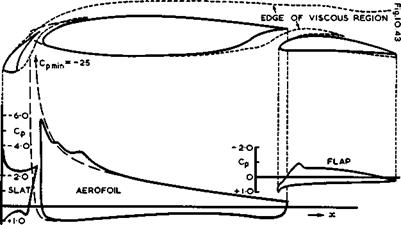
Of the many possible applications of this principle, a modern multiple авто foil is shown in Fig. 4.47, with a slat and a single-slotted trailing-edge flap. The pressure distributions, taken from D N Foster (1972), indicate how the flows through the slots are accelerated and lead to pressures at the trailing edges of the slat and of the main aerofoil which are much lower than usual, and hence require smaller adverse pressure gradients to be reached. Also, the suction peak on the leading edge of the main aerofoil is much less pronounced than on the basic aerofoil with slat and flap retracted at the same angle of incidence (dashed lines). Clearly, suitably-designed slots improve the flow in just the desired manner. Besides, there is a not insignificant increase in chord and hence in lifting surface, at the expense of an increase in mechanical complexity and hence in weight.
|
Fig. 4.47 Pressure distributions around a twodimensional aerofoil with slat (deflected 28°) and slotted flap (deflected 10°). After Foster (1972) |
The main features of this type of flow appear already in an inviscid flow. This is cumbersome to calculate analytically because multiple-connected regions are involved, so that the application of panel methods, such as that of J L Hess & AMO Smith (1967), is more practicable. However, this must be done with care to avoid gross numerical errors. The main causes of these have been identified by В R Williams (1972), who also proposed a general scheme for producing consistent solutions. Other methods for dealing with multiple aerofoils have been developed by К W Jacob (1962) and by D H Wilkinson (1967). In practice, double- slotted or even triple-slotted trailing-edge flaps are now quite common.
The effects of viscosity can, in principle, be taken into account in the manner outlined in Section 4.5, but they are more complex and stronger on multiple aerofoils. This is why their lift-to-drag ratios are much lower than those of single aerofoils (see Fig. 4.1). The extent of the viscous region can be seen in Fig. 4.47 for a typical case: evidently, the wake of the slat mixes in with the boundary layer along the main aerofoil, and the wake of the main aerofoil mixes in with the boundary layer along the flap. Thus, methods for calculating the development of ordinary boundary layers cannot be applied directly and must be extended to cover these more complex flows. Consequently, the available methods are even more tentative. Of these, we mention some that have proved useful: D N Foster et al. (1969), (1970), and (1972), H P A H Irwin (1972),
AMO Smith (1972) and (1974), J Steinheuer (1973), and especially T Seebohm &
В G Newman (1975).
To illustrate what happens on an aerofoil with a slotted flap, and also how far the effects can be estimated, we consider the problem of how wide the gap, g, between a main aerofoil and a flap should be if the shapes of both have already been given (this is a common case and, strictly, the slot shape is not then "designed" for its aerodynamic efficiency but results largely from geometric and engineering considerations). The aim is to achieve the highest possible overall lift. As can be seen from the results in Fig. 4.48, the estimated overall lift in inviscid flow falls steadily as the gap is increased: in this unrealistic flow, it would still be best to have the flap hinged on to the
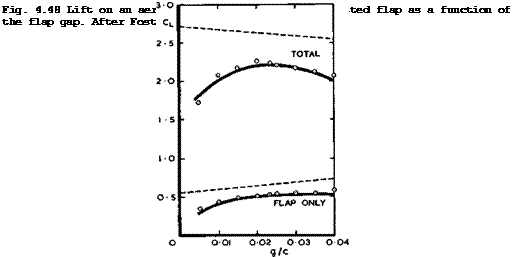 |
main aerofoil. The measured values (circles) are significantly lower, as must be expected, but by contrast, they show a well-defined maximum of the overall lift at a flap gap of about g/c – 0.02, in this particular case. Boundary-
layer and wake surveys indicate that, in this configuration as shown in Fig. 4.47, there is a stream of clean air flowing through the slot with full total head, and the boundary-layer on the flap only just merges with the wake from the main aerofoil. If the gap is wider, the lift drops, following the trend in inviscid flow, which is reinforced by viscous losses on the flap itself. If the gap is smaller, the viscous layers merge and this reduces the effectiveness of the slot and leads to a substantial loss of lift. The experimental trends are reproduced quite well by the calculated results of D N Foster et at, (1972) and of J Steinheuer (1973). The latter has also reproduced the observed changes with Reynolds number. This is an important aspect since windtunnel data obviously cannot be applied directly to full-scale aircraft and must be extrapolated. Further, such extrapolation methods are needed to find a full – scale configuration which will produce a type of flow that has been shown to be useful in windtunnel experiments. I C Bhateley & R G Bradley (1972) have developed such a flow model further by incorporating bubble separations in the manner of К Jacob (1969), as described above. A Moser & C A Shollenberger
(1973) have treated the interaction between wake and flap.
In general terms, these results indicate that the increase of the overall lift is caused not so much by the lift on the flap itself but by interferenee tift acting on the main aerofoil, when this is placed in a suitable position in the upwash field generated by the circulation around the flap. The same effect should result from any other device, as long as there is a circulation around it. S Neumark (1963) has confirmed this when he calculated this interference lift for the simple case of a twodimensional flat plate placed in the flow-
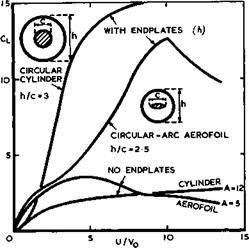
field of a line vortex. The lift increase may be considerable; it is highest when the vortex is placed on some line below and behind the trailing edge, as had already been found by I Ginzel (1941, unpublished). The question is how such a flow can be realised in practice. It has been known for a long time that circular cylinders (G Magnus (1853)) and wings (J C Maxwell (1853), see also N Joukowski (1906), D Riabouchinski (1909)) can generate a circulation and hence carry a lift force when they are rotated about their spanwise axes normal to the stream. Maxwell found that thin wings will even autorotate, at a circumferential speed U roughly half the forward speed Vo, if the wing is long enough. Everybody can easily check that by dropping a stiff
|
Fig. 4.49 Lift on rotating cylinders and aerofoils |
long strip of paper: rotating, it will not fall vertically downwards but
glide forwards at some angle to the vertical. The lift forces produced can be very large indeed, if twodimensional flow conditions are approached, as can be seen from the examples in Fig. 4.49 (from tests by A Busemann (1931), E von Holst (1941), D Ktichemann (1942) ,summarised by L F Crabtree (1957)). But work has to be done to drive the bodies, and the drag produced is also high: a rotating wing may have a value of Сьтдчг better than 12, at the
cost of a drag coefficient of about 10.
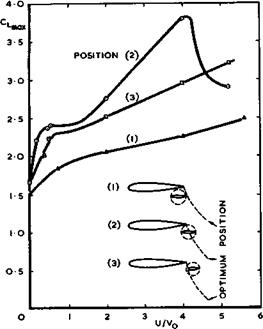
A rotating wing can be more efficient if it operates as a rotating flap in conjunction with a fixed mainplane. Fig.4.50 shows values of Cjmav for a wing with rotating flap as a function of U/Vo, from tests by D KUchemann (1941). The results confirm the concepts put forward above, in particular, Ginzel*s optimum position for the flap. That the maximum lift coefficient was not higher than about 3.8 was a consequence of flow separation in the junctions with the endplates, at the low Reynolds number of the test. L F Crabtree (1957) gave estimates for the power required to rotate the flaps.
The rotating flap demonstrates one of the principles of generating high-lift on classical wings very clearly; it would be at rest relative to the main wing during cruise; and it would be rotated at low speeds and then generate
|
Fig. 4.50 Maximum lift of an aerofoil with rotating flap. A ■ 2.7; elliptic endplates; Cp/c – 0.25; R * 0.14 x 10^ |
its own lift and induce much more on the main wing. Fears of mechanical difficulties have so far prevented any practical application.
Rotating ay tinders have also been proposed in a form where they are placed inside the main aerofoil or flap, with only part of the surface exposed to the stream in the region of a leading edge, say. With part of the wall moving in this way, the boundary layer can be expected to survive a stronger adverse pressure gradient without separation.
We mention briefly that great body of work which has been devoted to various means of controlling the development of the boundary layer. When Prandtl thought of the concept of the boundary layer in 1904 and the causes of flow separation, it occurred to him at once that sucking away the boundary layer should prevent separation: he put it to the test by placing a circular
cylinder with a suction slot in the stream, and it worked. In the meantime, this has been followed up by a large amount of research work on a great variety of schemes, and boundary layer control has been applied successfully to prevent or to postpone separation in regions of adverse pressure gradient on wings so as to achieve higher lift forces. Suction through discrete slots or through porous surfaces has been used, and there are now quite powerful methods for calculating the development of boundary layers with suction. Many of the standard boundary-layer methods have been extended to cover this case by replacing the condition of vanishing velocity at the wall by a more general boundary condition. Work on boundary-layer and flow control up to 1961 has been described and reviewed by G V Lachmann (1961). A counterpart to suction is fluid injection into the boundary layer through the surface (see e. g.
L 0 F Jeromin (1970)). It can readily be seen that, for example, blowing air tangentially into the boundary layer near the surface through a slot, say, should add energy to the boundary layer where it is needed in a way which should oppose the occurrence of separation. Schemes of this kind have also been applied successfully. For accounts of the aerodynamics of some of these pneumatic high-lift devices see e. g. J Williams et at. (1961), L В Gratzer (1971), and J von der Decken (1971). An example of a modern and very complex system is that described by К Aoyagi et al.(1972).
Adding energy can also be done in the form of heat. J Martin (1972) calculated the compressible flow around a twodimensional aerofoil with flap and found that heat addition over a suitable area can so reduce the adverse pressure gradient on the upper surface of the flap that greater flap angles than are normally possible can be employed without separation of the boundary layer; the result is an increase in lift.
Consider now the effect of sweep on the behaviour of aerofoils at high lift.
An interesting result has been obtained by J Weber (1959) for the pressure distribution near the leading edge of an infinite sheared wing in inviscid flow. The theory described in Section 4.3 is applied to aerofoils with elliptic nose shape, so that the shape can be described by the nose radius p, the thickness-to-chord ratio t/c, and the angle of sweep q> .
It then turns out that the value of the suction peak near the nose as well as its chordwise position depend only on the lift coefficient and on the nose radius and not on the angle of sweep. In fact,
To a first approximation, this simple relation is also true for conventional section shapes. Therefore, as far as leading-edge stall is concerned, any effects of sweep must stem from the viscous flow. These effects may be strong, however, as has been discussed in connection with the flow elements sketched in Figs. 2.4 and 2.5. The curvature of the streamlines past infinite sheared wings affects the transition mechanism in the boundary layer and encourages the occurrence of ordinary separation lines. Thus, in general, it becomes increasingly difficult to keep the flow attached around the leading edge as the angle of sweep is increased: since Nature abhors sweep, on principle,
there will be a limit as to how far we can go.
The discussion so far has been concerned mainly with twodimensional flows and, as usual, much less is known about threedimensional wings with high-lift devices. In principle, high-lift devices may extend the lift curve at the same slope to higher angles of incidence (e. g. some leading-edge devices); or change the no-lift angle (e. g. some trailing-edge devices); or change the sectional lift slope; or extend the wing chord. If the sectional data are known for twodimensional aerofoils and also the corresponding centre and tip effects, then the method described in Section 4.3 can be used in the standard way to determine the loading and pressure distribution. Complications must arise when the devices extend over only part of the span. Discontinuities in the effective angle of incidence, or the lift slope, or the chord then occur.
J Weissinger (1952) has shown how to add an extra pivotal point in Multhopp’s method of solving (4.81), and J Weber & J A Lawford (1964) have shown in a
The Aerodynamic Design of Aircraft
general way how to deal with such discontinuities within linearised theory. It is very tempting in such a case to leave the problem to a computer and to use a collocation-point or panel method, or to use an electrical analogy such as an electrolytic tank or a network (see e. g. L Malavard & R Duquenne (1952),
S C Redshaw & D Kilchemann (1954), G G Brebner & D A Lemaire (1955)). But, if we want more than plausible numerical answers, this case demonstrates very clearly and perhaps more convincingly than many others that, first, a better physical model of the flow than that implied in linearised theory is needed, and, second, that the behaviour in the neighbourhood of the flap edge should be known analytically and then incorporated into any numerical method. Even the results from an elaborate treatment (see R T Medan (1973)) based on linearised theory differ significantly from experimental results.
|
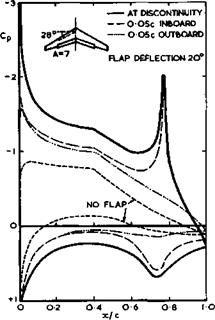
Fig. 4.51 Pressure distributions at and adjacent to a deflected part-span flap on a sweptback wing |
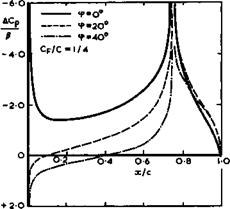
What goes on in the neighbourhood of the outboard end of a typical part-span flap can be seen from the experimental pressure distributions by J McKie (1974) shown in Fig. 4.51. The basic roof-top pressure distribution (no flap) is representative of sheared wings, and the pressures at the discontinuity bear some resemblance to what happens on a twodimensional flapped aerofoil (see Fig.4.46). But the pressures just inboard and just outboard of the end of the flap differ considerably from this and from each other, and we must suspect that, to represent these, a non^planar trailing vortex sheet must be built into the flow model, with a separation line along the side edge of the flap and a tip vortex sheet issuing from there, as described in Section 4.6 (see Fig. 4.34). A theory based on such a flow model has not yet been worked out, and we can present here only some results which have been obtained by a suitable extension of the RAE Standard Method by Л McKie (1969) and (1971). These take account at least of sweep and centre and tip effects and show how large these are and how far the loadings and the lift differ from the simple relations (4.122) and (4.124)
![]()
 |
Properties of Classical and Swept Aircraft
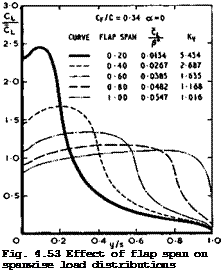
Fig, 4,52 Effect of sweepback on the chordwise loading distribution at the centre of wings of large aspect ratio for unswept wings of large aspect ratio. Calculated ehovdwise loadings in Fig. 4.52 show that the threedimensional centre effect is very pronounced indeed and of the same kind as that discussed in Section 4.4. Obviously, flaps are far less effective at the centre of sweptback wings than further out along the span. Fig. 4.53 shows calculated spanwise loadings for various spanwise extents of the flap (for a wing of aspect ratio 8,35, taper ratio 0.35, and midchord sweep of 25.4°, the inboard edge of the flap being at the centre line).
 LIVE GRAPH
Click here to view
The loadings are highly non-uniform for part-span flaps, and there is a strong incentive to design aircraft with full-span flaps. Similarly, cut-outs in the flaps are undesirable. These threedimensional effects not only detract from the efficiency of flaps as high-lift devices but may also cause a high vortex drag (see H C Garner (1970)). On a complete aircraft in flight, the lift must be obtained in such a way that the aircraft is trimmed with regard to a given
Previous Page
184
position of the centre of gravity. Moreover, the certification authorities demand that the aircraft be flown safely below the value of that can
actually be achieved (see Section 4.1). An instructive example of wing stall and typical flight-test results for usable CLm^x-values for the Fokker F 28 aircraft has been reported by T Schuringa (1972).
To control the behaviour near and beyond the stall, especially in conditions which are reached only inadvertently and not in normal flight, is still an empirical art and beyond available theories. Typical cases have been described by C L Bore (1963) and (1972). A multitude of special devices may be used to control the flow to some extent, often in an attempt to repair some deficiency in the basic design. Thus an array across the stream of small vanes or plates protruding from the wing surface – vortex generators – may intensify turbulent mixing downstream in their wakes and thus postpone flow separation by transferring energy from the mainstream into the boundary layer (see e. g. 1. H Tanner et al. (1954)). Larger plates mainly in a streamwise direction in the region of the leading edges ‘ – fences – act as partial reflection plates and thus change the pressures on either side, increasing the suction peak on the side where the leading edge is effectively sweptforward relative to the fence and decreasing it on the sweptback side, in the manner of the centre effect of swept wings, as explained by J Weber & J A Lawford
(1954) . Even though such a fence on a sweptback wing may produce a localised flow separation on the inboard side, the reduced suction on the outboard side may postpone a flow separation there, and delay the inward movement from the tips of a leading-edge separation up to a higher angle of incidence. Thus a separation all along the leading edge, as in Fig. 4.37, can be avoided: the
fence would cut the vortex sheet. Similar effects can be achieved in a similar way with discontinuities in the leading edge, such as cut-outs or sudden leading-edge extensions.


