Our heavyweight helicopter equal in the world does not have
In Rostov started production of the most load-lifting rotary-wing car The Russian holding «Helicopt[...]

Everything about aircrafts and helicopters. News and events in aviation worldwide. Civil, transportation, military helicopters and airplanes.

Everything about aircrafts and helicopters. News and events in aviation worldwide. Civil, transportation, military helicopters and airplanes.

Everything about aircrafts and helicopters. News and events in aviation worldwide. Civil, transportation, military helicopters and airplanes.

Everything about aircrafts and helicopters. News and events in aviation worldwide. Civil, transportation, military helicopters and airplanes.


The use of the NACA 0012 airfoil data in the hovering analysis is a valid assumption for normal hover conditions, since most airfoils used for rotors have
![]()
|
|
|
|
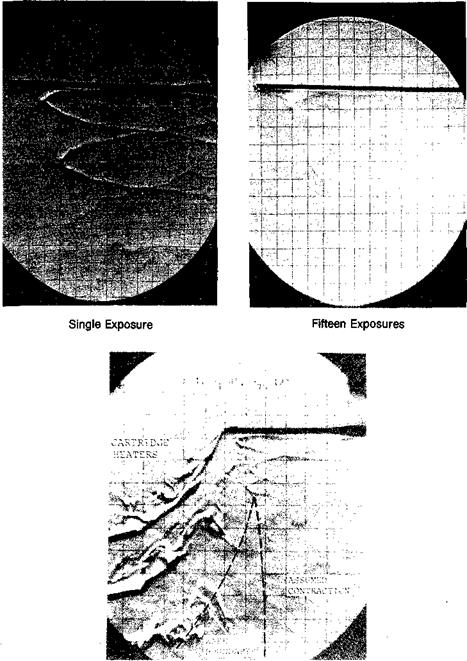
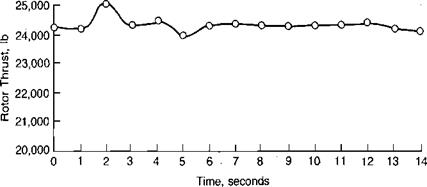
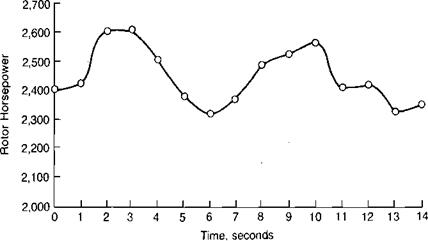
АН 56A Rotor on Lockheed Whirl Tower, z/D = 1.1 Wind Less Than 3 knots
|
|
FIGURE 1.36 Fluctuations in Whirl Tower Data |
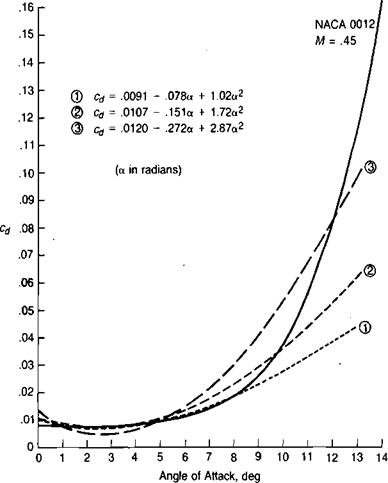
about the same lift and drag characteristics below stall and drag divergence. When an airfoil is used that has significantly different characteristics than the NACA 0012, a more sophisticated method of defining the drag coefficient than simply basing it on the average lift coefficient should be used. One method is to define the drag coefficient as a power series:
cd — cd0 + cd^ + oa2
where the coefficients are chosen to give the best fit to the experimental airfoil data. Figure 1.37 shows the NACA 0012 drag curve at 0.45 Mach number and three curves that each fit the data at 1°, 5°, and one other arbitrarily chosen angle of attack. The choice of which curve to use depends on the highest blade angle of attack for a given hover condition. Chapter 6 discusses airfoils in detail and lists data sources for a number of specific airfoils.
|
An airfoil that had significantly different drag characteristics than the NACA 0012 could be compared to it by assuming a rotor with ideal twist as above or its data could be used directly in the combined blade element and momentum method described later in this chapter.